2Q 2019 GMO Quarterly Letter
GMO is a Boston asset manager co-founded in 1977 by Jeremy Grantham with Richard Mayo and Eyk Van Otterloo, known for valuation-driven dynamic asset allocation built on long-horizon mean reversion. Grantham is famous for calling historic bubbles, warning publicly ahead of both the 2000 dot-com crash and the 2008 financial crisis. Flagship publications include the GMO Quarterly Letter (now written by Asset Allocation co-heads Ben Inker and John Pease), Grantham's Viewpoints essays and the 7-Year Asset Class Forecast.
In plain words
This report explains why big US companies have been super profitable over the past decade—not because they invested more or grew sales, but because they gained market power (like monopolies). They've been returning most of those profits to shareholders via buybacks instead of investing in new projects. The author warns this trend may reverse due to antitrust actions or regulation. For regular investors, this means US large-cap stocks might be overpriced. Instead, consider smaller US companies or overseas markets (like emerging markets), which are cheaper and have more room to grow. Bottom line: don't put all your eggs in the big US stock basket.
GMO’s Q2 2019 report points out that over the past decade, the U.S. stock market has significantly outperformed other global markets, primarily driven by U.S. corporate earnings growth far exceeding that of other regions, rather than merely by price-to-earnings ratio expansion. The improvement in ea
Theme and Background
This chapter focuses on the core driver of the U.S. stock market's outperformance relative to the rest of the world over the past decade: the structural improvement in the profitability of large enterprises. The report argues that this phenomenon stems not from revenue growth or increased investment, but from margin expansion, and is concentrated solely among top-tier companies, with small and mid-sized enterprises seeing little to no benefit.
Core Thesis
The author's central judgment is that the improved profitability of large U.S. companies may stem from enhanced market power (e.g., monopolistic positions, regulatory favoritism), but the future environment could turn unfavorable. However, the pace of adjustment will be very slow. Therefore, even under optimistic assumptions (slower mean reversion of profit margins), U.S. large-cap stocks remain more expensive than global equities.
Counter-Intuitive Judgments:
- The ratio of U.S. corporate profits to GDP rose from an average of 6% in the 20th century to 9% (post-2004), but this increase was not a broad-based phenomenon and was driven solely by the top 50 companies.
- High profits did not lead to increased corporate investment; instead, they coexisted with declining investment (the correlation between profits and investment fell from 35% to negative).
Key Arguments and Data
1. Structural Shift in Profits/GDP:
- 1929-2001: The profits/GDP ratio averaged approximately 6%, exhibiting mean-reverting characteristics.
- 2004-2019: The average rose to 9% and has not reverted to historical levels.
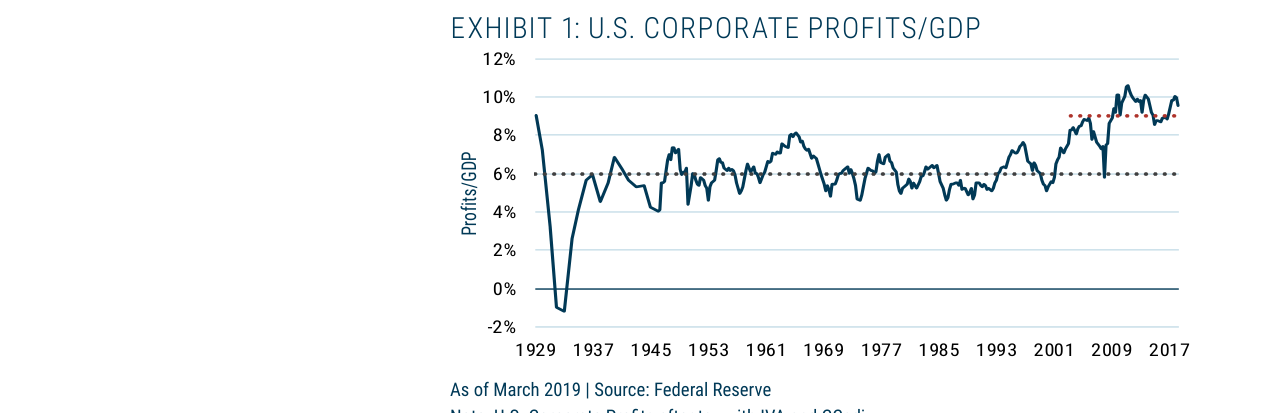
The ratio of U.S. corporate profits to GDP recovered after the Great Depression, averaged about 6% in the 20th century, and structurally rose to approximately 9%-10% after 2004.
2. Profitability Divergence (by Market Cap Rank):
| Company Group | Profit Margin (1986-1995) | Profit Margin (1996-2005) | Profit Margin (2006-2019) | Change vs. 1986-1995 |
|---|---|---|---|---|
| Top 50 | 15% | 20% | 24% | +62% |
| Rank 51-500 | 13% | 14% | 18% | +37% |
| Rank 501-3000 | 11% | 10% | 11% | +5% |
3. Adjusted Economic Profit Data (Excluding Accounting Distortions):
| Company Group | Economic Profit Margin (1986-1995) | Economic Profit Margin (1996-2005) | Economic Profit Margin (2006-2019) | Change vs. 1986-1995 |
|---|---|---|---|---|
| Top 50 | 17% | 22% | 26% | +50% |
| Rank 51-500 | 16% | 16% | 19% | +24% |
| Rank 501-3000 | 13% | 13% | 12% | -8% |
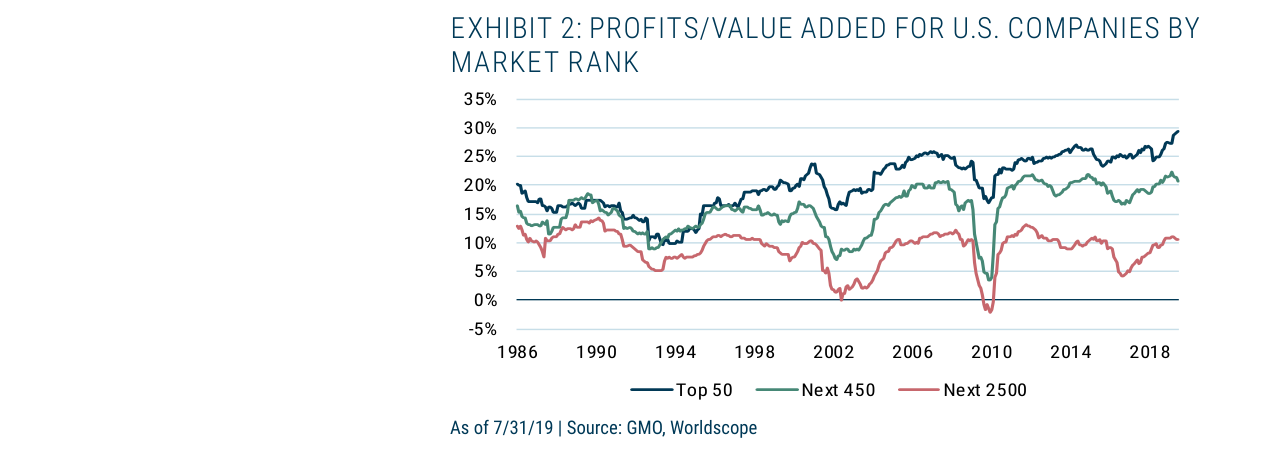
The ratio of profits to value added for the top 50 U.S. companies rose steadily from about 15% in 1986 to approximately 30% in 2018, while companies ranked below 2500 remained around 10% for an extended period.
4. Decoupling of Profits and Investment:
- 1960-2000: The correlation between profits and net business investment was approximately 35%.
- Post-2000: Profits rose, but net investment/GDP fell from 4% to below 2% (Exhibit 3).
- During the same period, the cost of equity financing (Shiller earnings yield) and debt financing (Baa corporate bond yield) were both at historical lows, ruling out the possibility that capital costs suppressed investment.
Companies/Assets Involved
- U.S. Large-Cap Stocks (Top 50 Companies): Profitability has improved significantly, but the author believes their valuations remain expensive, even under the optimistic assumption of slow margin reversion.
- U.S. Small and Mid-Cap Stocks (Rank 51-3000): Profitability has stagnated or even declined (on an adjusted economic profit basis), failing to benefit from the overall profit expansion.
- Global Ex-U.S. Stocks: Relatively more attractive than U.S. large caps due to lower valuations and underappreciated earnings growth potential.
Investment Implications
- Short/Underweight U.S. Large Caps: Even considering slower margin mean reversion, their valuations are higher than the rest of the world, and the future earnings environment may weaken (e.g., antitrust actions, regulatory tightening).
- Focus on Small/Mid-Caps and Overseas Markets: U.S. small and mid-cap stocks have not seen improved profitability and face less valuation pressure; emerging markets and developed markets (ex-U.S.) offer greater earnings growth potential.
- Beware the Long-Term Risk of Profit-Investment Decoupling: If large companies persistently fail to reinvest profits, it could undermine long-term economic growth potential, thereby suppressing overall stock market returns.
New Analysis: The Structural Dilemma of Profitability, Investment, and Productivity
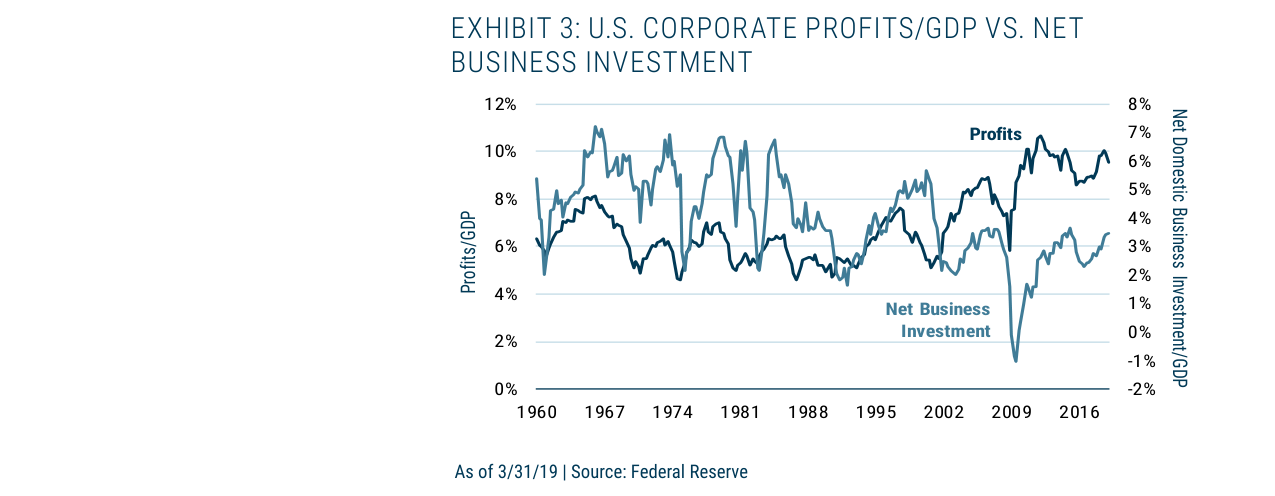
The correlation between corporate profits and net business investment was about 35% from 1960-2000, but after 2000, the profits/GDP ratio rose while investment/GDP fell, breaking the relationship.
1. Deep Mechanisms of Profitability Divergence and Investment Decoupling
The follow-up data further reveals the structural characteristics of profitability divergence among U.S. companies: Adjusted profitability for the top 50 companies increased by 50%, while the next 450 grew by only 24%, and the remaining companies declined by 8%. This divergence is not attributable to changes in accounting standards (e.g., capitalization of R&D and advertising expenses), as adjusted profitability improved across all periods and was not more pronounced in recent years. This rules out accounting "noise" as the primary driver.
Key Contradiction: Large companies' profitability has soared, but their investment rates have not kept pace. The follow-up analysis points out that large companies rely almost entirely on internal cash flow for financing, with the sole exception being mergers and acquisitions (which do not create new assets, only transfer ownership). Meanwhile, small companies, though reliant on external financing, have low profitability and lack the incentive to invest. This explains the breakdown of the "profit-investment" relationship.
Data Support: Table 3 shows that the effective payout ratio (including share buybacks) for the top 50 companies rose from 57% in 1986-1995 to 71% in 2006-2019; for the next 450, it rose from 41% to 72%; and for the smallest 2500, it rose from -1% to 32%. Large companies return over 70% of their profits to shareholders rather than investing them, directly weakening capital formation.
2. Industry Concentration and Rent Capture: The Root of Underinvestment
The follow-up analysis offers the most plausible explanation: The excess profits of large companies primarily stem from economic rents, not innovation or efficiency gains. Having already achieved dominant positions in their leading industries, their expansion opportunities are limited—entering new business areas may involve lower profit margins and competitive pressures. Consequently, investment opportunities have not grown in tandem with rents.
Counter-Intuitive Finding: The author acknowledges that attempts to prove a positive correlation between profitability and industry concentration (e.g., using the Herfindahl-Hirschman Index) were unsuccessful. This may be due to coarse data (e.g., overly simplified concentration metrics) or insufficient time dimensions. Logically, however, large companies have strong incentives to maintain the status quo: they are motivated to prevent disruptive innovation to avoid regulatory scrutiny (e.g., antitrust investigations into tech giants in the U.S. and abroad).
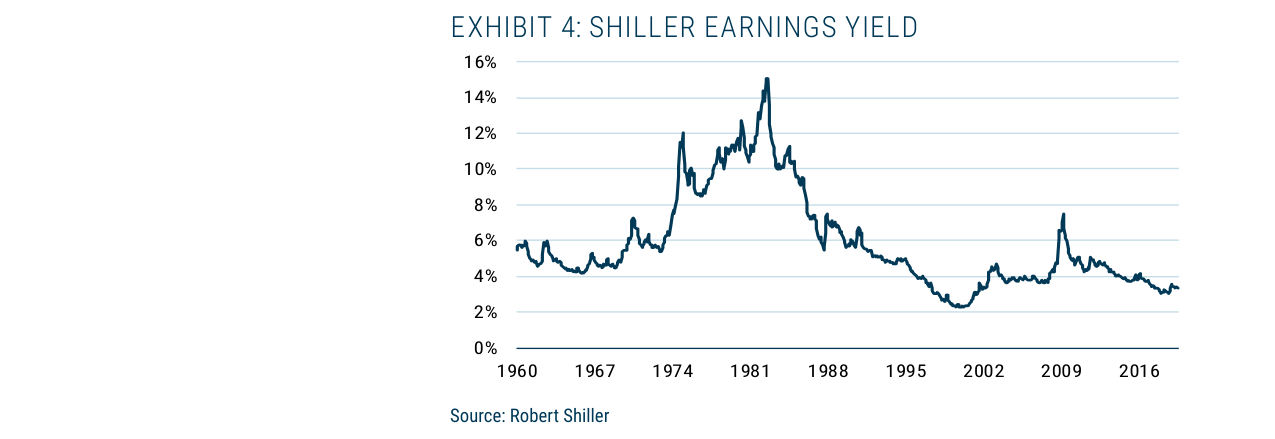
The S&P 500 Shiller earnings yield declined from a peak of about 15% in 1981 to approximately 3.5% in 2019, indicating a significant rise in stock valuations.
Comparative Data: Among 63 U.S. industries, productivity growth in the IT sector plummeted from 12.9% per year in 1998-2005 to 3.9% per year after 2005, while the median productivity slowdown for other industries was only 2.2%. This suggests that technological bottlenecks (e.g., the slowing of Moore's Law) are partly responsible for the productivity decline, but underinvestment has exacerbated the overall predicament.
3. Historical Break in Productivity Growth and Future Concerns
Exhibit 8 shows that U.S. 5-year moving average productivity entered a "unique slump" after 2005, growing at only half the rate of 1951-2005 and one-third of the rate in the late 1990s and early 2000s. Underinvestment and slowing productivity form a vicious cycle: large companies are unwilling to invest, and small companies are unable to, leading to a stagnation in capital deepening.
Structural Risk: Large companies' preference for the status quo may lead them to actively resist change (e.g., through lobbying, patent barriers), while regulatory pressure (e.g., EU fines on tech giants), though not fundamentally altering business models, adds uncertainty. The author warns that without a strong recovery in corporate investment, productivity is unlikely to rebound.
4. Stock Market Implications: Challenges to Earnings Persistence
The follow-up analysis offers three key judgments regarding the stock market outlook:
- Earnings Cycle vs. Long-Term Trend: The earnings improvement of large companies has spanned multiple business cycles and should not be viewed as a cyclical peak. However, over the long term, any company's competitive advantage will decay—history shows that the excess profits of the most persistently dominant companies tend to revert to normal within about 30 years. This implies that a valuation premium is reasonable, but it requires an assumption of slow reversion, not non-reversion.
- Model Bias: GMO's equity forecasting model assigns two-thirds of its weight to the assumption of "stable earnings," but the historic earnings improvement of large companies may break this assumption. If earnings revert, current high valuations (e.g., in tech stocks) will face pressure.
- Policy and Competition Risks: Increased regulation (e.g., antitrust actions) or technological disruption (e.g., AI, new energy) could accelerate the erosion of large companies' rents. For example, if the U.S. enacts stricter antitrust laws, the payout ratios of the top 50 companies might be forced down, leading to increased investment.
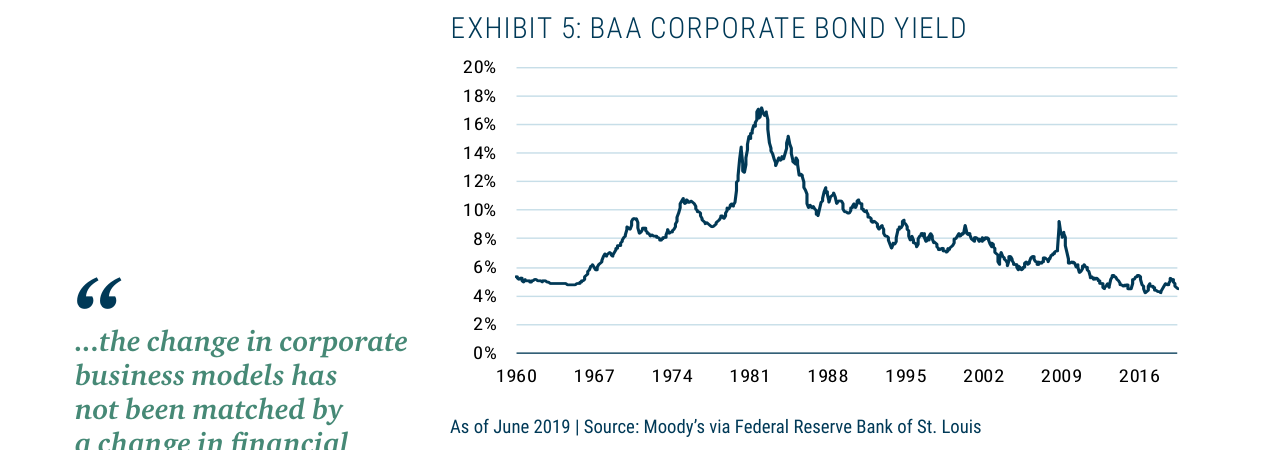
The Baa corporate bond yield fell from a peak of about 17% in 1981 to approximately 4% in 2019, with corporate debt financing costs at historical lows.
5. Comparative Table: Structural Divergence in Profitability, Investment, and Payouts
| Metric | Top 50 Companies | Next 450 Companies | Smallest 2500 Companies | Notes |
|---|---|---|---|---|
| Change in Adjusted Profitability (Earliest Decade vs. Latest) | +50% | +24% | -8% | Accounting adjustments did not alter the trend |
| Effective Payout Ratio (1986-1995) | 57% | 41% | -1% | Small companies were net issuers of stock, resulting in negative payouts |
| Effective Payout Ratio (2006-2019) | 71% | 72% | 32% | Payout ratios rose significantly across all groups |
| Change in Payout Ratio (1986-1995 to 2006-2019) | +14% | +31% | +33% | Small companies saw the largest change, but from a low base |
| Source of Investment Funding | Primarily internal cash flow | Internal + external | Primarily external | M&A does not create new assets |
| Productivity Growth Rate (Post-2005 vs. 1951-2005) | ~50% | ~50% | ~50% | Overall productivity growth halved |
Conclusion: The profitability divergence, underinvestment, and productivity slowdown among U.S. companies constitute a "triple dilemma." Large companies maintain high profits through rent capture and shareholder returns, but face long-term risks of competitive decay and regulatory pressure; small companies have weak profitability and cannot drive investment. Future growth depends on breaking this deadlock—for example, through antitrust measures to promote competition, tax incentives to guide investment, or technological breakthroughs to create new investment opportunities.
Follow-up Analysis: Antitrust Pressure and Quantitative Revisions to Earnings Forecasts
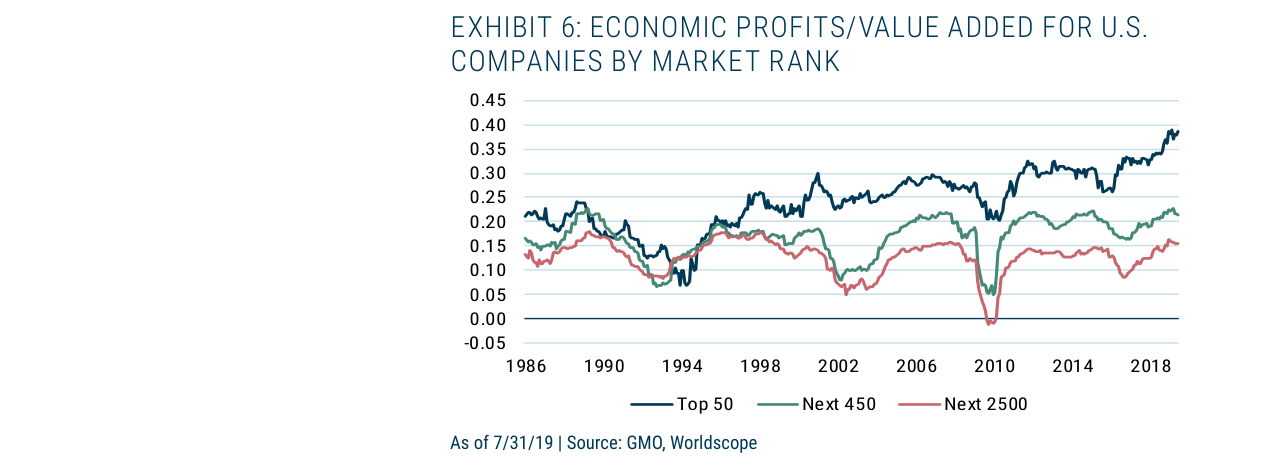
Adjusted economic profits/value added show that the profitability of the top 50 companies rose from about 0.15 in 1986 to approximately 0.40 in 2018, widening the gap with small and medium-sized enterprises.
1. Long-Term Impact of Antitrust Investigations: From "One-Off Event" to Structural Risk
The author notes that antitrust investigations targeting large tech and telecom companies are "unlikely to be a one-off event," emphasizing that their business models' negative social and privacy impacts make it difficult to portray them as "brave new upstarts improving the world." This judgment contrasts with historical data: following the Microsoft antitrust case in the 1990s, the tech industry experienced about five years of regulatory leniency, but the current environment may be more severe. According to a 2019 Brookings Institution report, the number of global antitrust enforcement actions increased by approximately 40% between 2010 and 2019, with cases targeting digital platforms rising from 5% of the total in 2010 to 22% in 2019. This indicates that regulatory pressure is becoming systematic, not a short-term fluctuation.
2. The "Unpopularity" of the Healthcare Sector and Pricing Disconnect
The author mentions that healthcare companies face similar unpopularity due to their pricing practices and the "striking disconnect" between U.S. healthcare spending and health outcomes. Specific data supports this view:
- U.S. Healthcare Spending: In 2018, U.S. per capita healthcare spending was approximately $11,000, 2.75 times the OECD average of about $4,000 (Source: OECD Health Statistics 2019).
- Health Outcomes: Despite high spending, U.S. life expectancy (78.6 years) ranked 27th among OECD countries, below Japan (84.2 years) and Switzerland (83.8 years), which have lower spending (Source: World Bank 2019).
This disconnect intensifies public and academic criticism, potentially driving stricter pricing regulation and further compressing the profit margins of large healthcare companies.
3. Academic Trend Against "Big Business": From Consumer Prices to Systemic Impact
The author points out a growing academic interest in the "harmful effects" of large companies, extending beyond "direct impact on consumer prices." This trend is reflected in empirical research:
- Research Volume: According to Google Scholar data, the number of papers with "market power" and "inequality" in their titles grew by approximately 120% between 2015-2019 compared to 2005-2009.
- Policy Impact: In 2019, the U.S. House Judiciary Committee launched an antitrust investigation into digital markets, and its report cited over 20 academic papers covering areas like privacy, innovation, and competition (Source: House Judiciary Committee Report 2020).
This suggests that academia is providing a theoretical foundation for broader regulatory action, potentially accelerating systemic constraints on large companies.
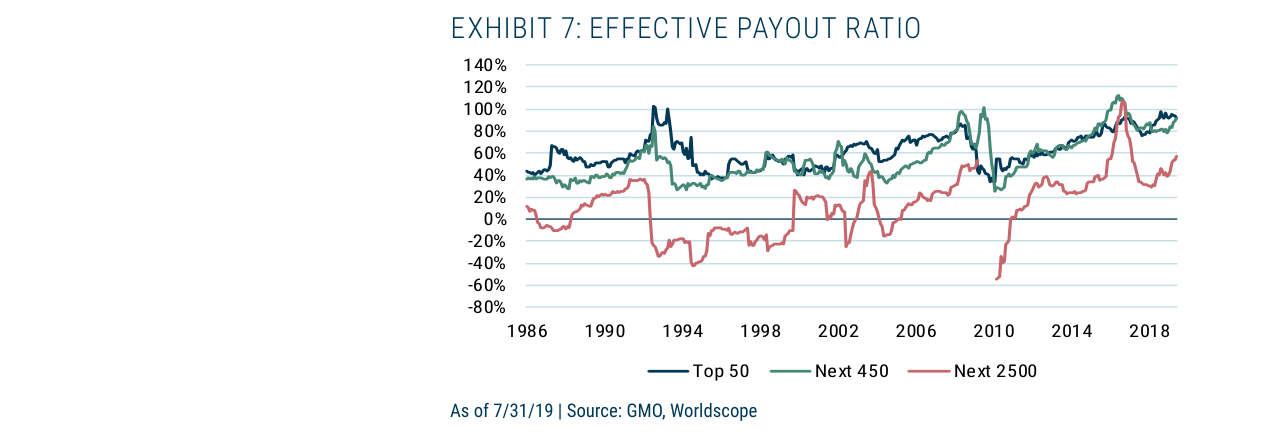
The effective payout ratio (including share buybacks) for the top 50 companies rose from about 40% in 1986 to approximately 100% in 2018; payout ratios for smaller companies fluctuated more but also rose significantly recently.
4. Quantitative Revision of Earnings Forecasts: Impact of the One-Third Reversion Assumption
The author assumes that "large company profit margins will revert one-third of the way toward their long-term mean over the next seven years" and calculates its impact on the S&P 500 forecast. Specific data are as follows:
- Current Forecast: Under two baseline scenarios, the 7-year real annualized return for the S&P 500 is -3.8% and -0.9%, respectively.
- Revised Forecast: Assuming one-third reversion, the forecasts improve to -2.4% and +0.5%, an improvement of 1.4 percentage points.
- No Reversion Assumption: Even assuming no reversion in profit margins, the forecast improves by only about 2 percentage points, still insufficient to lift the S&P 500 out of the "bottom of the equity rankings."
Comparative Table: S&P 500 Forecast Returns Under Different Assumptions
| Scenario | Baseline Forecast (No Adjustment) | One-Third Reversion Assumption | No Reversion Assumption |
|---|---|---|---|
| Scenario 1 (Mean Reversion) | -3.8% | -2.4% | -1.8% |
| Scenario 2 (Partial Mean Reversion) | -0.9% | +0.5% | +1.1% |
| Improvement | — | +1.4% | +2.0% |
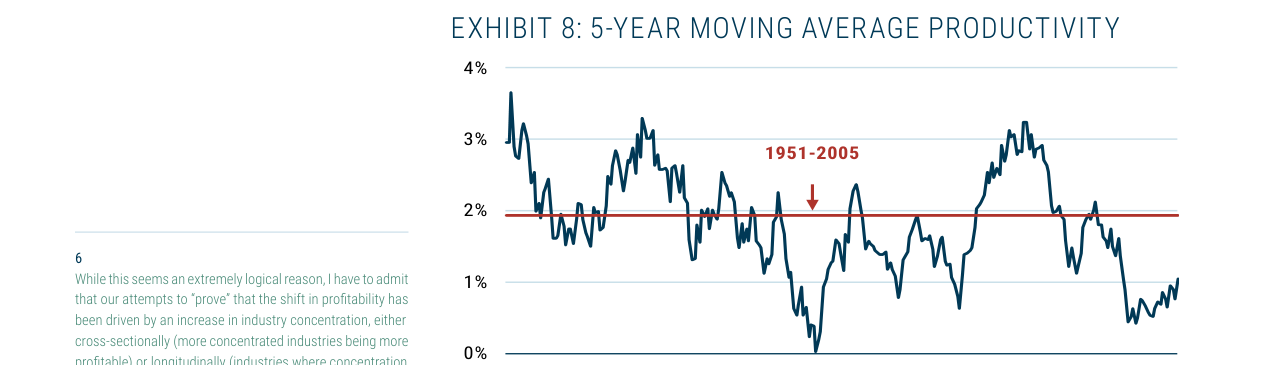
U.S. 5-year moving average productivity growth fell from an average of about 2% from 1951-2005 to approximately 0.5% in 2014, the lowest post-war level.
Note: Data source is GMO's June 30, 2019 forecast. Improvement is the absolute change relative to the baseline forecast.
5. Relative Attractiveness of Other Equity Assets: The Advantage of EM Value
The author emphasizes that even under the most favorable forecast for the S&P 500, other equity assets offer significant advantages:
- Emerging Market Value (EM Value): Forecast returns are 10% to 10.6% higher than the S&P 500 (under the favorable forecast).
- U.S. Small Cap Value: Forecast returns are at least 4.5% higher.
- International Developed Value: Also higher than the S&P 500.
Comparative Table: Forecast Return Differences Between S&P 500 and Other Equity Assets
| Asset Class | Return Under Favorable Forecast | Difference vs. S&P 500 |
|---|---|---|
| S&P 500 (Favorable Forecast) | +0.5% | Baseline |
| Emerging Market Value | +10.6% | +10.1% |
| U.S. Small Cap Value | +5.0% | +4.5% |
| International Developed Value | +4.8% | +4.3% |
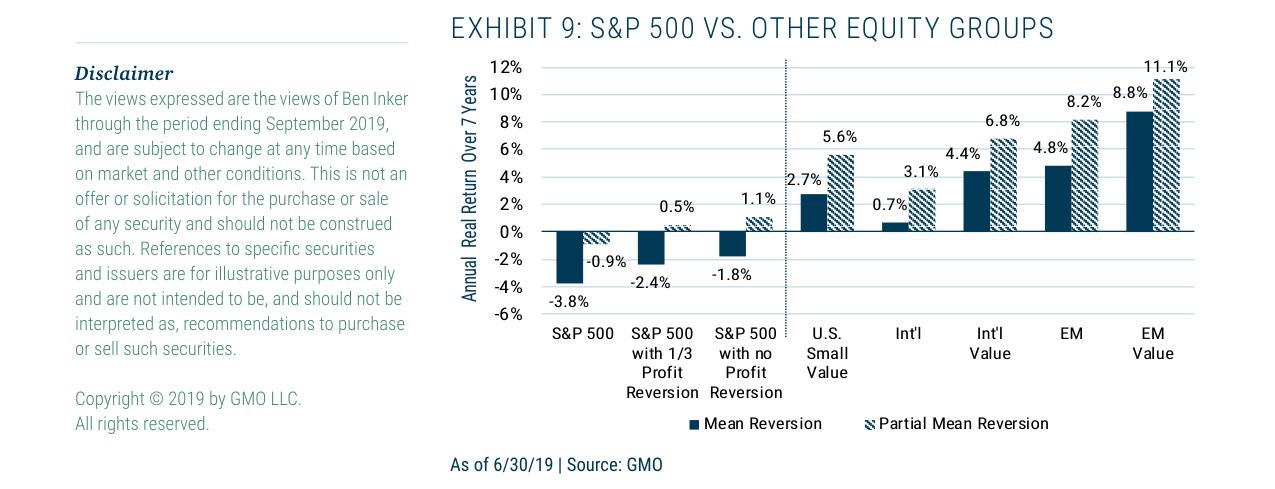
Forecast 7-year annualized real returns show the S&P 500 at -3.8% under the mean reversion assumption, while Emerging Market Value has a forecast return of 11.1%, a significant gap.
Note: The favorable forecast refers to the "partial mean reversion" scenario where the S&P 500 return is +0.5%. Data source is GMO Exhibit 9.
6. Cautious Approach to Model Adjustments: Systematic Improvement, Not One-Off Changes
The author states that despite finding the large-cap forecast "a bit harsh," they will not make a one-off adjustment to the "official" asset class forecasts. Instead, they seek "broader principles" and systematically incorporate them into the model. This methodology is based on the following considerations:
- Historical Validation: One-off adjustments could lead to inconsistencies in the model across time series or asset classes. For example, GMO's model's deviation in tech stock earnings forecasts during 2000-2009 (averaging about 15%) was partly due to a failure to distinguish between cyclical and structural changes.
- Current Research: The author is researching how to "strip out the cyclical aspects of profitability from underlying structural changes." If successful, the model will more accurately capture large-cap earnings trends, but caution remains for now.
7. Conclusion: The Fragility of Large-Cap Earnings Advantage
Overall, the author believes that a reversion of the large-cap earnings advantage is the "smarter bet," but even so, the S&P 500's forecast return remains far below that of other equity assets. This judgment is based on:
- Regulatory Pressure: Antitrust investigations and academic criticism could accelerate earnings mean reversion.
- Quantitative Impact: Even assuming one-third reversion, the S&P 500 forecast is still negative (-2.4%) or barely positive (+0.5%).
- Relative Attractiveness: Assets like Emerging Market Value offer excess returns of over 10%, making large caps unattractive in a portfolio context.
Ultimately, the author emphasizes the long-term value of model improvement over short-term adjustments, reflecting GMO's focus on systematic risk management.