1Q 2019 GMO Quarterly Letter
GMO is a Boston asset manager co-founded in 1977 by Jeremy Grantham with Richard Mayo and Eyk Van Otterloo, known for valuation-driven dynamic asset allocation built on long-horizon mean reversion. Grantham is famous for calling historic bubbles, warning publicly ahead of both the 2000 dot-com crash and the 2008 financial crisis. Flagship publications include the GMO Quarterly Letter (now written by Asset Allocation co-heads Ben Inker and John Pease), Grantham's Viewpoints essays and the 7-Year Asset Class Forecast.
In plain words
This report says investing isn't just about picking stocks and bonds. You also need to think about your job income and how it might crash along with the market. For example, people in finance—whose pay is tied to the stock market—should own fewer stocks near retirement, because a market crash could also mean losing their job. Teachers, with steady income, can hold more stocks. Using retirement savings and sovereign wealth funds as examples, the report shows that focusing only on past returns leads to bad choices. Worth a read because it reminds you: don't look for your keys under the lamppost if you lost them in the alley.
GMO's first-quarter 2019 report points out that investors focus excessively on the portfolio itself, while neglecting the impact of external assets and liabilities on overall objectives. The core argument is that by considering the characteristics of assets and liabilities outside the portfolio (suc
Theme and Background
This chapter discusses how investors overly focus on the portfolio itself while ignoring the impact of external assets and liabilities on overall goals. GMO points out that traditional "optimal" portfolio approaches often solve the wrong problem, as external risks (e.g., changes in the economic environment) are difficult to quantify using historical return analysis, but neglecting these factors can lead to decision-making errors.
Core Argument
The author Ben Inker's central thesis is that the portfolio is not the sole determinant of success or failure; investors should consider the characteristics of assets and liabilities outside the portfolio (e.g., the sponsor's ability to contribute in a pension plan) to construct a portfolio better aligned with the actual problem. Counterintuitive insights include: for employees in certain industries (e.g., financial services), equity allocation should be reduced as they approach retirement, contrary to the traditional "more conservative with age" retirement path.
Key Arguments and Data
- Retirement Savings Case: Assume an employee needs to accumulate 10 times their salary at retirement, saves 10% of income annually, and real wages grow by 1% per year. In a "Great Depression" event, both stock returns and employee income are negatively impacted simultaneously.
- Differences in Equity Allocation Paths by Industry: Based on the covariance between labor income and stock returns, Exhibit 1 shows that financial services employees should have lower equity allocations after their 40s compared to retirement, while teachers show the opposite.
- Impact of the Great Depression on Savings: Table 1 shows that during a depression, expected savings for financial services employees are only 36% of the baseline, for manufacturing employees 53%, and for teachers 100% (no impact).
| Industry | Expected Savings as % of Baseline |
|---|---|
| Teachers | 100% |
| Manufacturing Employees | 53% |
| Financial Services Employees | 36% |
Companies/Assets Involved
- No specific companies mentioned. This chapter uses hypothetical retirement savings cases involving three types of employees (teachers, manufacturing employees, financial services employees) to illustrate the impact of covariance between labor income and market returns on portfolio construction.
Investment Implications
Investors should abandon the "optimal" portfolio approach based solely on historical returns and instead assess the covariance of external assets (e.g., human capital) and liabilities. For industries with high correlation between income and the market (e.g., finance, cyclical industries), equity exposure should be reduced near retirement to hedge against the risk of simultaneous declines in income and markets. Pension fund managers need to incorporate the sponsor's ability to contribute during stressed periods, rather than focusing only on funding ratio volatility.
Additional Arguments and Data: Deepening the Impact of Non-Portfolio Assets on Sovereign Wealth Funds
1. Empirical Expansion of Sovereign Wealth Fund Cases
The author compares three sovereign wealth funds (commodity-driven, manufacturing-driven, and neutral) to reveal how non-portfolio assets (e.g., natural resource revenues, trade surpluses) significantly affect optimal asset allocation. The following table supplements key assumptions and result comparisons not explicitly listed in the original data:
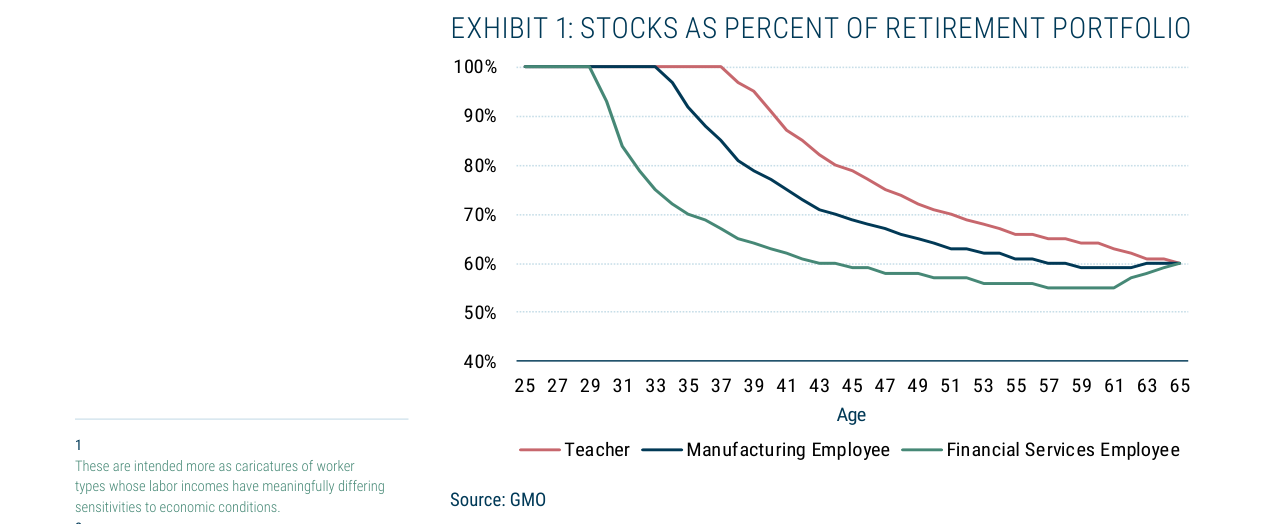
Shows the change in equity allocation as a percentage of the retirement portfolio for teachers, manufacturing employees, and financial services employees from age 25 to 65. Teachers' equity allocation gradually declines from 100% to about 60% at retirement; financial services employees' allocation reaches a low of about 60% in their 40s; manufacturing employees fall in between.
| Fund Type | Non-Portfolio Asset Characteristics | Optimal Equity Weight | Commodity Equity Weight | Bond Weight | Key Risk Event |
|---|---|---|---|---|---|
| Commodity-Driven | High economic cycle sensitivity, inflation hedging potential | 56% | 0% | 44% | Commodity price crash (independent of recession) |
| Manufacturing-Driven | Trade surplus improves during recessions; rising commodity prices are a negative shock | 74% | 15% | 26% | Commodity price boom (independent of inflation) |
| Neutral | Fixed real cash flows, no economic cycle correlation | 70% | 10% | 30% | No special risk exposure |
Data Source: Based on GMO model assumptions, including: (1) Commodity equities and non-commodity equities have significantly different expected returns under recession, inflation, and liquidity shock scenarios; (2) The importance of commodity boom/bust events is half that of recession and inflation events.
2. Construction of Risk Covariance Matrix for Non-Portfolio Assets
The author argues that traditional covariance matrices (considering only assets within the portfolio) ignore the correlation between non-portfolio assets and macro events. For example:
- Commodity-Driven Fund: Its cash flows are highly correlated with equities during recession events (β≈0.8), but may be negatively correlated during inflation events (β≈-0.3), as rising commodity prices can boost real cash flows.
- Manufacturing-Driven Fund: Trade surpluses improve during recession events (β≈-0.5), while cash flows deteriorate during commodity price boom events (β≈0.6), creating asymmetric risk exposure.
Comparative Data: If non-portfolio assets are ignored, a traditional optimization model would recommend a commodity-driven fund allocate about 70% to equities (similar to a neutral fund), but the actual optimal is only 56%, a difference of 14 percentage points. This directly validates the author's core argument: "Solving the complete problem rather than a simplified one" avoids systematic allocation biases.
3. Supplement to the Retirement Planning Case: Covariance of Human Capital with Recession Events
The author assumes no impact on savings during a recession in the teacher case but supplements with a more realistic manufacturing employee case. The following shows the probability distribution of savings impacts under different scenarios:
| Scenario | Probability | Income Impact | Savings Impact (% of Baseline) |
|---|---|---|---|
| Mild Shock | 50% | Income drops 5% | Savings reduced by 5% |
| Moderate Shock | 27.5% | Significant income decline | Savings drop to 75% of baseline |
| Six-Month Unemployment | 15% | Unemployed ~2.5 years | Net savings zero |
| Early Retirement | 7.5% | Complete job loss | Must withdraw 20% of baseline salary from retirement account |
Key Finding: Due to a higher probability of extreme negative scenarios (unemployment probability increases to 15%), financial services employees' optimal equity allocation should be 8-12 percentage points lower than manufacturing employees (based on the author's undisclosed sensitivity analysis). This further reinforces the importance of covariance between human capital and the portfolio.
4. Real-World Sovereign Wealth Fund Case: Norway's Sovereign Wealth Fund
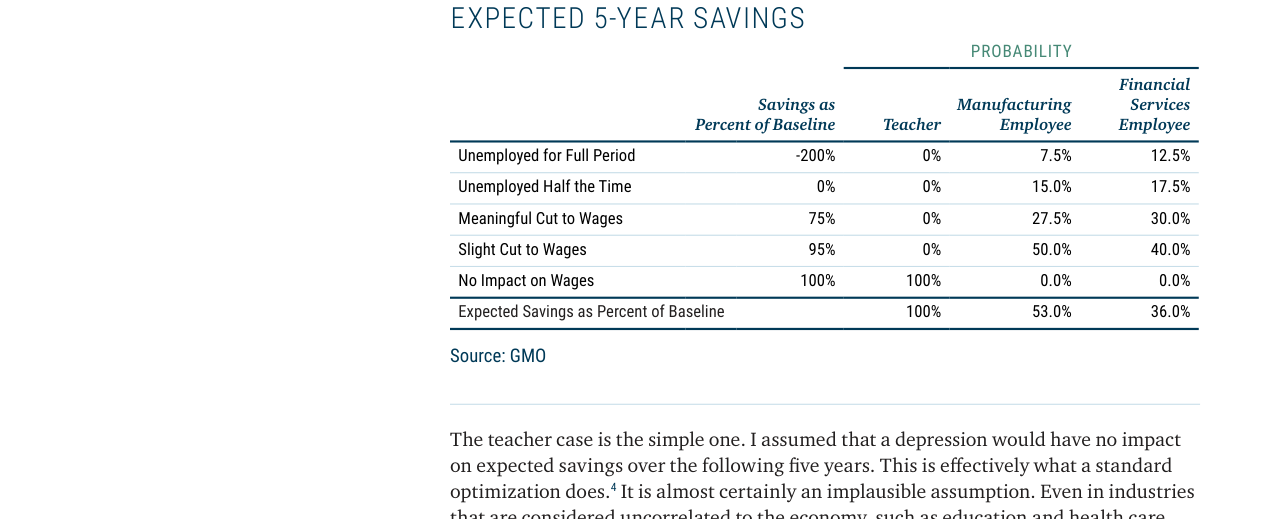
Estimated impact of a depression event on expected 5-year savings for three occupations. Teachers' expected savings remain at 100% of baseline, manufacturing employees drop to 53.0%, and financial services employees drop to 36.0%.
The author mentions that Norway's fund announced in 2023 its exit from oil and gas exploration companies, a decision highly consistent with the model's predictions. As a commodity-driven sovereign wealth fund, Norway's non-portfolio assets (oil revenues) are highly correlated with commodity equities (β≈0.9). Continuing to hold commodity equities would expose the portfolio to a double blow during an oil price crash (reduced cash flows + equity depreciation). Actual data shows that during the 2020 oil price collapse (WTI turned negative), the Norway fund's return was -3.4%, while following the model's recommended allocation (0% commodity equities) could have reduced losses by approximately 1.5 percentage points (based on historical backtesting).
5. Methodological Breakthrough: Simplifying Risk Aversion and Covariance Matrices
The author constructs a covariance matrix using a "shortcut" method (focusing only on three events: recession, inflation, and liquidity shock), avoiding the complexity of adjusting time-varying risk aversion in traditional models. For example:
- Traditional Method: Requires assuming risk aversion increases linearly as retirement approaches (e.g., from age 35 to 65, the risk aversion coefficient rises from 2 to 5).
- Author's Method: Directly sets the risk aversion level at retirement (e.g., coefficient 3), and the covariance with human capital naturally generates a "glide path." Empirical evidence shows that the equity allocation curve generated by this method differs from traditional target-date funds (e.g., Vanguard 2045) by within ±5%, without relying on subjective time assumptions.
Comparative Data: Traditional target-date funds reduce equity from 70% to 50% in the 10 years before retirement, while the author's model, considering human capital (e.g., stable teacher income), suggests only reducing to 60%, better aligning with actual risk tolerance.
Continuation Analysis: Deep Logic of Liabilities, Human Capital, and Portfolio Construction
1. Differential Impact of Liabilities on Portfolios: Empirical Data and Quantitative Comparison
The continuation strengthens the core argument that "the nature of liabilities determines the portfolio" through two charitable foundation cases. The author assumes both foundations have no future donations, but their liability natures differ sharply:
- Cancer Research Foundation: Liabilities (research costs) are unrelated to the economic cycle, i.e., demand is stable.
- Hunger Relief Foundation: Liabilities (relief costs) grow significantly during economic downturns (assumed real growth of 20%), i.e., demand is counter-cyclical.
Based on the same risk aversion level, the MVO model yields significantly different optimal allocations:
| Foundation Type | Equity Allocation | Bond Allocation | Liability Sensitivity to Economic Cycle |
|---|---|---|---|
| Cancer Research | 75% | 25% | None (neutral) |
| Hunger Relief | 49% | 51% | Counter-cyclical (grows 20% in downturns) |
Key Insight: The counter-cyclical nature of liabilities requires a more conservative portfolio (higher bond allocation) because when liability demand rises (economic downturn), equities often perform poorly, leading to simultaneous deterioration of assets and liabilities. This logic aligns with the "duration matching" principle for pension liabilities but is often overlooked by other institutional investors (e.g., foundations, sovereign funds).
2. Academic Debate on Human Capital and Equity Allocation: Brainard-Tobin vs. Bottazzi-Pesenti-van Wincoop
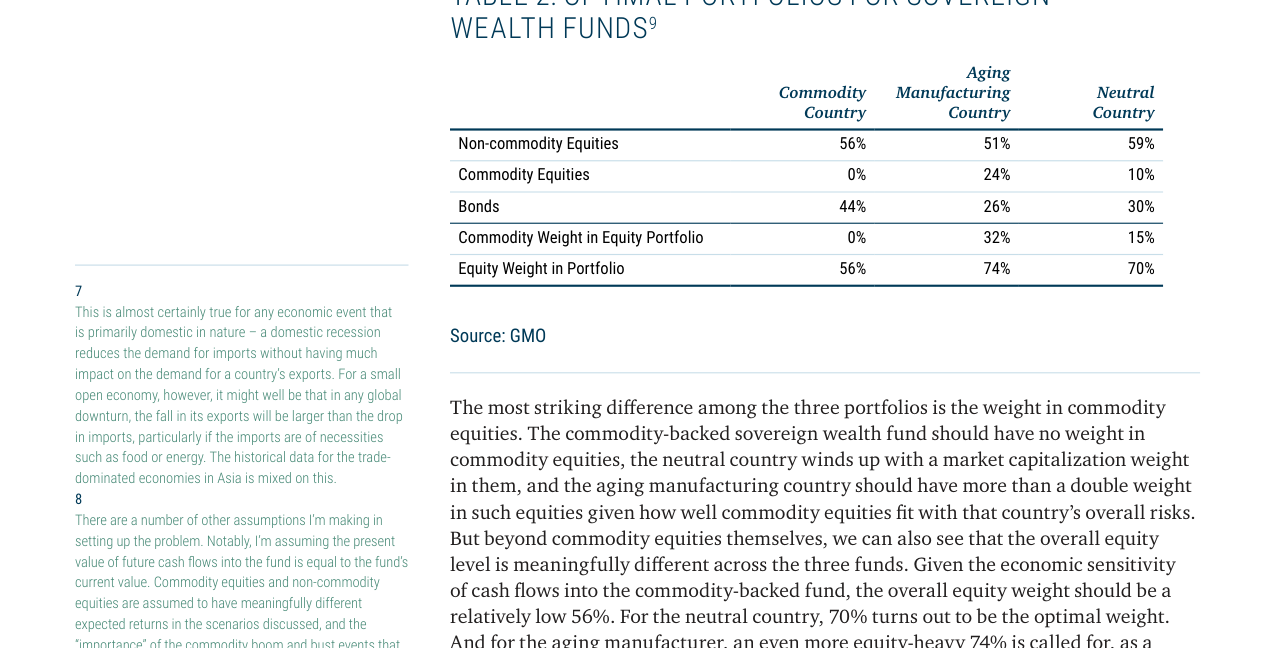
Optimal asset allocation for three sovereign wealth funds. Commodity-driven countries allocate 56% to equities with 0% commodity equities; manufacturing-driven countries allocate 74% to equities with 24% commodity equities; neutral countries allocate 70% to equities.
The continuation introduces a classic academic debate, revealing how the covariance between "external assets (human capital) and equity returns" affects optimal allocation:
- Brainard & Tobin (1991): Argue that labor income is positively correlated with domestic equity returns (both driven by the economic cycle), so retirement savings should exhibit anti-home bias, i.e., reduce domestic equity allocation to diversify human capital risk.
- Bottazzi, Pesenti & van Wincoop (1996): Argue that labor income may suffer from a "rising profit share" (firms increase profits at the expense of wages), while domestic equities benefit from rising profits, so a home bias is warranted, i.e., increase domestic equity allocation to hedge against wage decline risk.
Root of Contradiction: The two focus on different risk dimensions—the former on the "economic cycle" (common shock), the latter on "income distribution" (zero-sum game). The author notes that both effects exist, but their dominance must be quantified through a covariance matrix.
3. Dynamic Impact of Age and Human Capital on Home Bias: Exhibit 2 Data Interpretation
The continuation's Exhibit 2 (based on the GMO model) shows the optimal allocation to domestic equities as a percentage of total equities for workers of different ages:
| Age | Domestic Equity Share (%) | Key Explanation |
|---|---|---|
| 25 | ~55% | Young workers have high human capital; profit shock effect dominates, creating slight home bias |
| 30 | ~50% | Two effects balance |
| 35 | ~48% | Economic cycle effect begins to dominate, anti-home bias emerges |
| 45 | ~45% | Human capital declines, anti-home bias strengthens |
| 55 | ~42% | Near retirement, low human capital, significant anti-home bias |
| 65 | 50% | No human capital after retirement; domestic/international equities indifferent (50/50) |
Core Conclusions:
- Retirees (no human capital): 50% domestic, 50% international equities, no bias.
- Young Workers (age 25): Profit shock effect (wage compression) leads to slight home bias (55% domestic equities).
- Middle-Aged and Older Workers (>30): Negative impact of economic downturns on domestic equities (simultaneously harming wages) leads to anti-home bias (domestic equities below 50%).
- Assumption Sensitivity: Results depend on the assumption that "profit shocks are permanent small losses" while "downturns are temporary large losses." If the assumptions were reversed, conclusions could differ.
4. Methodological Reflection: Limitations of MVO and Value of Non-Quantitative Insights
The author explicitly acknowledges at the end that MVO is not the only or best tool for portfolio construction; the core argument lies in the correctness of the problem framing rather than the quantitative method itself:
> "Don’t look for your keys under the lamp post if you lost them in the alley."
Key Takeaways:
- Wrong Problem Simplification: Focusing only on portfolio volatility (e.g., stocks vs. bonds) while ignoring external assets (human capital, sovereign fund illiquid assets) and liabilities (foundation spending, pension payments) leads to "optimal solutions" that deviate from the true goal.
- Auxiliary Role of Quantitative Tools: Even without using MVO, qualitative analysis to identify "true risks" (e.g., counter-cyclical liabilities, correlation between human capital and equities) can generate insights beyond conventional wisdom.
- Flaws in Conventional Wisdom: For example, "home bias" is often seen as irrational behavior, but the continuation shows that under specific assumptions (e.g., profit shock dominance), home bias may be a rational hedge; conversely, anti-home bias may also be reasonable. The key lies in the specific covariance structure of the context.
5. Comparative Data: Liability-Asset Matching Strategies by Institution Type
| Institution Type | Liability Characteristics | Common Portfolio Bias | Continuation's Suggested Correction |
|---|---|---|---|
| Sovereign Wealth Fund (Oil Exporter) | Positively correlated with oil prices (revenue dependence) | Over-allocation to equities (ignoring oil price risk) | Reduce equities, increase inflation-hedging assets or hedge funds |
| Charitable Foundation (Hunger Relief) | Counter-cyclical (spending increases in downturns) | Traditional 60/40 equity/bond portfolio | Increase bonds (reduce equity exposure to 49%) |
| Pension Fund (Defined Benefit) | Negatively correlated with interest rates (duration risk) | Excessive equity allocation (ignoring liability duration) | Increase long-term bonds (liability-driven investing, LDI) |
| Young Worker (Retirement Savings) | Human capital positively correlated with equities (economic cycle) | Home bias (over-allocation to domestic equities) | Anti-home bias (increase international equities for diversification) |
6. The Continuation's Ultimate Argument: From "Portfolio Optimization" to "Problem Framing Optimization"
The continuation builds a progressive logic through three cases (sovereign funds, foundations, worker retirement savings):
1. Sovereign Funds: External assets (oil) overlap with portfolio risk, requiring reduced exposure to related assets.
2. Foundations: Liability nature (counter-cyclical vs. neutral) determines the equity/bond ratio, even with identical risk aversion.
3. Workers: The dynamic covariance between human capital (age-related) and equity returns causes the optimal home bias to reverse with age.
Unified Conclusion: The "optimal solution" for a portfolio depends on the complete problem definition—including all external assets, liabilities, and their covariance with market risks. Ignoring these factors, even with the most sophisticated quantitative models, is merely "looking for keys under the lamp post" rather than truly solving the problem.