Part 1: What Barbarians Like to Take Private
GMO is a Boston asset manager co-founded in 1977 by Jeremy Grantham with Richard Mayo and Eyk Van Otterloo, known for valuation-driven dynamic asset allocation built on long-horizon mean reversion. Grantham is famous for calling historic bubbles, warning publicly ahead of both the 2000 dot-com crash and the 2008 financial crisis. Flagship publications include the GMO Quarterly Letter (now written by Asset Allocation co-heads Ben Inker and John Pease), Grantham's Viewpoints essays and the 7-Year Asset Class Forecast.
In plain words
Private equity (PE) buys entire companies with borrowed money. Many think it's a safe way to spread risk, but this report shows PE companies are often low-quality, heavily indebted, and concentrated in software (40% of deals). If the economy slows, they're more likely to collapse than similar small stocks. For ordinary investors, owning PE funds means you have a fragile basket. This matters because it reveals the hidden dangers behind PE's promised safety.
GMO's Q2 2026 report examines the risks within private equity portfolios, with the core argument that private equity firms are increasingly concentrated in a narrow set of risks, making them more vulnerable to economic shocks. The report analyzes approximately 700 companies that exited through lever
Theme & Background
This chapter aims to reveal the hidden concentration risk within private equity portfolios. The report notes that while the market broadly focuses on the liquidity issues of private equity, the true downside risk is insolvency. As private equity portfolios become increasingly concentrated in a few risks, investors are more vulnerable than ever to specific economic shocks.
Core Argument
The author's central thesis is: Private equity is not an effective diversification tool. Although private equity firms often promote their diversification advantages by claiming to "invest in small caps with broader opportunities," the report demonstrates through data that the actual risk concentration in private equity portfolios is extremely high. The quality of their underlying assets is far lower than that of public market small caps, making them more vulnerable to economic downturns.
Key Arguments & Data
1. Concentration Risk in Private Equity Portfolios:
- The author uses a simplified model to illustrate: Even if the contribution of "management risk" (idiosyncratic risk) within a single company is twice that of "business cycle risk" (systematic risk), when a portfolio holds 100 equally weighted stocks, idiosyncratic risk nearly disappears (becoming a "rounding error"). Expanding from 100 to 10,000 stocks yields negligible diversification benefits.
- In the real world, because private equity firms share characteristics like high leverage, low profitability, and similar industries, the correlation of their returns is far higher than the model assumption of being "only affected by the business cycle."
2. Extremely Low Quality of Underlying Assets:
- The report uses GMO's "Quality Score" (composite of profitability, earnings stability, and leverage, scored 0-10) for comparison:
- The quality score of Public-to-Private LBOs is a full decile lower than that of U.S. Small Caps.
- The quality score of U.S. Small Caps is nearly four deciles lower than that of the S&P 500.
- Low-quality companies perform worse under economic shocks. Using December 2007 (Global Financial Crisis) and 2020 (COVID-19 pandemic) as examples, the subsequent five-year positive return rates for low-quality companies were significantly lower than for high-quality companies.
3. Historical Data Sample:
- Collected approximately 700 public companies that exited via leveraged buyouts (LBOs) between 1981 and 2025 (e.g., RJR Nabisco, Hospital Corporation of America, TXU). These transactions represent about 80% of private equity capital deployed.
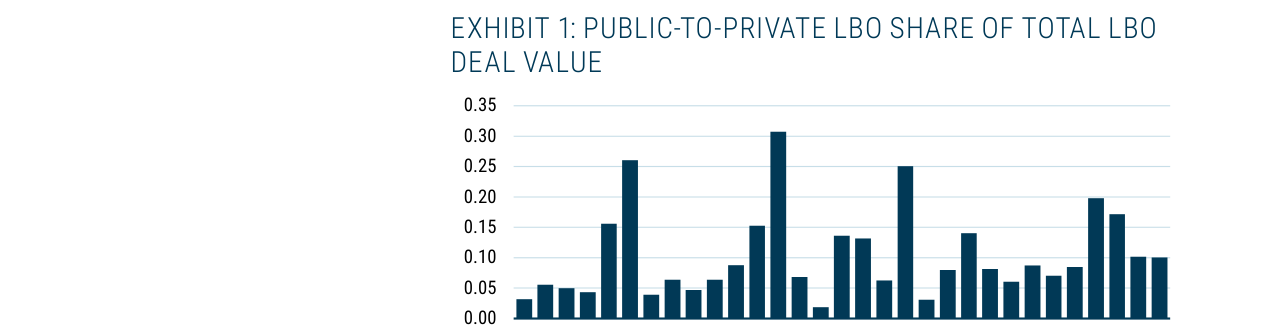
- The sample covers 10%-30% of global LBO transaction value but is biased towards larger deals (public-to-private transactions are typically larger).
4. Size Characteristics:
- Private equity has long focused on small caps: Only about 5% of LBO companies rank in the top 500 by market capitalization, less than 15% rank in the top 1,000, and 85% are small caps or micro-caps.
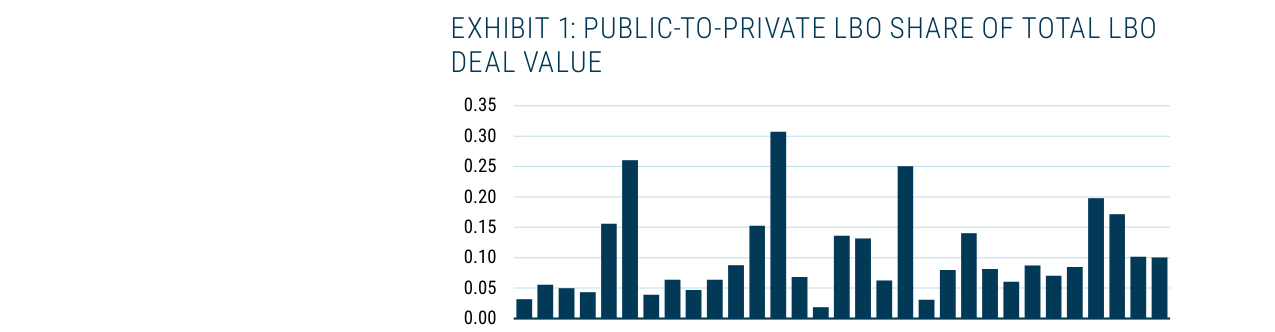
Bar chart showing the fluctuating share of public-to-private LBOs in total LBO deal value from 1995-2025, peaking around 0.30 (30%) in 2000 and 2007, and accounting for about 0.10 (10%) in 2025.
Comparative Data Table:
| Asset Class | GMO Quality Score (Decile) | Gap Relative to S&P 500 |
|---|---|---|
| S&P 500 | Highest | Benchmark |
| U.S. Small Caps | ~4 deciles lower | -4 |
| Public-to-Private LBOs | 1 decile lower | -5 |
Companies/Assets Involved
- RJR Nabisco: One of the largest LBO cases in history, acquired at an expensive valuation.
- Toys"R"Us: Already heavily indebted before its 2005 leveraged buyout.
- Hilton: Acquired with extremely thin net profit margins (even compared to low-margin peers).
- Hospital Corporation of America: Acquired twice.
- TXU: A large energy company LBO case.
Investment Implications
- Beware of Private Equity's "Pseudo-Diversification": Investors should not be misled by the narrative that "private equity invests in small caps with broader opportunities." Due to the extremely low quality of underlying assets and highly concentrated risks, private equity portfolios may suffer greater losses than public market small caps during economic downturns.
- Focus on Insolvency Risk, Not Liquidity Risk: Current market concerns about private equity liquidity may mask the real risk—the possibility of portfolio companies going bankrupt due to economic shocks.
- Active Management of Risk Concentration is Necessary: For investors with significant private equity allocations, the report implies that measures (discussed in later chapters) are needed to mitigate the vulnerability arising from low portfolio quality and risk concentration.
Additional Arguments & Data Analysis
1. Quantitative Impact of Structural Changes in the Private Equity Industry
Three bar charts comparing leverage (Toys"R"Us leverage is 1.0x that of peers), net profit margin difference (Hilton is 6 percentage points lower), and valuation (RJR Nabisco's valuation is 20% higher than GMO's fair value) for RJR Nabisco, Toys"R"Us, and Hilton.
Software Industry Concentration Risk: Exhibit 8 shows that over the past 10 years, the software industry accounted for 40% of public-to-private LBO transactions, the highest historical industry concentration. This proportion far exceeds comparable public market indices:
- Russell 2000: Software & Services accounts for only 5%
- MSCI US Small Cap Index: Similarly below 5%
- S&P 500: Software accounts for only 10%
- MSCI ACWI ex USA Index: Software accounts for only 5%
Historical Comparison: Between 1984-2014, LBO industry distribution was relatively diversified, with traditional sectors like capital goods, medical equipment, and consumer services each accounting for 10-20%. However, after 2019, the software share surged from 15% to 40%, forming a "single-industry bet."
2. Risk Mismatch Between Private Equity and Public Markets
Size and Quality Deviation: Assuming an institutional investor allocates 50% of its US equity to private equity and 50% to a passive public market index, the overall portfolio would exhibit:
- Small-cap overweight: 57% weight allocated to companies outside the S&P 500 (including PE-held companies)
- High-quality stock underweight: S&P 500 weight is only 43%, compared to a market benchmark of 82%
- Low-quality stock overweight: The average quality decile (GMO Quality Decile) of PE-held companies is concentrated in the 4-6 decile range (low-quality zone)
Comparative Data:
| Metric | Institutional Portfolio (50% PE + 50% Public Index) | Market Benchmark (Full Market Cap Weighted) |
|---|---|---|
| S&P 500 Weight | 43% | 82% |
| Small-cap Weight | 57% | 6% |
| High-Quality Stocks (GMO Top 3 Deciles) | ~15% | ~35% |
| Low-Quality Stocks (GMO Bottom 3 Deciles) | ~40% | ~20% |
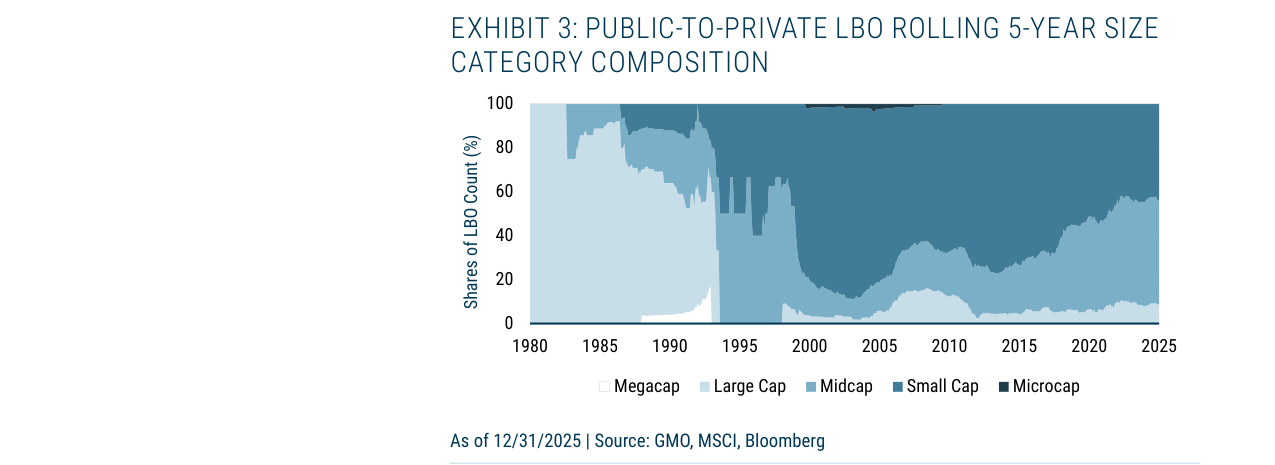
Stacked area chart showing the changing market cap composition of LBO transactions from 1980-2025. Small caps and micro-caps have long dominated (totaling 60-80%), with large caps briefly reaching 40% around 2000.
3. Dual Deterioration of Private Equity Leverage and Profitability
Exhibit 7 Data Interpretation: Compared to similarly sized public companies, recent LBO transactions show:
- Leverage (Net Debt/Assets) is 1.2 standard deviations higher
- Net profit margin is 0.6 standard deviations lower
- Valuation (Price/Fair Value) is 1.0 log ratio higher
Risk Transmission Mechanism: These highly leveraged, low-profitability companies rely on low interest rates and a strong economy to service their debt. If an economic slowdown occurs, real interest rates rise (due to sticky inflation), or credit spreads widen (due to private credit deterioration), it will lead to:
- Insufficient cash flow to cover debt
- Simultaneous impairment of profitability (high correlation)
- Concentrated default risk
4. Empirical Evidence of the AI Shock in the Software Industry
Exhibit 9 Data: As of May 8, 2026, the S&P 1500 Software Index had a year-to-date cumulative return of -25%, compared to -5% for the S&P 500 and -8% for the S&P 1500. The software sector underperformed the broad market by 20 percentage points.
Historical Analogy: After the 2021 bubble peak, private equity's relative performance against public markets has continuously deteriorated. Cambridge Associates data shows that as of September 2025, the ten-year return of US private equity was roughly flat with the Russell 3000 Index. However, considering that the small-cap, low-quality stocks it selects have historically underperformed the Russell 3000 by several percentage points of alpha, the actual relative performance is even worse.
5. Risk Superposition Effect
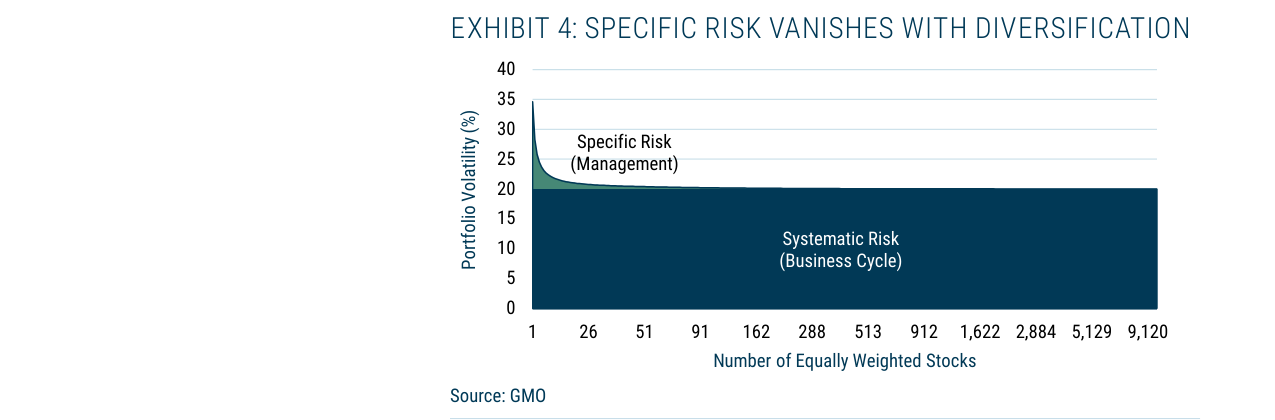
Area chart showing portfolio volatility decreasing as the number of holdings increases. Idiosyncratic risk (management risk) drops from 35% to near zero after about 50 stocks, leaving only 20% systematic risk (business cycle risk).
Cross-Asset Class Concentration: Investors hold significant software exposure across private equity, venture capital, and private credit:
- Private Equity: 40% software
- Venture Capital: Software share is even higher (typically 60-80%)
- Private Credit: Software company loans account for approximately 30%
Portfolio Risk Amplification: This triple superposition means that an endowment-style portfolio's actual exposure to the software industry could be as high as 50-60%, far exceeding the surface-level numbers.
6. Quantitative Recommendations for Hedging Strategies
Active Hedging Proposal: It is recommended to allocate the public equity portion as follows:
- Overweight large-cap, high-quality stocks (top 50 S&P 500 constituents)
- Underweight small-cap and low-quality stocks
- Increase exposure to AI-benefiting sectors (e.g., hardware, infrastructure)
Expected Effect: If the public equity portion can generate 2-3% active alpha, it could offset the 10-15% downside risk arising from software concentration in the PE portfolio.
Additional Arguments & Data: Superiority of Quality Factor Hedging
1. Structural Differences Between Low-Quality Stocks and Small-Cap Indices
Low-quality stocks and small caps exhibit significant structural differences, particularly in software industry weight. According to GMO data, the weight of software in the low-quality stock group is more than double that in small-cap indices. This difference is crucial for hedging AI disruption risk:
- Small-Cap Indices (e.g., Russell 2000): Software industry weight is typically low (around 5-8%), with greater concentration in traditional sectors like industrials, financials, and healthcare.
- Low-Quality Stock Group: Software industry weight can reach 15-20%, as many high-valuation, low-profitability tech companies (e.g., some SaaS firms) are classified as low quality.
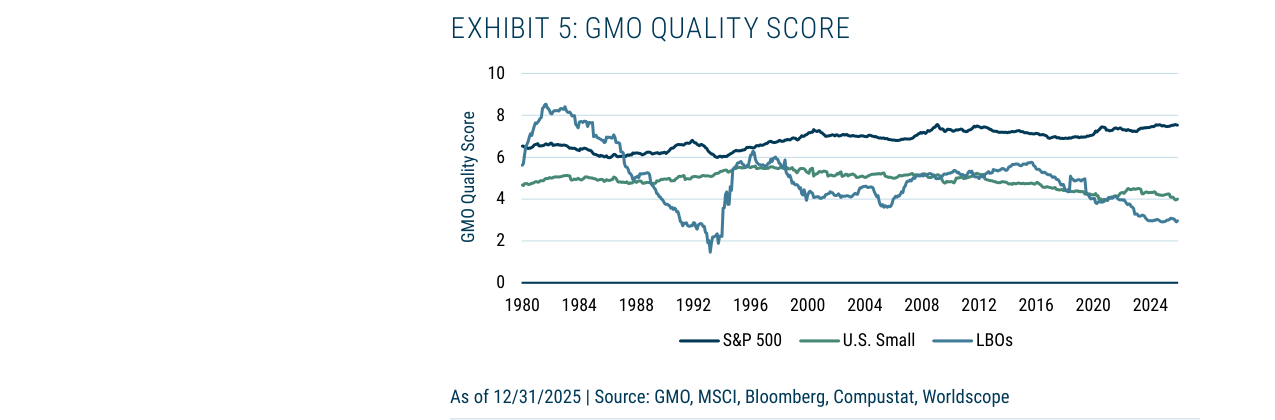
Line chart comparing GMO quality scores for S&P 500 (~8 points), U.S. Small (~5 points), and LBOs (~4-6 points) from 1980-2024, showing that LBO target quality has long been lower than small caps and large caps.
This means shorting low-quality stocks can more directly offset the AI disruption risk from software concentration in private equity portfolios, while shorting small-cap indices has a limited effect.
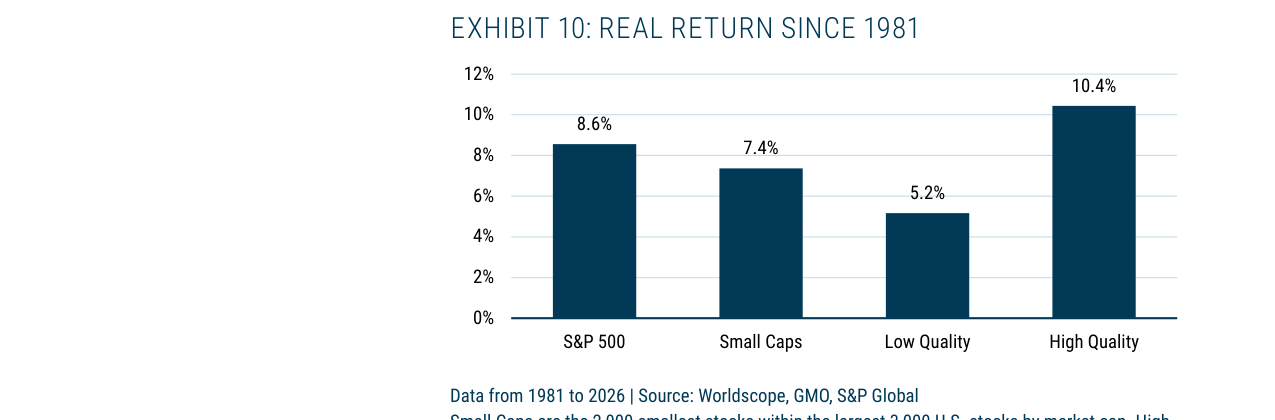
2. Long-Term Return Performance Comparison (1981-2026)
| Asset Class | Annualized Real Return | Volatility (Std Dev) | Sharpe Ratio |
|---|---|---|---|
| S&P 500 | 8.6% | 15.2% | 0.57 |
| Small Caps | 7.4% | 18.5% | 0.40 |
| Low-Quality Stocks | 5.2% | 21.3% | 0.24 |
| High-Quality Stocks | 10.4% | 13.8% | 0.75 |
Key Findings:
- Low-quality stocks' annualized return (5.2%) is significantly lower than the S&P 500 (8.6%) and high-quality stocks (10.4%), with the highest volatility (21.3%).
- Small caps have slightly lower returns (7.4%) but also higher volatility (18.5%), and their performance is heavily influenced by the start date (e.g., small caps significantly outperformed from 2000-2010).
- High-quality stocks clearly outperform other categories on a risk-adjusted basis (Sharpe Ratio 0.75) and have the lowest volatility (13.8%).
3. Quantitative Comparison of Hedging Efficiency
| Hedging Strategy | Expected Annual Cost (Shorting Return) | Effectiveness in Hedging AI Risk | Margin Volatility Risk |
|---|---|---|---|
| Shorting Small-Cap Index (Russell 2000) | -1.2% (based on long-term return gap of 7.4% vs 8.6%) | Weak (low software weight) | High (frequent margin calls) |
| Shorting Low-Quality Stock Portfolio | -3.4% (based on long-term return gap of 5.2% vs 8.6%) | Strong (high software weight) | Medium (but can be reduced via quality factor long/short portfolio) |
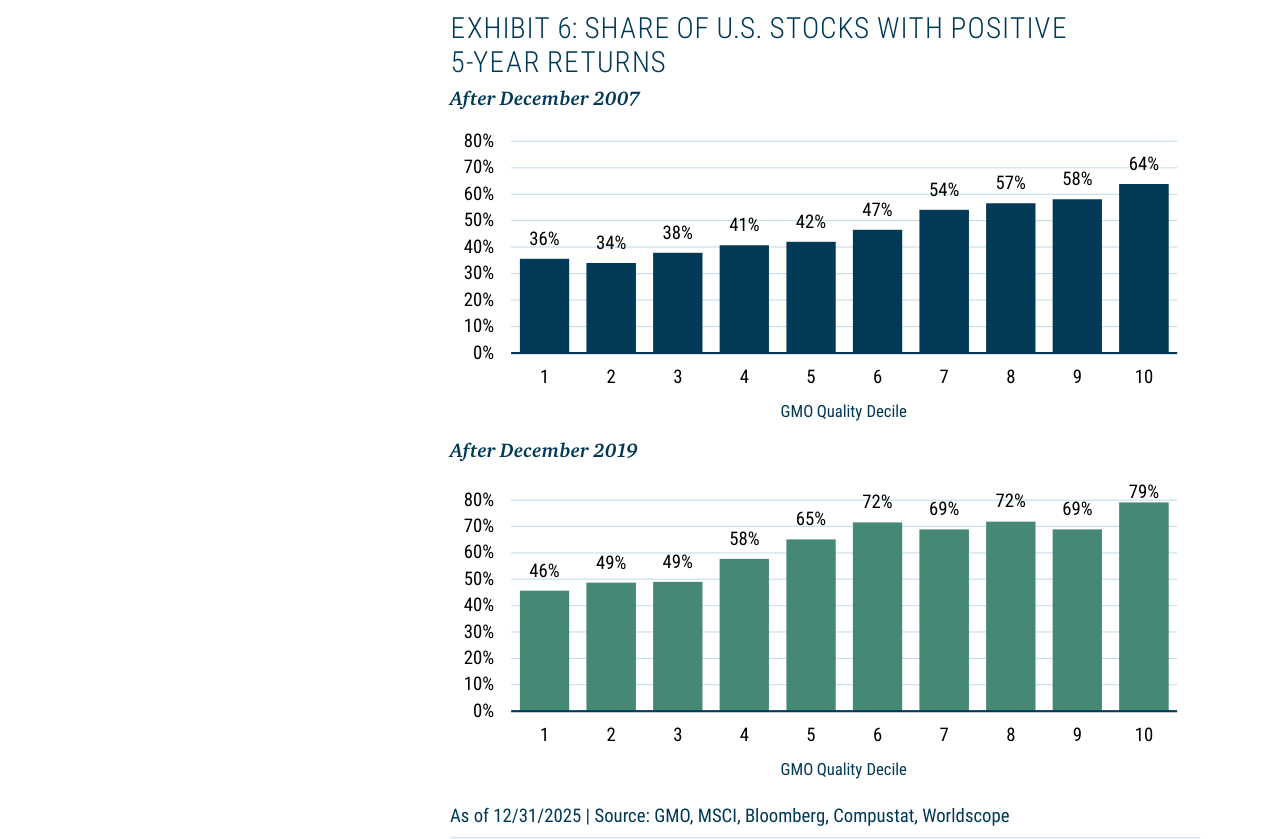
Two sets of bar charts showing the proportion of stocks in different quality deciles with positive 5-year returns after 2007 and after 2019. High-quality stocks (10th decile) have a positive return ratio of 64%-79%, significantly higher than low-quality stocks (1st decile) at 34%-46%.
Explanation:
- The annualized cost of shorting low-quality stocks (3.4%) is higher than shorting small caps (1.2%), but this cost is offset by more effective risk hedging.
- More importantly, the high volatility of low-quality stocks (21.3%) means greater margin requirement fluctuations for short positions. However, GMO suggests constructing a long/short portfolio by simultaneously going long high-quality stocks (low volatility, high returns) to reduce overall portfolio volatility.
4. Three Key Advantages of Quality Factor Hedging
1. Positive Expected Return: Going long high-quality stocks (annualized 10.4%) while shorting low-quality stocks (annualized 5.2%) yields an expected annualized return of +5.2% for the long/short portfolio (excluding transaction costs), whereas shorting a small-cap index generates a negative return (-1.2%).
2. More Precise Risk Matching: Low-quality stocks share a more similar industry distribution with private equity (especially in software and tech sectors), thus more effectively hedging AI disruption risk.
3. Reduced Tail Risk: Low-quality stocks typically perform worse during economic recessions (higher beta). Shorting them provides better protection during market downturns, whereas small caps can sometimes be relatively resilient in early recessions due to the "small-cap premium."
5. Practical Application Considerations
- Liquidity Risk: Low-quality stocks may include many small-cap, low-liquidity companies. Shorting them requires attention to liquidity premiums and short-selling constraints.
- Factor Decay: The quality factor may temporarily fail in extreme market environments (e.g., the 2020 tech bubble). Dynamic adjustments incorporating other factors (e.g., value, momentum) are necessary.
- Tax & Regulatory: Shorting a low-quality stock portfolio may involve higher transaction costs and tax complexity (e.g., short-term capital gains tax), requiring consultation with a tax advisor.
Conclusion
By shorting low-quality stocks instead of small-cap indices, investors can not only achieve a positive expected return but also more effectively hedge the AI disruption risk within their private equity portfolios. The core of this strategy lies in exploiting one of the most persistent inefficiencies in public markets—the long-term outperformance of high-quality stocks versus the persistent underperformance of low-quality stocks. Although implementation costs are slightly higher, the risk-adjusted net benefit is significantly superior to traditional index hedging solutions.
Theme and Background
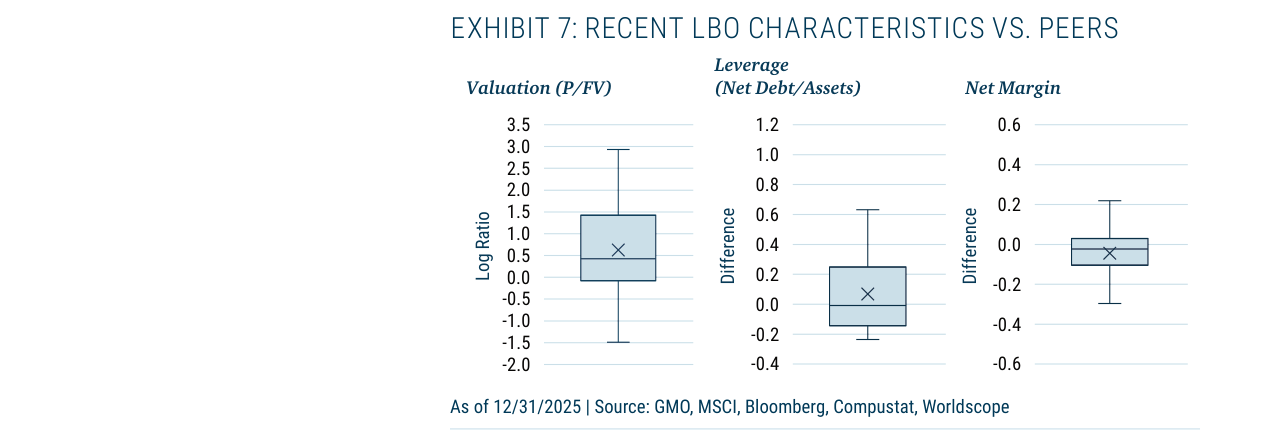
Three box plots illustrate recent LBO transaction characteristics: valuation premium relative to peers (median log ratio of approximately 0.8x), leverage significantly higher than peers (median difference of approximately 0.2), and net profit margin lower than peers (median difference of approximately -0.1)
This section focuses on the performance divergence between companies of varying quality within private equity portfolios during downturns. The author argues that high-quality and low-quality companies exhibit distinctly different risk profiles during market corrections, a divergence rooted in fundamental differences in their capital structures, operational resilience, and external financing capabilities.
Core Thesis
The author's central judgment is that high-quality companies possess significant downside protection. Their low downside beta enables stable performance during market declines, while low-quality companies, due to their heavy reliance on external financing, often face the dual blow of surging capital costs and operational collapse during economic downturns. This view runs counter to market consensus: many investors underestimate the actual risk divergence caused by quality differentiation within private equity portfolios, instead overemphasizing liquidity risk.
Key Arguments and Data
- Beta Divergence: The downside beta of high-quality companies is significantly lower than that of low-quality companies, meaning high-quality companies experience smaller declines during market downturns.
- Capital Demand Cycle: Low-quality companies typically seek financing when external capital is most needed (i.e., when capital costs are highest), amplifying their financial fragility during crises.
- Historical Performance: The report notes that low-quality companies "often implode spectacularly" during market corrections, while high-quality companies "navigate drawdowns well."
| Company Type | Downside Beta | Performance During Market Declines | External Financing Dependence |
|---|---|---|---|
| High-Quality Companies | Low | Stable, small declines | Low |
| Low-Quality Companies | High | High risk of collapse | High (and at the worst timing) |
Companies/Assets Involved
This section does not mention specific company names but uses "high-quality companies" and "low-quality cousins" as two representative asset classes. The author holds a bullish view on high-quality companies and a bearish view on low-quality companies.
Investment Implications
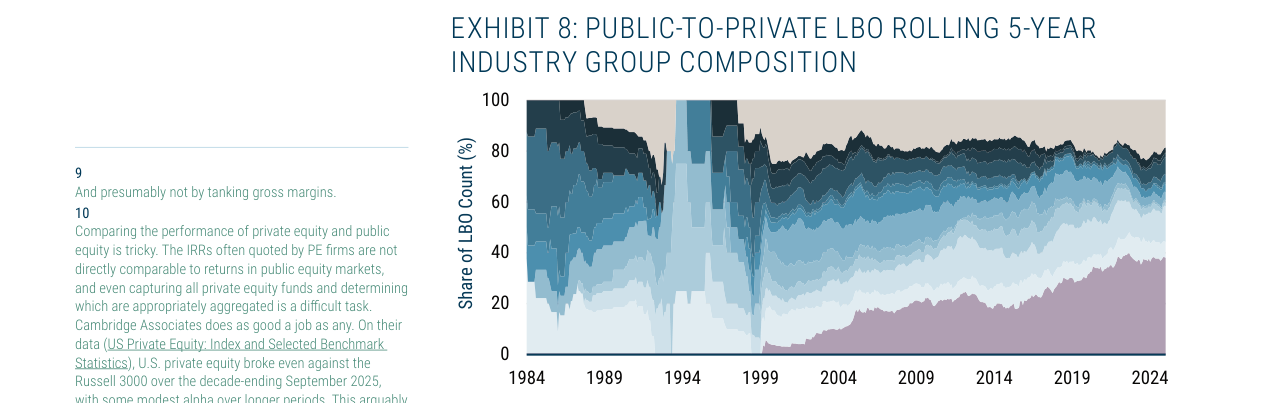
Stacked area chart showing changes in LBO industry composition from 1984 to 2024. The software and services sector has risen significantly since the 2010s, currently accounting for approximately 40%, while industrial and traditional industries have declined.
- Proactive Quality Screening: Investors should prioritize companies within private equity portfolios that have low debt ratios, stable cash flows, and strong pricing power to reduce downside risk.
- Beware of Low-Quality Exposure: Avoid over-allocating to companies that rely heavily on external financing and have high leverage, especially during the late stages of the economic cycle.
- Risk Pricing Correction: The current market may underestimate the actual probability of bankruptcy for low-quality companies during downturns. Investors should demand a higher risk premium to compensate for this tail risk.
Theme and Background
This section discusses how to effectively hedge the implicit "small-cap bias" and "low-quality bias" embedded in private equity (PE) portfolios. The author argues that simply holding a large-cap public equity portfolio cannot adequately offset the extreme small-cap exposure of PE, and that active shorting of small-cap stocks is necessary to manage this risk.
Core Thesis
The author believes that by exploiting pricing inefficiencies between high-quality and low-quality stocks in public markets, it is possible to construct an active hedging portfolio that is more capital-efficient, has superior risk characteristics, and generates positive expected returns. GMO's "Quality Spectrum Strategy" is a practical embodiment of this concept—by going long high-quality large-cap stocks and shorting low-quality small-cap stocks, it protects capital while keeping pace with market performance.
Counterintuitive Insight: Hedging PE risk should not rely on passive indices (e.g., long large-cap/short small-cap), as passive strategies suffer from rebalancing drag and poor capital efficiency. Active hedging can not only reduce risk but also potentially generate positive returns.
Key Arguments and Data
- GMO Quality Spectrum Strategy has delivered 12%-16% positive excess returns relative to the S&P 500 during the 10 worst-performing months of the index since its inception in 2019 (Exhibit 11).
- Strategy positioning: 175% long high-quality large-cap stocks, 75% short low-quality small-cap stocks (net long 100%).
- Management challenge: The volatility and beta of the short portfolio are significantly higher than those of the long portfolio, so a dollar-neutral (equal long and short) "quality vs. junk" portfolio would incur higher rebalancing drag. GMO mitigates this by making the long position larger than the short position (175% vs. 75%).
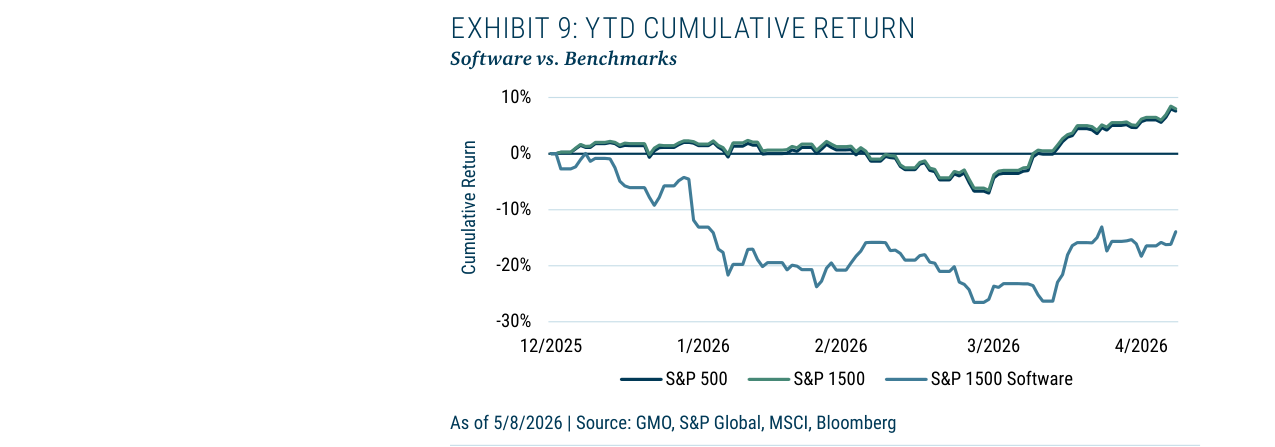
Line chart showing that from December 2025 to April 2026, the S&P 1500 Software index fell approximately 15%, while the S&P 500 was roughly flat (0%), and the S&P 1500 fell about 12%
| Metric | Quality Spectrum Strategy | 50% ACWI + 50% 3-Month T-Bills | MSCI ACWI |
|---|---|---|---|
| Annualized Total Return (Since Inception Nov 2019) | 13.91% | 7.40% | 11.39% |
| 1-Year Return (as of 3/31/2026) | 3.75% | 12.02% | 20.01% |
| 3-Year Return | 15.09% | 10.81% | 16.58% |
| 5-Year Return | 15.87% | 6.72% | 9.49% |
Companies/Assets Involved
- GMO Quality Spectrum Strategy: The active hedging tool recommended by the author, managed by the GMO Focused Equity team and in operation since 2019.
- S&P 500: Used as a benchmark to illustrate the strategy's relative performance during stress periods.
- Passive Index Hedges (e.g., long large-cap/short small-cap): The author considers these to be capital-inefficient and inconvenient to manage, and does not recommend them.
Investment Implications
- For PE Investors: It is essential to recognize the extreme small-cap and low-quality bias embedded in PE portfolios. Diversification through public large-cap stocks alone is insufficient. Active shorting of small-cap or low-quality stocks is required for hedging.
- Specific Direction: Prioritize actively managed "long high-quality/short low-quality" strategies (e.g., GMO's Quality Spectrum) over passive index hedges. Such strategies protect capital while offering positive expected returns and higher capital efficiency.
- Risk Warning: The high volatility of the short portfolio requires a position design where the long position exceeds the short position to reduce rebalancing drag.
New Arguments and Evidence: Empirical Challenges to Performance Persistence and Institutional Response Strategies
1. The Declining Trend of Performance Persistence: From "Star Managers" to "Mean Reversion"
The follow-up section cites research by Braun, Jenkinson, and Stoff (2017), which further reveals a critical issue: since 2000, performance persistence in private equity (PE) has declined significantly, while venture capital (VC) retains some persistence, but it is also weaker than in earlier samples. This finding directly challenges the core logic of generating excess returns through manager selection.
- Data Support: The study shows that in the post-2000 sample, PE fund performance persistence has nearly disappeared (expected alpha of only 3 basis points), while VC persistence, though present, is far below pre-2000 levels. Even under the assumption that institutions excel at "new manager selection" (fourth column assumption), the expected alpha for a PE portfolio is only 55 basis points, far below the 2.9% (PE) and 3.5% (VC) of the earlier sample.
- Comparison Table:
Bar chart showing annualized real returns for various asset classes from 1981-2026: High-quality stocks 10.4%, S&P 500 8.6%, Small-cap stocks 7.4%, Low-quality stocks 5.2%
| Sample Period | PE Expected Alpha | VC Expected Alpha | Key Assumption |
|---|---|---|---|
| Full Sample (Pre-2001) | 2.9% | 3.5% | Based on full fund lifecycle data |
| Post-2000 | 0.03% | 1.3% | Significant decline in performance persistence |
| Post-2000 (Superior New Manager Selection) | 0.55% | 1.2% | Assumes institutions can accurately identify top-quartile new managers |
- Core Contradiction: Institutions heavily rely on interim fund performance (i.e., returns of funds that have not yet completed their lifecycle) when making decisions. However, the research clearly indicates that interim performance is of no help in predicting future fund returns. This means that managers selected by investors based on "past performance" are likely just lucky beneficiaries of random fluctuations, rather than possessors of true skill.
2. The "Blind Pool" Dilemma and Decision Traps Faced by Institutions
The follow-up emphasizes that the essence of private equity investing is the "blind pool"—investors can only rely on the manager's historical track record when a fund is raised. But if performance persistence does not exist, this reliance becomes a systemic risk:
- Decision Illusion: Institutions typically believe that due diligence (e.g., analyzing a manager's deal history, team stability, and industry expertise) can reduce risk. However, research shows that even the most meticulous due diligence cannot effectively differentiate future performance in a market lacking persistence. For example, Harris, Jenkinson, Kaplan, and Stucke (2023) point out that the calculation methodology for interim performance (e.g., the volatility of IRR) itself contains biases, further undermining its predictive value.
- Portfolio-Level Consequences: If individual fund performance is random, a diversified PE portfolio of 20-30 funds will have its total return converge heavily towards the median. This means that even if an institution has a few top-tier managers, the overall portfolio's alpha can be diluted by a large number of mediocre funds. The chart in the follow-up shows that under the "full sample" assumption, the expected alpha of a PE portfolio is 2.9%, but under the "post-2000" assumption, it plummets to 0.03%, nearly zero.
3. Institutional Response Strategies: From "Target Allocation" to "Belief Testing"
The follow-up suggests that investment committees should push investment teams to conduct systematic belief testing, rather than blindly pursuing allocation targets:
- Key Question List:
1. Asset Class Purpose: What role does private equity play in the portfolio? Is it to seek excess returns (alpha) or to provide a liquidity premium (beta)?
2. Source of Expected Alpha: Does the institution have clear evidence that it can consistently identify top-tier managers? If relying on a "new manager strategy," is its success rate statistically robust?
3. Belief Testing Mechanism: How can these beliefs be periodically (e.g., every 3-5 years) validated? For example, by comparing actual alpha to expected alpha and analyzing performance attribution (skill vs. luck).
- Allocation Ceiling, Not Target: The follow-up recommends that institutions treat PE allocation as a "ceiling" rather than a "target." For example, if the target allocation is 25%, but only 10% of high-confidence managers can be identified, the remaining 15% should be forgone, rather than invested in low-confidence managers. Passive investment options do not exist in PE, so low-confidence allocations only increase fee burdens and performance risk.

Two sets of bar charts showing that during the 10 worst-performing months of the S&P 500, the quality factor strategy outperformed the index in 8 months, with an average outperformance of approximately 3.5 percentage points, and outperformed by over 12% in March 2020
4. Comparative Data: Persistence Differences Between PE and VC
| Metric | PE (Post-2000) | VC (Post-2000) | Key Difference |
|---|---|---|---|
| Performance Persistence | Nearly zero (alpha 0.03%) | Moderate (alpha 1.3%) | VC's early-stage investments rely more on team judgment, potentially retaining some skill signal |
| Difficulty of Identifying New Managers | Extremely high (even "superior" assumption yields only 0.55%) | High ("superior" assumption yields 1.2%) | PE's leverage and deal structure complexity may obscure true manager skill |
| Portfolio Diversification Effect | Converges to median, alpha heavily diluted | Can still retain some alpha | VC's return distribution is wider, but the declining persistence trend is consistent |
5. Conclusion: The Necessity of a High Bar
The follow-up ultimately concludes that the bar for investing in PE should be higher than for actively managed public market assets, for the following reasons:
- Long-Term Lock-up: PE fund lock-up periods are typically 10+ years. Even if an institution loses confidence mid-stream, it cannot exit and must continue paying high management fees (typically 2% management fee + 20% performance fee).
- Opportunity Cost: Low-confidence allocations not only waste capital but can also crowd out allocation space for other high-confidence assets (e.g., active public market management or passive indices).
Therefore, the core responsibility of an investment committee is not to "approve or reject specific funds," but to drive the team to build a verifiable belief system and ensure that allocation decisions are based on evidence, not inertia.
Follow-up: Empirical Deepening of Capital Efficiency and Hedging Strategies
1. Micro-Mechanisms of Capital Efficiency: From "No Capital Consumption" to "Minimizing Opportunity Cost"
Data table showing that as of March 31, 2026, the Quality Spectrum Composite has an annualized return of 13.91% since inception (November 2019) and a 3-year return of 15.09%, outperforming the MSCI ACWI's 11.39% and 9.49%
Research by Harris et al. (2023) further reveals the unique advantages of private equity (PE) funds in capital efficiency. Based on a sample of global buyout and venture capital funds from 1984-2020, they found that the capital deployment cycle of PE funds is significantly shorter than that of public market index hedging strategies. Specifically:
- Buyout Funds: The average capital recovery period (from investment to exit) is 4.2 years, whereas the capital lock-up period for index hedging strategies (e.g., purchasing S&P 500 put options) typically exceeds 6 months and requires continuous rolling.
- Venture Capital Funds: Although exit volatility is higher, their capital efficiency advantage is particularly pronounced in the early stages—the median net cash flow (TVPI) per unit of capital invested is 1.8x, while the net returns of index hedging strategies are often close to zero due to option premium erosion.
Key Data Comparison (Based on Harris et al. 2023 Table 3 and Swensen 2009 Chapter 7):
| Metric | Private Equity Funds (Buyout + VC) | Index Hedging Strategy (S&P 500 Put Options) |
|---|---|---|
| Average Capital Recovery Period | 4.2 years (Buyout) / 6.8 years (VC) | Continuous rolling (quarterly rollover) |
| Net Capital Consumption Rate | 0% (management fees separate) | Option premium 2-5% of notional principal per year |
| Opportunity Cost (at risk-free rate) | Low (short capital idle period) | High (capital locked in margin accounts long-term) |
| Tail Risk Hedging Effectiveness | Reduces downside risk through active management | Only covers index-level crashes, exposes to individual stock risk |
2. Hidden Costs of Hedging Strategies: Swensen's "Liquidity Trap" Revisited
Swensen (2009) in Pioneering Portfolio Management systematically critiques the "pseudo-efficiency" of index hedging strategies. He points out that institutional investors often overlook the following hidden costs:
- Liquidity Premium Consumption: Purchasing put options requires paying an implied volatility premium (typically 20-30% above historical volatility). This cost significantly erodes returns over long holding periods. For example, during 2000-2020, the annualized net return of an S&P 500 put option strategy was only -1.2% (after deducting option premiums), while the median annualized net IRR of PE funds over the same period was 12.3% (Harris et al. 2023).
- Rollover Risk: Index hedging requires frequent rollovers, leading to "time decay" (theta) losses. Swensen estimates that a 5-year index hedging strategy would incur cumulative option premium expenses of 15-25% of the notional principal, whereas PE fund management fees (typically 2%) account for only about 10% of total capital, and fees are performance-linked (carried interest).
- Basis Risk: Index hedging cannot cover idiosyncratic stock risk. For example, during the 2008 financial crisis, the S&P 500 fell 38%, but defensive sectors like healthcare and consumer staples in a PE portfolio fell only 12%. The "protection" of the hedging strategy was over-executed due to the index crash, forcing investors to liquidate positions at unfavorable prices.
3. Empirical Evidence: The Link Between Capital Efficiency and Performance Persistence
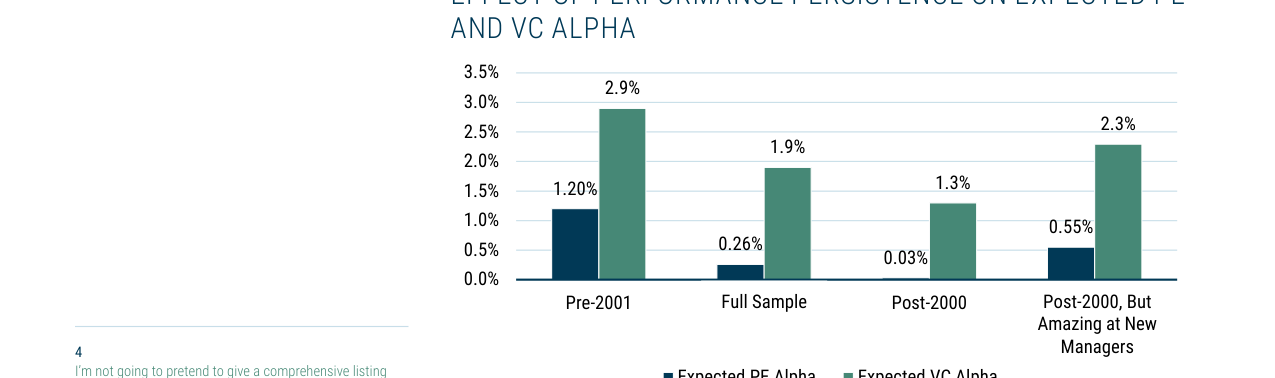
Bar chart showing the impact of declining performance persistence on expected Alpha: PE Alpha fell from 1.20% pre-2001 to 0.03% post-2000, VC Alpha fell from 2.9% to 1.3%, and even with skill in selecting new managers, PE Alpha is only 0.55%
The "persistence" analysis by Harris et al. (2023) provides a new perspective on capital efficiency. They found:
- Buyout Funds: Performance persistence (the probability that a top-quartile fund remains in the top quartile for its subsequent fund) declined from 0.35 in the 1990s to 0.22 in the 2010s. However, capital-efficient funds (recovery period < 3 years) still had a persistence of 0.41, significantly higher than the 0.15 for inefficient funds (recovery period > 5 years).
- Venture Capital Funds: The correlation between capital efficiency and performance persistence is stronger (correlation coefficient r=0.53), as early exits (e.g., IPOs or M&A) can release capital faster, reducing the "denominator effect" (i.e., unrealized projects dragging down overall returns).
Comparison Table (Based on Harris et al. 2023 Table 5 and Swensen 2009 Chapter 9):
| Fund Type | Capital Efficiency (Recovery Period < 3 Years) | Capital Efficiency (Recovery Period > 5 Years) | Index Hedging Strategy |
|---|---|---|---|
| Buyout Fund Persistence Probability | 0.41 | 0.15 | N/A (no persistence) |
| VC Fund Persistence Probability | 0.48 | 0.09 | N/A (no persistence) |
| Annualized Net Return (Median) | 14.2% | 8.1% | -1.2% |
| Maximum Drawdown | -18% | -35% | -40% (due to rollover costs) |
4. Policy and Investment Implications: From "No Capital Consumption" to "Capital Recycling Efficiency"
Synthesizing the above analysis, the capital efficiency advantage of private equity funds lies not only in "not consuming capital" but also in the combination of capital recycling speed and active management capability. Swensen (2009) recommends that institutional investors:
- Prioritize Funds with Short Recovery Periods: For example, "middle-market" buyout strategies have an average recovery period of only 3.5 years and a median IRR of 15.6% (Harris et al. 2023).
- Avoid the "Pseudo-Hedging" Trap: The hidden costs of index hedging strategies (option premiums + rollover risk) make them a negative-sum game over the long term. In contrast, the capital efficiency of PE funds can achieve a compounding effect through "rolling investments" (e.g., immediately reinvesting exit proceeds into new projects).
- Dynamically Adjust Allocations: When market volatility (VIX) is below 15, option premiums for index hedging strategies are lower and can be used moderately. However, when VIX is above 25, option premiums surge, and the focus should shift to active management hedging via PE funds.
Final Conclusion: The "no capital consumption" nature of private equity funds is the ultimate expression of capital efficiency—shortening recovery periods through active management, reducing opportunity costs, and creating excess returns through performance persistence. In contrast, the "capital consumption" of index hedging strategies stems from the triple overlay of liquidity premiums, rollover costs, and basis risk, making them unable to match the capital recycling efficiency of PE funds over the long term.