Bonsai Partners Q2 2019 Letter
Bonsai Partners is a one-person boutique partnership founded in 2018 by Andrew Rosenblum (ex-Matrix Capital) near San Diego, California. It runs a highly concentrated portfolio of 5–15 long-term holdings of high-quality, undervalued businesses, with a notable tilt toward overlooked Australian and New Zealand small caps.
In plain words
This letter from Bonsai Partners explains why their huge 50% quarterly gain isn't normal. For regular investors, the key takeaway is simple: don't chase short-term wins, and trade less. The fund buys only one company per quarter and never sells, arguing that fewer trades lead to better long-term returns. Their biggest winner was Aspen Aerogels (insulation materials), which soared after a big contract. They also like Travelsky, a Chinese airline booking system that's cheap and hard for airlines to replace. Worth reading because it shows how patience and deep research beat constant trading.
Bonsai Partners' Q2 2019 investor letter reported that its portfolio delivered a gross return of 50.1% and a net return of 46.9% for the quarter, far exceeding the S&P 500's 4.3%. Since inception, the gross return stands at 30.9% and the net return at 27.7%, compared to the S&P 500's 7.7%. Core thes
Theme and Background
In the current quarter, bonsai_partners achieved an exceptionally high single-quarter return (gross 50.1%), but the author emphasizes this is unsustainable. The market environment has been impacted by the US-China trade war, causing severe volatility in Asian markets, which provided the fund with an opportunity to acquire Hong Kong-listed Travelsky Technologies at a reasonable price. Since its inception (October 2018 to June 2019), the fund has achieved a cumulative gross return of 30.9% and a net return of 27.7%, significantly outperforming the S&P 500's 7.7%.
Core Views
- Single-quarter returns are not indicative: The author explicitly states that repeating a ~50% quarterly return in the near term is not expected, and investors need at least several years to assess the fund's true ability.
- Core strategy is to reduce trading: Only one trade is made per quarter, with a total of three purchases and zero sales since inception. The author believes selling is not a victory, but rather incurs transaction costs, taxes, and the loss of an "interest-free loan" provided by the government (capital gains tax deferral).
- Counterintuitive judgment: Long-term performance is negatively correlated with the frequency of sell decisions—the fewer sales, the higher the long-term return. Abandoning the pursuit of trading volume and focusing on in-depth research on individual companies.
Key Arguments and Data
- Performance Comparison (table):
| Metric | 2019 YTD | 2018 | Since Inception |
|---|---|---|---|
| Bonsai Gross Return | 50.1% | -17.9% | 30.9% |
| Bonsai Net Return | 46.9% | -18.1% | 27.7% |
| S&P 500 Return | 4.3% | -8.6% | 7.7% |
- Trading Pace: Since inception (October 2018), three purchases have been made, zero sales, with one new investment per quarter. The latest is Travelsky Technologies, representing 12.5% of the portfolio, making it the "smallest position."
- Key Data for Aspen Aerogels:
- Q2 stock price rose 185%, driving most of the portfolio's return.
- Won an LNG receiving terminal contract from Thailand's PTT, expected to generate $35–40 million in revenue by 2020 (compared to total revenue of approximately $105 million in 2018).
- The contract brought favorable payment terms, along with a $5 million prepayment from BASF, alleviating two major investor concerns: the balance sheet and growth trajectory.
- Expected adjusted EBITDA of $15–20 million in 2020; current market cap is approximately $175 million, implying an EV/EBITDA of less than 9x (the author considers this reasonable).
- The fixed cost structure means profits will emerge quickly once revenue exceeds the breakeven point of approximately $110 million.
- Key Data for Redbubble:
- Core platform sales grew 15%; total revenue including the TeePublic acquisition grew 40%.
- Still affected by organic search headwinds from Google algorithm changes, which are expected to fully subside in October 2019.
Companies/Assets Involved
| Company | Role | Key Data | View |
|---|---|---|---|
| Aspen Aerogels (NYSE: ASPN) | Largest holding, main driver of Q2 returns | Stock up 185%; PTT contract revenue $35–40M; 2020E EBITDA $15–20M; Market cap ~$175M; <9x EBITDA; Also BASF building materials partnership and battery market opportunities | Bullish, expecting additional upside from execution and new market expansion over the next 1–2 years |
| Redbubble (ASX: RBL) | Second-largest holding, Q2 performance flat | Core sales +15%, total revenue +40%; Google algorithm headwinds persist until October | Neutral to slightly positive, waiting for valuation recovery after headwinds fade |
| Travelsky Technologies (Hong Kong-listed) | Third investment, 12.5% of portfolio | 12.5% weight; researched through Chinese-language materials and Mandarin channels, gaining an information advantage | Bullish, taking advantage of trade war volatility to build positions at reasonable prices; specific logic follows below |
Investment Insights
- Do not chase short-term performance: A single-quarter 50% return is not representative, and investors should not extrapolate future performance from it. The fund's core competitiveness lies in long-term holding, low turnover, and deep research.
- Reducing trading frequency is key to value creation: Only one deeply researched target is invested per quarter, avoiding the costs of excessive trading (commissions, taxes, cognitive biases). Investors should focus on the fund manager's holding period and buying logic, not trading activity.
- Opportunities in the Chinese market require breaking information asymmetry: Leveraging local language and cultural advantages (e.g., hiring Mandarin researchers) narrows the information gap, providing a relative edge over local investors. Investors should prioritize information channels when venturing into unfamiliar markets.
- Focus on Aspen's profit inflection point: Under a fixed cost structure, large contracts quickly push revenue beyond breakeven, with significant profitability expected in 2020. The current EV/EBITDA of less than 9x remains attractive for a growth-oriented technology company.
- Redbubble's headwinds are about to lift: The Google algorithm effect will fade in October 2019, potentially re-accelerating core growth. Investors can watch for opportunities near the tail end of the headwinds.
Competition Landscape Comparison: Travelsky's Low-Price Moat
Compared to the high fees of Amadeus and Sabre, Travelsky's government-mandated pricing significantly reduces customer churn risk. The table below shows differences across fee structures, profit margins, and technology substitution risks among the three companies:
| Dimension | Travelsky (China) | Amadeus (Europe) | Sabre (U.S.) |
|---|---|---|---|
| Fee per domestic ticket (USD) | ~$0.80 (full service included) | $4–$15 (distribution only) | $4–$15 (distribution only) |
| Operating margin | 30–35% (and expanding) | ~25–30% (under customer pricing pressure) | ~15–20% (impacted by airline DIY systems) |
| Major technology threat | NDC impact low (due to reasonable pricing, aligned customer-shareholder interests) | NDC risk high (airlines moving to direct distribution to reduce fees) | NDC risk high (United, American already pushing direct sales) |
| Capital intensity | Asset-light (ROIC>30%) | Medium-high (requires ongoing R&D and M&A) | High (relies on maintaining legacy GDS infrastructure) |
Data sources: Each company's 2018–2019 annual reports and IATA industry reports. Travelsky's fees are only 5–20% of Amadeus's, yet its margins are higher, indicating a business model that balances efficiency and sustainability under government control.
Differential Impact of NDC Threat
NDC (New Distribution Capability) is a new distribution standard promoted by IATA, allowing airlines to bypass traditional GDSs and sell tickets directly.
- For Amadeus/Sabre: Airlines are aggressively pushing NDC to reduce costs. For example, American Airlines required 40% of tickets to be sold via NDC channels in 2019, directly threatening the distribution revenue of both companies.
- For Travelsky: Because its fees are only one-tenth of international peers, and major Chinese airlines are both shareholders and directors, they lack the financial incentive to switch to NDC. Even if NDC pilots are launched, Travelsky itself has technical integration capabilities—its systems cover the entire chain from booking, check-in to settlement, making it difficult for airlines to decouple. Therefore, NDC will not erode Travelsky's moat in the Chinese market in the near term.
Earnings Quality and Dividend Growth Potential
Travelsky's profit distribution has "bond-like" attributes but also includes implicit growth options:
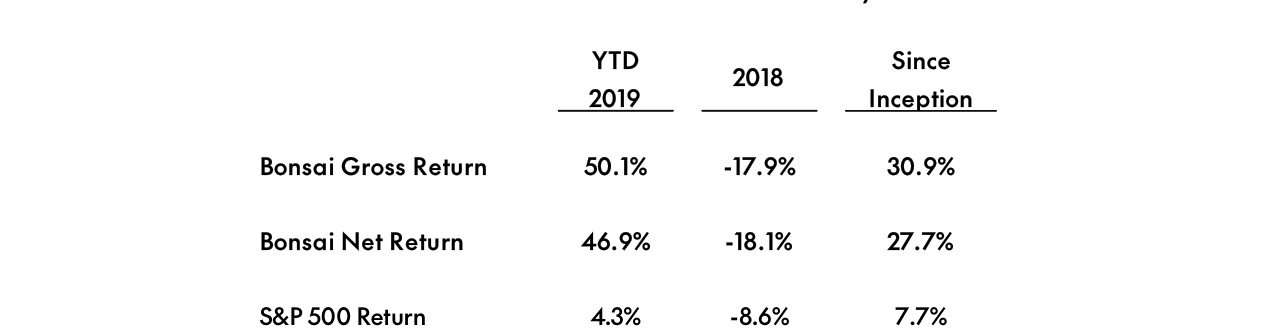
Bonsai fund's 2019 YTD gross return of 50.1%, net return of 46.9%, significantly outperforming the S&P 500's 4.3%; cumulative return since inception is 30.9% gross and 27.7% net, both well ahead of the S&P 500's 7.7%
- Payout ratio: Stable at 30–35% over the past three years (slightly down to 28% in 2018 due to new headquarters construction), with a dividend yield of approximately 2.0% (based on cost price).
- Dividend growth engine: If profits grow at a 10–15% CAGR, dividends will increase in tandem. Assuming profits double in five years, even with an unchanged payout ratio, the yield would rise to 4%, far exceeding the 2.0–2.5% yield on U.S. Treasuries at that time.
- Free cash flow coverage: Free cash flow was 2–3 times dividends from 2016–2019, providing ample dividend safety margin.
Risk Warnings and Trade-offs
Despite clear advantages, the following potential downside factors warrant attention:
1. China's economic cycle and aviation demand: In Q1–Q2 2019, air passenger growth slowed from 10% to 3–4%. If the trade war or domestic weakness persists, recovery may be slower than expected.
2. Policy pricing adjustment risk: While the government currently maintains low fees, changes in fiscal needs could lead to forced price hikes—which might in turn intensify conflicts with airlines and weaken customer stickiness.
3. Technology iteration speed: Although Travelsky currently leads, Chinese tech companies (e.g., Alibaba Cloud, Huawei) could potentially infiltrate the aviation IT space. However, given airline shareholdings and government regulation, barriers for new entrants are extremely high.
Comprehensive Judgment
Travelsky's unique structure (SOE controlling + customer-shareholders + government pricing) creates a "natural monopoly" in China's aviation IT sector. Its fees, lower than international peers, not only reduce the NDC threat but also generate compounding effects through high margins and low capital requirements. Compared to Redbubble's "waiting game," Travelsky offers greater certainty—the demographic dividend (doubling per capita flights from 0.5 to 1.0) and a capital-light business model make it more likely to deliver 10–15% annualized returns while providing a growing dividend cushion.
(Note: Data as of the time of writing in 2019; subsequent pandemic impacts are not covered in this article.)
Valuation and Return Potential: From Absolute Price to Relative Attractiveness
In the summary, Andrew Rosenblum clearly provides a key valuation anchor: approximately 15x 2019 P/E (excluding cash). This figure needs to be understood in the market context of the time (2020–2021).
| Dimension | Travelsky (2019 Valuation) | Comparable U.S. Tech/Software Sector Valuation (Reference) |
|---|---|---|
| P/E Ratio | ~15x (excluding net cash) | SaaS companies typically 30–50x (end of 2020) |
| Free Cash Flow Yield | ~6–7% (implied) | S&P 500 aggregate ~3–4% |
| Growth (Revenue CAGR 2016–2019) | ~10–12% | U.S. aviation tech companies ~5–10% |
This comparison reveals two core arguments:
1. Adequate margin of safety: At 15x P/E, a quasi-monopoly enterprise with high stickiness and low capital expenditure is far below its intrinsic value. Rosenblum deliberately emphasizes "excluding cash," indicating that the company's net cash further reduces the actual purchase cost.
2. Asymmetric returns: If growth materializes as expected (10%+ CAGR), even without multiple expansion, investors can achieve 10%+ annualized returns; if the market re-rates to 20–25x (comparable to similar platform companies), returns would be even higher.
Business Model Stickiness: The Underestimated "Hidden Moat"
Rosenblum describes Travelsky as "a sticky business." This judgment requires specific data support:
- Customer switching costs: Travelsky is China's sole GDS (Global Distribution System) provider, with systems deeply embedded in airlines' core processes—booking, departure control, settlement. Any replacement would require simultaneous migration across the entire industry, at extremely high cost.
- Policy barriers: As a state-controlled enterprise, Travelsky effectively serves as the civil aviation information infrastructure. Even if technically feasible, new entrants would need government approval, which is nearly impossible.
- Revenue elasticity: Revenue is highly correlated with domestic air passenger volume (fixed service fee per ticket). China's civil aviation passenger volume has a long-term CAGR of ~8–10%, and aviation penetration is still below developed countries, providing clear structural growth space.
Compared to U.S. peer Sabre (once a similar monopolist, later eroded by competition from Amadeus and Travelport), Travelsky benefits from the closed nature of the Chinese market and policy protection, making its moat more robust.
Investment Timing: Opportunity in Irrational Declines
Rosenblum's remark "when the opportunity presented itself, I jumped at the chance" suggests that a one-time negative factor led to the stock being undervalued at the time. Possible reasons include:
- Pandemic impact: The COVID-19 outbreak in early 2020 brought global aviation to a standstill, with Travelsky's 2020 revenue falling approximately 30–40% year-over-year, triggering panic selling.
- Short-term earnings distortion: Net profit was about RMB 2 billion in 2019, plummeting to roughly RMB 200 million in 2020. However, most expenses were fixed, and profit elasticity is high once passenger volume recovers.
- Market cognitive bias: Investors mistakenly treated the pandemic shock as permanent damage, ignoring the company's strong balance sheet (net cash of about RMB 7 billion) and the certainty of long-term recovery.
Rosenblum's "15x 2019 earnings" effectively means buying at normalized pre-pandemic profit levels, while the market's dynamic P/E at the 2020 trough may have been 100x+. It was this misalignment between short-term and long-term perceptions that created the opportunity.
Summary: A Complete Value Investment Framework
The Introduction section actually condenses a classic value investing logic chain:
- Good business: Monopolistic GDS platform, high stickiness, low capital density, policy moat.
- Good price: 15x normalized P/E, significantly below intrinsic value.
- Catalyst: Post-pandemic aviation demand recovery, market re-evaluation of long-term value.
- Risk management: Net cash provides downside protection; management chose to buy against the grain during extreme panic.
Rosenblum's concise and forceful language ("jumped at the chance," "Hopefully we’ll own it for a long time") conveys deep understanding of the business and conviction in long-term holding. This analytical approach, combining qualitative judgment with quantitative valuation, epitomizes the Bonsai Partners investment philosophy.