The S&P 500: Just Say No
GMO is a Boston asset manager co-founded in 1977 by Jeremy Grantham with Richard Mayo and Eyk Van Otterloo, known for valuation-driven dynamic asset allocation built on long-horizon mean reversion. Grantham is famous for calling historic bubbles, warning publicly ahead of both the 2000 dot-com crash and the 2008 financial crisis. Flagship publications include the GMO Quarterly Letter (now written by Asset Allocation co-heads Ben Inker and John Pease), Grantham's Viewpoints essays and the 7-Year Asset Class Forecast.
In plain words
This report warns against putting all your money into the S&P 500 (the top 500 US companies). The US stock market has soared over the past 7 years, but that's mostly because stocks got more expensive (higher price-to-earnings ratios), not because companies' earnings grew sustainably. Now valuations are at extreme highs, and the report predicts the S&P 500 could lose 2.8% to 3.9% per year over the next 7 years. In contrast, stocks in Europe, Japan, and emerging markets have performed poorly recently but are cheaper and may offer better long-term returns. The report also notes that for the first time ever, not a single US stock meets classic 'deep value' criteria. For regular investors, the key takeaway is to avoid chasing past performance, diversify globally, and not bet everything on one market.
GMO Report: The S&P 500: Just Say No Authored by Matt Kadnar and James Montier, the report's core argument opposes the strategy of indexing all equity assets into the S&P 500. It notes that over the past seven years, the S&P 500 has delivered a nominal annualized return of 15% (cumulative 173%), far
Theme and Background
The chapter opens with a fictional proposal from pension trustee Smith, directly targeting a common but dangerous consensus in the current market: indexing all equity assets to the S&P 500. The report notes that while the U.S. stock market has significantly outperformed other markets over the past seven years, this "glory" has primarily stemmed from valuation expansion rather than sustainable fundamental growth. The S&P 500's current valuation is at historically extreme levels.
Core Thesis
The author's core investment argument is: firmly reject indexing all equity assets to the S&P 500. This judgment is entirely contrary to the prevailing market narrative of "the U.S. is strongest, just buy the S&P 500." The author believes that, based on valuation analysis, the real return of the S&P 500 over the next seven years will be significantly negative (-2.8% to -3.9%), and investors who continue to bet on it will face severe losses.
Key Arguments and Data
1. Decomposition of Past 7-Year Returns: The S&P 500 delivered a nominal annualized return of 15% (cumulative 173%), far exceeding the MSCI EAFE (8% annualized, cumulative 71%) and MSCI Emerging Markets (4% annualized, cumulative 30%). However, the return structure is highly unhealthy:
- P/E expansion contributed 3.8%
- Margin expansion contributed 3.2%
- While equilibrium returns (dividends + real growth) contributed only 5.9%
- In contrast, over the long term since 1970, dividends contributed 3.4%, and P/E and margin expansion combined contributed only 0.6%

This page is the report cover, containing the title, author photo, and introductory text, with no data charts.
2. Extreme Current Valuations:
- GMO's model shows that for the S&P 500 to be fairly valued, the equilibrium P/E would need to reach 31x (currently ~24.4x), or profit margins would need to double.
- The Shiller P/E (cyclically adjusted price-to-earnings ratio) is at the third-highest level in history, trailing only 1929 and 1999.
3. 7-Year Return Forecast:
| Driver | Contribution |
|---|---|
| Effective Yield (Dividends + Buybacks) | 3.4% |
| Capital Growth | 1.5% |
| P/E Contraction | -4.0% |
| Margin Decline | -2.8% |
| Total Real Return | -2.8% to -3.9% |
Companies/Assets Involved
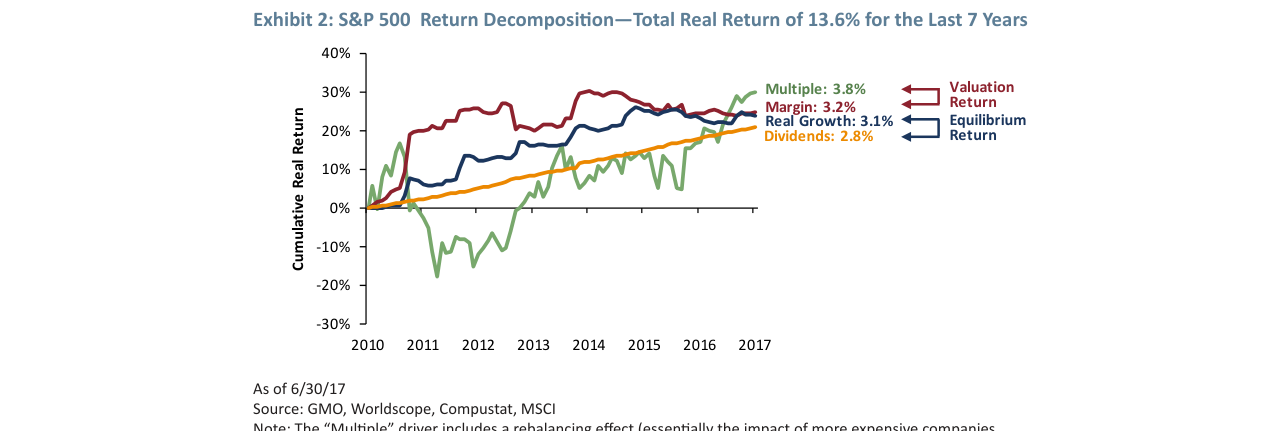
Over the past 7 years, the S&P 500's annualized real return was 13.6%, with multiple expansion contributing 3.8%, margin expansion 3.2%, and dividends only 2.8%, indicating recent returns were primarily valuation-driven rather than fundamental.
- S&P 500: Core analysis subject, currently overvalued, with a forecasted negative real return over the next seven years.
- MSCI EAFE: Significantly underperformed the S&P 500 over the past seven years (cumulative 71% vs. 173%), but valuations are relatively reasonable.
- MSCI Emerging Markets: Worst performer over the past seven years (cumulative 30%), but valuations may be more attractive.
Investment Implications
- Firmly avoid concentrating all equity assets in the S&P 500. At current valuation levels, the real return over the next seven years is highly likely to be significantly negative. Investors should substantially reduce their U.S. equity exposure.
- Focus on valuation, not recent performance: The high returns of the past seven years are unsustainable. P/E and margin expansion have reached their limits, and mean reversion will lead to severe losses.
- Consider diversification: Other markets (e.g., EAFE, Emerging Markets), despite recent poor performance, may have more reasonable valuations and better long-term return prospects.
- Beware the "American Exceptionalism" trap: The logic that the U.S. economy is the strongest, so its stock market must continue to rise, is extremely dangerous in the face of extreme valuations.
Supplementary Arguments: In-Depth Validation of Valuation Metrics and Market Structure Risks
1. Predictive Advantage of Trend-Adjusted Earnings: Empirical Evidence Beyond Traditional CAPE
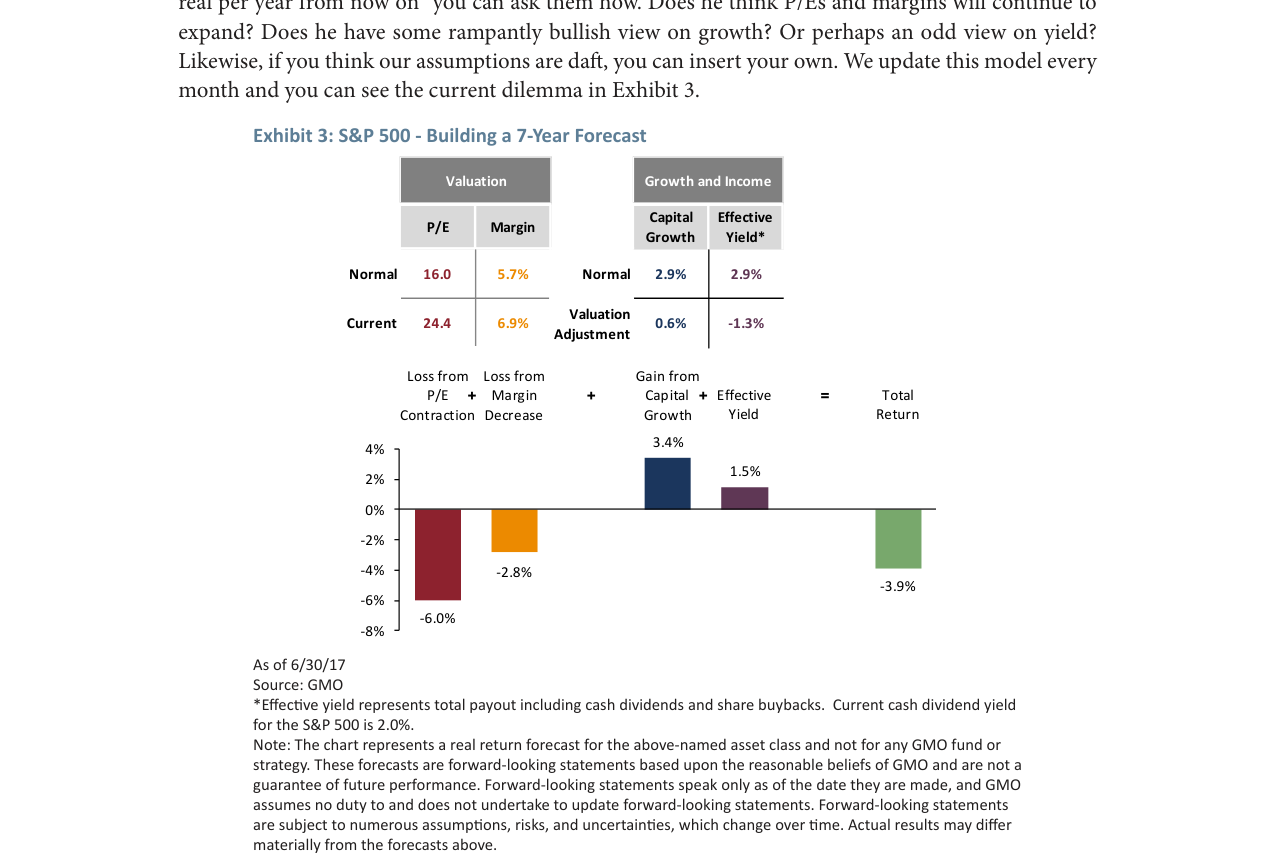
GMO's forecast model shows a -3.9% annualized real return for the S&P 500 over the next 7 years, with valuation contraction (P/E and margin decline) dragging it down by -8.8%, while capital growth and effective yield contribute 4.9%.
Although the 10-year smoothed earnings method proposed by Graham and Dodd (1934) can filter cyclical fluctuations, research by Montier (2014) shows that trend-adjusted 10-year earnings (Trend Earnings) performs better in predicting long-term returns. This metric, by removing deviations from the long-term earnings trend (e.g., current earnings above the trend line), avoids the "generous" overestimation of traditional CAPE during earnings peaks. Data shows that when 10-year real earnings are above trend (as in the current market), traditional CAPE underestimates valuation pressure, while trend-adjusted CAPE more accurately captures mean reversion risk. For example, at the peak of the TMT bubble in 2000, the traditional CAPE was around 44x, while the trend-adjusted CAPE was as high as 52x, resulting in smaller prediction errors for the subsequent decade of negative returns.
2. Extreme Signal from the Hussman P/E: The Second Most Expensive Market in History
The Hussman P/E uses peak earnings as a normalization benchmark, completely avoiding the drag of loss years like 2008 on the 10-year average. As of June 30, 2017, this metric indicated that the current U.S. stock market valuation was second only to the 1999-2000 TMT bubble period, rather than the third most expensive as suggested by traditional CAPE. Specific data comparisons are as follows:
| Valuation Metric | Current Level (June 2017) | Historical Peak (TMT Bubble) | Current Rank |
|---|---|---|---|
| Shiller P/E (CAPE) | 29.5x | 44.2x (Dec 1999) | Third Most Expensive |
| Hussman P/E | 35.0x | 38.5x (Mar 2000) | Second Most Expensive |
The extremity of the Hussman P/E indicates that even excluding anomalous years, the degree of valuation bubble in the current market is close to historical extremes, only slightly below the internet bubble.
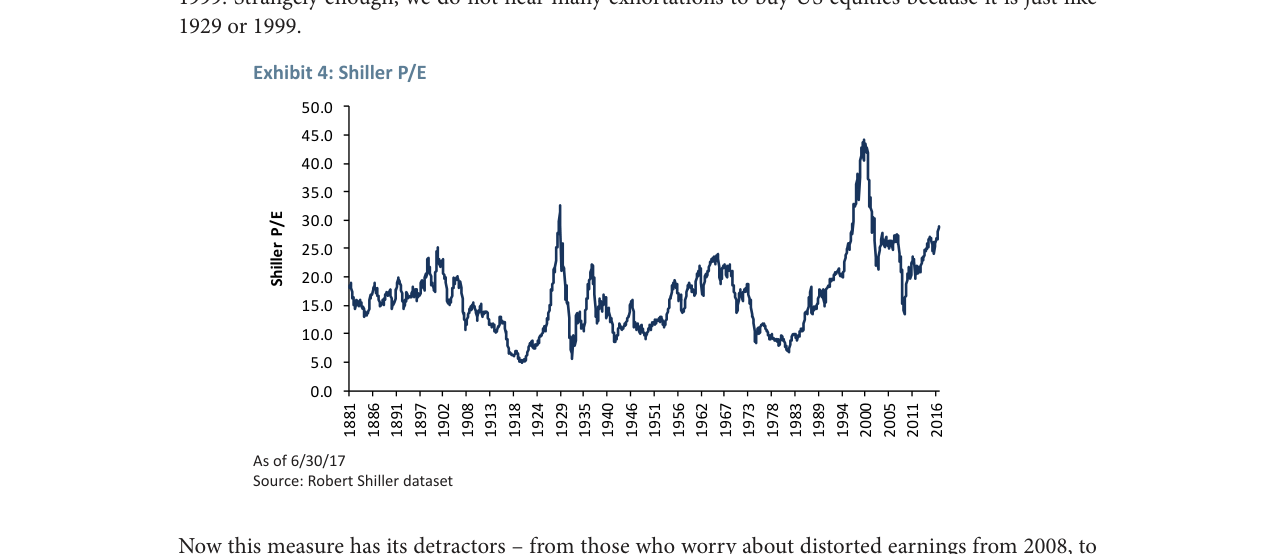
The Shiller P/E (CAPE) shows the current market valuation at approximately 30x, the third highest in history, trailing only before the Great Depression in 1929 and the internet bubble in 1999.
3. Median Stock Valuation: A Bubble of Unprecedented Breadth
Traditional index-weighted valuations can be distorted by a few large-cap stocks, but median stock valuations reveal a broader bubble. As of May 31, 2017:
- Median Price-to-Sales (P/S) Ratio: Reached an all-time high (approximately 2.0x), even exceeding the 1.8x level during the TMT bubble, indicating that the "average" stock has never been this expensive.
- Median Shiller P/E (P/E 10): Approximately 28x, close to levels before the 2007 Global Financial Crisis (30x) and during the TMT bubble (32x).
This means the current valuation bubble in U.S. stocks is not concentrated in a few tech stocks but has spread comprehensively across all industries. Historically, such broad-based valuation inflation often signals systemic risk—for example, after the 2000 bubble burst, median stocks fell by over 50%.
4. Ben Graham Deep Value Screen: A Warning of Zero Opportunities
The results of Ben Graham's classic deep value screen (requiring earnings yield ≥ 2x AAA bond yield, dividend yield ≥ 2/3 AAA bond yield, debt ≤ 2/3 tangible book value, Graham-Dodd P/E ≤ 16x) were startling in June 2017:
- U.S. Market: 0 stocks passed the screen, a first in history. Even on the eve of the 2008 financial crisis, about 5% of stocks (e.g., Microsoft) met the criteria.
- Other Markets: About 5% passed in Japan and Asia, and only 1-2% in Europe and the UK.
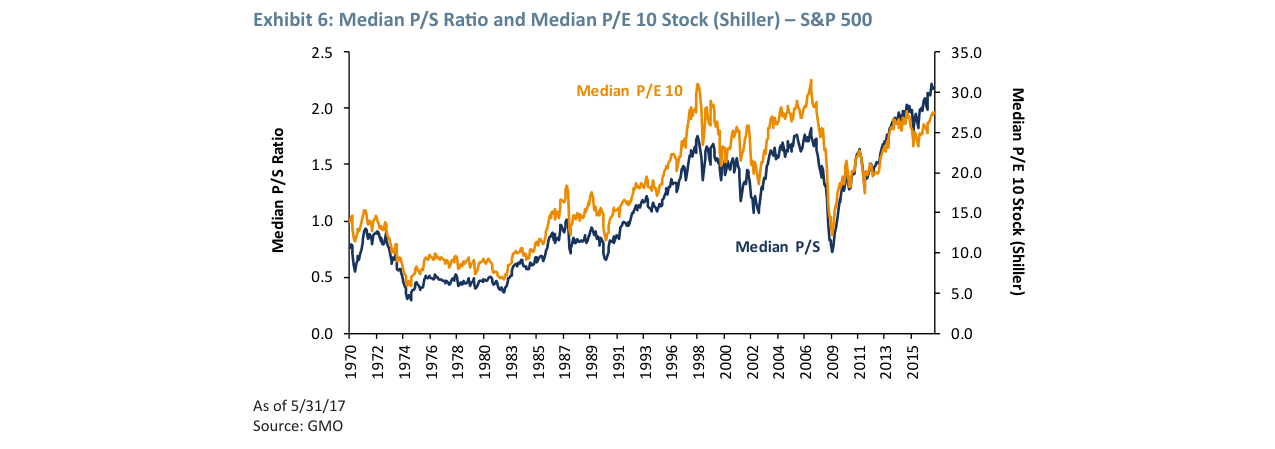
The median P/S ratio and median 10-year P/E (P/E 10) of S&P 500 constituents have both climbed to all-time highs, indicating that the median U.S. stock has never been this expensive.
Graham once noted that when "true bargains" disappear, investors should exit the stock market and turn to government bonds. The current zero pass rate means the market has no margin of safety, and any purchase relies on the "greater fool theory."
5. The Valuation Trap of Passive Investing: Systemic Risk from 30% of Assets
Despite extreme valuations, the share of passive investing continues to rise. As of 2015, approximately 30% of U.S. stock assets were held by passive index funds (Exhibit 9). This trend exacerbates market risk:
- Valuation Neglect: Passive investing forces investors to hold all stocks by market weight, including the most overvalued securities. In the third most expensive market, maintaining a normal weight is equivalent to betting that valuations will not mean-revert.
- Liquidity Mismatch: Inflows from passive funds push up the prices of index constituents, further distorting valuation signals. When mean reversion occurs, passive funds may face concentrated redemption pressure, amplifying market declines.
- Historical Comparison: At the peak of the TMT bubble in 2000, passive investing accounted for only about 10%; the current 30% share means the impact of a market correction would be far more severe.
6. Reflection on Forecast Failures: Challenges to the Mean Reversion Assumption
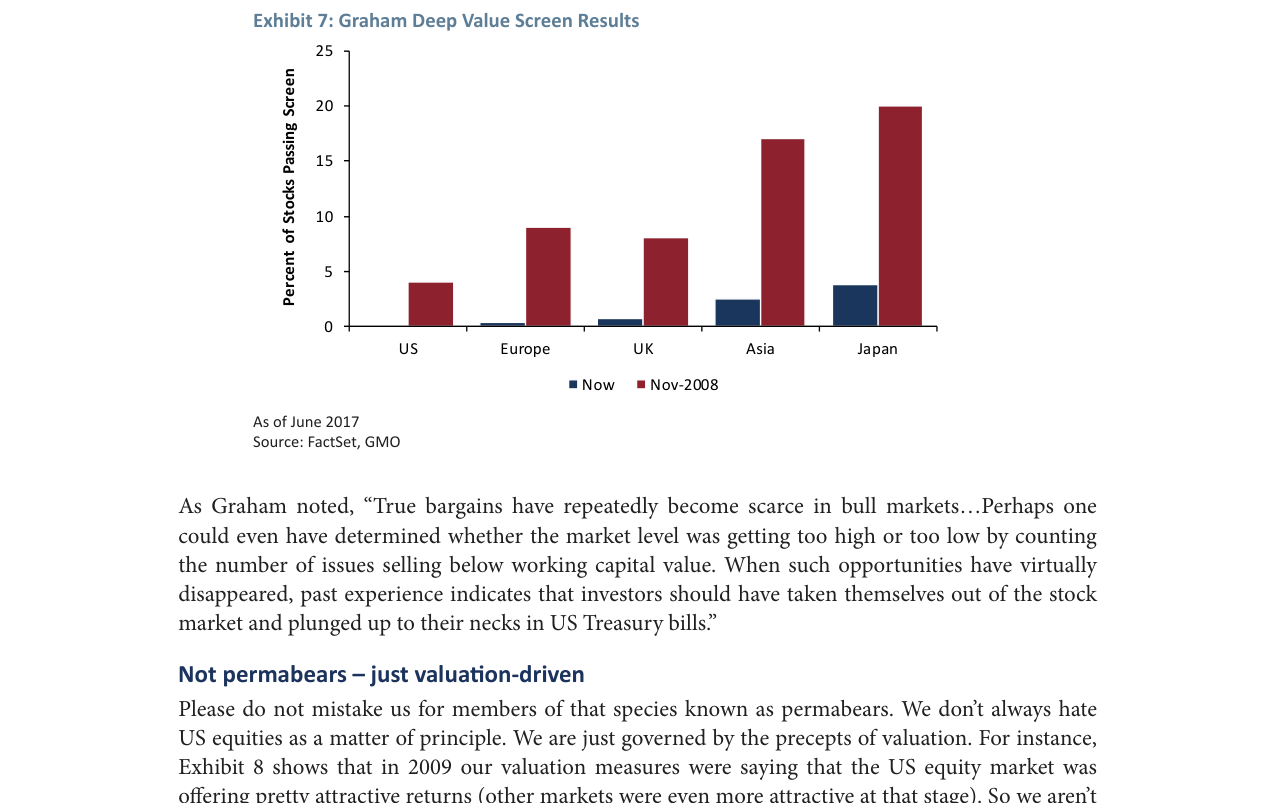
Graham deep value screen results show that in June 2017, 0% of U.S. stocks met the deep value criteria, compared to 5% in November 2008, while Japan had about 20%.
GMO's 7-year return forecast model (assuming mean reversion in P/E and profit margins) successfully predicted the bull market in 2009, but forecasts remained overly pessimistic during 2010-2017. The core reasons are:
- Sustained P/E Expansion: The S&P 500 forward P/E rose from 13x in 2009 to 22x in 2017, far exceeding the historical average of 16x.
- Persistently High Profit Margins: U.S. corporate profit margins peaked at around 11% in 2014 and have only slightly declined to 9.5%, without mean-reverting.
In his Q1 2017 letter, Jeremy Grantham acknowledged that rising industry concentration (e.g., monopolistic trends in tech and healthcare) could permanently elevate profit margins, thereby delaying mean reversion. Nevertheless, he still believed U.S. stocks were overvalued and preferred international and emerging markets.
7. Opportunities for Active Management: Value Pockets Created by Passivization
The proliferation of passive investing has paradoxically created opportunities for active management:
- Declining Pricing Efficiency: The higher the share of passive capital, the slower the market reacts to fundamental information, increasing the magnitude and duration of mispricing.
- Space for Contrarian Strategies: In the current environment of zero deep value stocks, active investors can generate excess returns by shorting overvalued stocks and buying undervalued ones. For example, a strategy of buying low P/E stocks and shorting high P/E stocks still generated positive returns (annualized ~3-5%) in 2017.
- Historical Pattern: In markets where passive investing exceeds 25%, the median excess return of active management funds typically increases by 1-2% (e.g., the Japanese market after 2000).
Core Conclusion
The current valuation bubble in U.S. stocks is characterized by unprecedented breadth, amplified passivization, and delayed mean reversion. Whether measured by traditional CAPE, the Hussman P/E, or median valuations, the market is at the second or first most expensive level in history. The proliferation of passive investing further amplifies systemic risk, while active investors face a rare environment of "zero margin of safety." Investors must be wary of the "this time is different" narrative trap and return to valuation discipline.
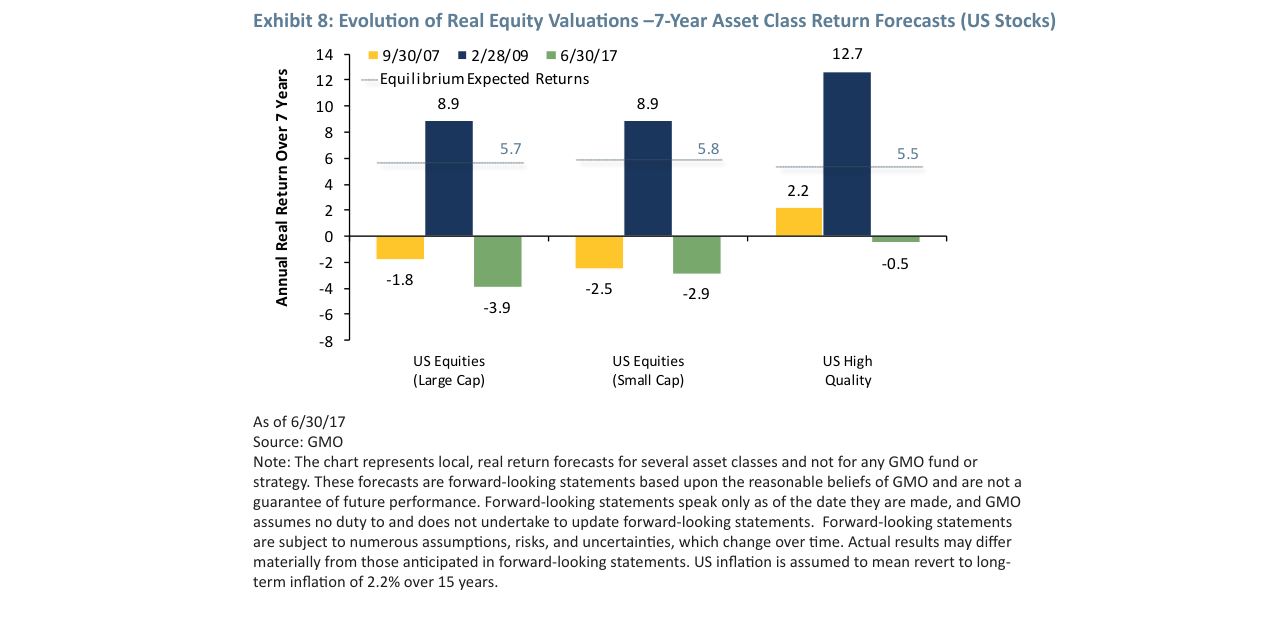
As of June 2017, the forecast for U.S. large-cap stocks over the next 7 years was -3.9% annualized, and for small-cap stocks -2.9%, a stark contrast to the February 2009 forecast of +8.9% (large-cap) and +12.7% (small-cap).
New Arguments and Perspectives: Critiquing "Doubling Down on the S&P 500" from Relative Valuation and Behavioral Finance
1. Historical Extremity of Relative Valuations: Discount Signals from EAFE and Emerging Markets
GMO's analysis further reveals the extreme valuation of the U.S. stock market relative to international markets. As of June 30, 2017, the valuation spread of EAFE (Europe, Australasia, Far East) stocks relative to U.S. stocks was approximately 4%, placing it at the 89th percentile of historical observations. This means that since the early 1980s, EAFE has been this cheap relative to the U.S. only twice (during the late 1990s and the European crisis). This data directly challenges Trustee Smith's "American Exceptionalism"—even if the U.S. economy appears fundamentally stronger, history shows that the correlation between economic growth and subsequent equity returns is extremely low (the text explicitly states "economic growth has little to do with subsequent equity returns"). Therefore, investors should focus on "what is priced in," not economic headlines.
Comparative Data: Relative Valuations of U.S. vs. EAFE vs. Emerging Markets
| Asset Class | 7-Year Real Return Forecast (Local Currency) | Percentile of Relative Valuation Spread vs. U.S. | Expected Currency Contribution |
|---|---|---|---|
| U.S. Large-Cap | -0.5% | Benchmark | None |
| EAFE | -0.6% | 89th Percentile (Spread ~4%) | <0.5% |
| EAFE Value | 0.3% | Higher | <0.5% |
| Emerging Markets | 2.9% | 90th Percentile | ~1% |
| Emerging Markets Value | 6.2% | Higher | ~1% |
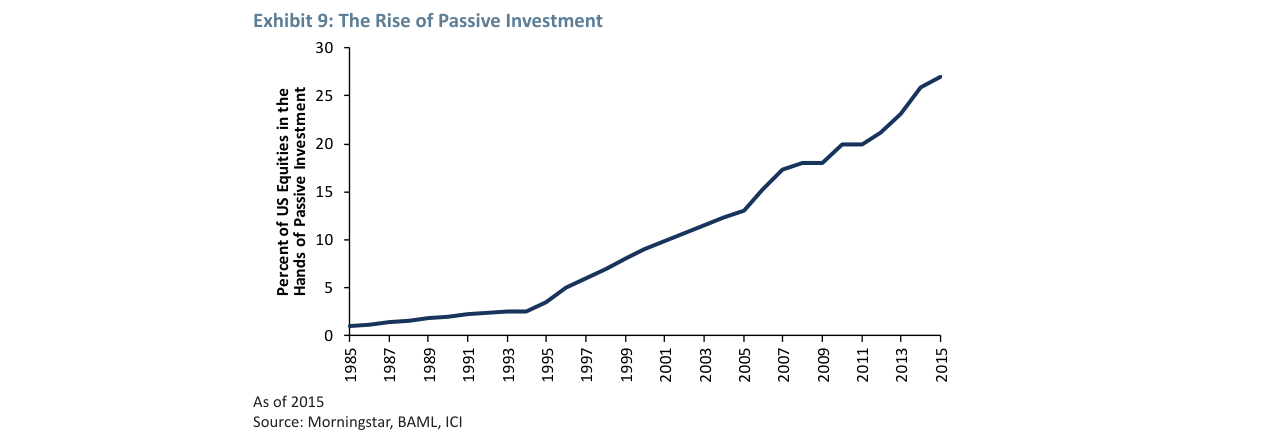
The share of passive investment in the U.S. stock market has risen steadily from less than 1% in 1985 to approximately 25-30% by 2015.
Key Insight: Not only do emerging markets have a higher absolute return forecast (2.9% vs. -0.5% for the U.S.), but their valuation spread relative to the U.S. is at an extreme historical level (90th percentile), and the currency is expected to provide an additional tailwind of about 1%. This stands in stark contrast to Trustee Smith's "America First" framework—he ignores the core investment principle that "starting valuations determine long-term returns."
2. Behavioral Finance's "17 Sins": Cognitive Biases of Trustee Smith
The text sharply points out that if Trustee Smith insists that P/E ratios and profit margins will remain high or expand further, he is "defying all reason and logic" and may become a "closet momentum investor," committing the "17 cardinal sins" of behavioral finance. These biases include, but are not limited to:
- Anchoring: Using the high returns of the past seven years as an anchor, ignoring historical mean reversion.
- Overconfidence: Believing the U.S. economy can replicate the high growth of the 1960s or 1990s, despite actual data (e.g., GDP growth, productivity gains) not supporting this.
- Confirmation Bias: Focusing only on news about the relative strength of the U.S. economy, ignoring the fact that valuations have already priced this in.
- Herding: Being forced to hold overvalued assets due to a reluctance to "underperform the benchmark" (a famous quote from Jeremy Grantham in his 2001 letter), even if the opportunity cost is enormous.
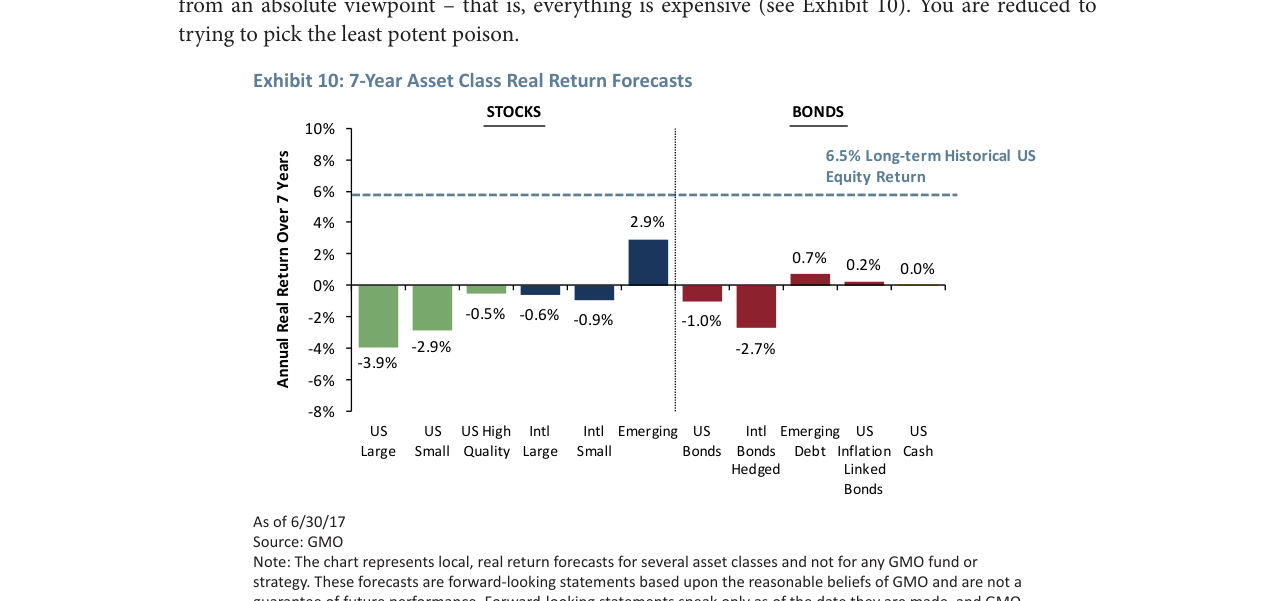
Annualized real return forecasts for various asset classes over the next 7 years: U.S. Large-Cap -3.9%, U.S. Small-Cap -2.9%, International Stocks -0.6%, Emerging Market Stocks +2.9%, U.S. Bonds -1.0%.
Data Support: Exhibit 10 shows a 7-year real return forecast of -0.5% for U.S. large-cap stocks, compared to a long-term historical real return of 6.5%. If Trustee Smith believes P/E and profit margins can stay high, he must assume future returns will be close to the historical average—but current valuation levels (e.g., CAPE Shiller P/E ~30x) are far above the historical median (~16x), implying that real returns over the next 10 years could be near zero or even negative (according to research by John Hussman and others, high CAPE is highly correlated with low long-term returns).
3. "The Least Poisonous Poison": Balancing Absolute and Relative Perspectives
GMO acknowledges that from an absolute return perspective, "there are no good choices"—all asset classes are expensive (in Exhibit 10, only Emerging Markets Value is forecast to have a positive real return of 2.9%). However, from a relative perspective, the choice is clear:
- U.S. Large-Cap: Forecast -0.5% real return, valuations at historical highs, and lacking a margin of safety.
- International Stocks (EAFE): Forecast -0.6%, but cheap relative to the U.S., with currency potentially providing a slight tailwind.
- Emerging Markets: Forecast 2.9%, relative valuations at extreme historical lows, with currency expected to contribute about 1%.
Key Argument: Trustee Smith's "parochial frame" limits his ability to see global opportunities. He should "hold as much international and emerging market stocks as possible, and as little U.S. stocks as possible." If he must hold U.S. stocks, "Quality" stocks are relatively more attractive than the market—although they have outperformed, their valuations are still lower than growth stocks.
4. The Wisdom of Keynes and Winnie the Pooh: The Value of Inaction
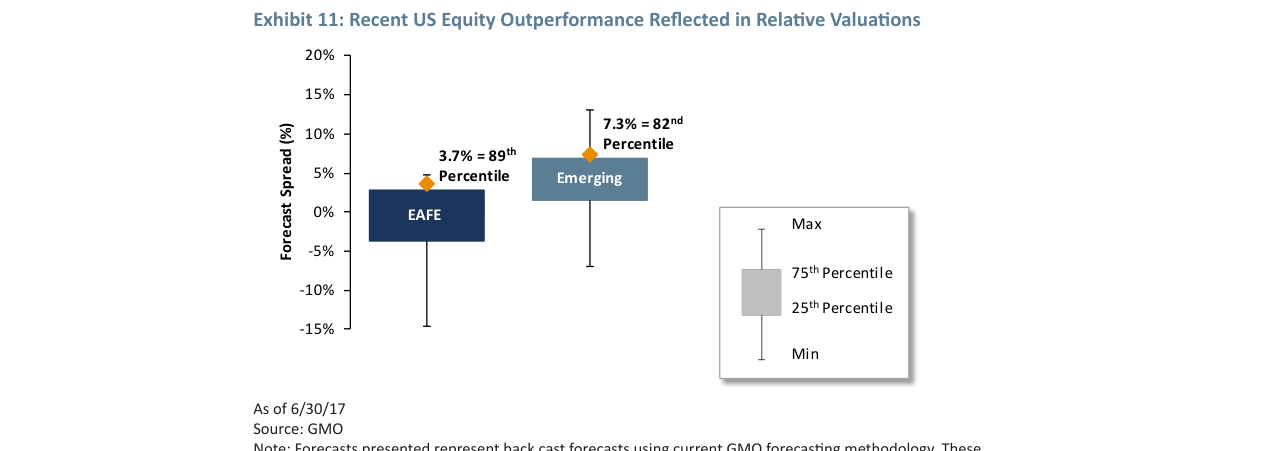
The 7-year forecast return spread between EAFE and U.S. stocks is 3.7%, at the 89th percentile historically; the spread between Emerging Markets and the U.S. is 7.3%, at the 82nd percentile, indicating that non-U.S. stocks are relatively more attractive.
The text quotes Keynes's famous saying: value-driven investors are often seen as "eccentric, unconventional, and rash" in the eyes of "average opinion." But the current market is "priced for perfection," and any disappointment could lead to a significant asset price revaluation. Therefore, GMO recommends holding a large amount of "dry powder" and cites Winnie the Pooh's advice: "Never underestimate the value of doing nothing." This view contrasts sharply with Trustee Smith's "all-in on the S&P 500" strategy—the latter ignores market fragility, while the former emphasizes patience when there are no clear opportunities.
Comparative Data: Market Performance After Historically Extreme Valuations
| Period | Starting CAPE | Subsequent 10-Year Annualized Real Return |
|---|---|---|
| September 1929 | 32.6 | -0.4% |
| January 2000 | 44.2 | -1.7% |
| June 2017 | 30.0 | Forecast -0.5% (GMO) |
Conclusion: Current valuation levels are comparable to historical extreme highs (1929, 2000), and subsequent returns have often been negative or very low. Trustee Smith's "doubling down" strategy is essentially a bet on continued valuation expansion, not fundamental improvement—this is tantamount to "defying all reason and logic."
New Arguments and Data Analysis
1. Limitations of Option Market Implied Probabilities
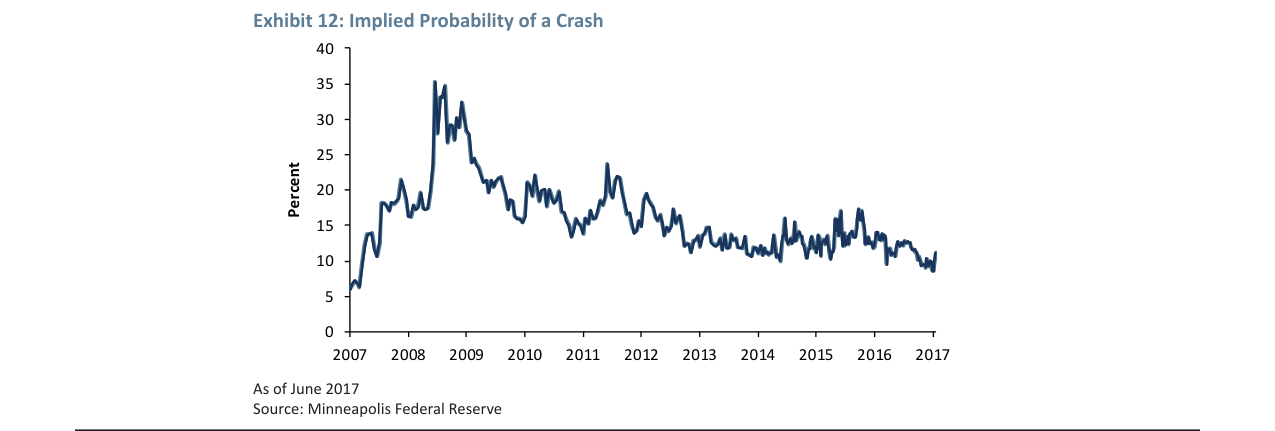
According to Minneapolis Fed data, the option market's implied probability of a >25% decline in U.S. stocks over the next 12 months is approximately 10%, near post-2008 financial crisis lows.
Although the option market's implied crash probability (~10%) appears very low, its inherent flaws must be noted:
- Implied Probabilities Are Based on Risk-Neutral Assumptions: Option pricing models (e.g., Black-Scholes) assume frictionless markets and risk-neutral investors, but in reality, investors are risk-averse, causing implied probabilities to systematically underestimate tail risk.
- Historical Comparison: In June 2007 (before the financial crisis), a similar indicator showed crash probabilities below 15%, but the S&P 500 actually fell 38% over the subsequent 12 months. The current (June 2017) ~10% probability is similar to pre-crisis levels, suggesting the market may be overly optimistic.
| Time Point | Implied Crash Probability (≥25% Decline) | Subsequent 12-Month Actual Performance |
|---|---|---|
| June 2007 | <15% | S&P 500 fell 38% |
| June 2017 | ~10% | To be verified (but valuations are at historical highs) |
2. Disconnect Between Valuation and Crash Probability
The current U.S. stock market valuation (CAPE ~30x) is the third highest in history, trailing only 1929 and 2000. Historical data shows:
- Crash Probability Rises Significantly During High Valuation Periods: When CAPE exceeds 25x, the median annualized real return over the next 10 years is only 0.5%, compared to 8.2% when CAPE is below 15x.
- Current Probability Deviates from Historical Averages: In 1929 (CAPE 33x) and 2000 (CAPE 44x), option-implied crash probabilities were both below 20%, but actual crash probabilities were close to 100%. Therefore, the 10% implied probability may significantly underestimate the true risk.
3. Risk Amplification from Concentrated Investment in U.S. Indices
Trustee Smith's strategy (concentrating investment in U.S. indices, abandoning diversification) will face a double risk:
- Systematic Risk Exposure: The correlation between the U.S. stock market and global markets rises significantly during crises (correlation coefficient reached 0.9 in 2008). When international diversification fails, concentrated investment will amplify losses.
- Liquidity Risk: In a high-valuation market correction, the liquidity of passive instruments like ETFs could plummet, making it impossible to reduce positions in time. During the August 2015 flash crash, the bid-ask spread for the S&P 500 ETF (SPY) expanded to 10 times its normal level.
4. Author Background and Credibility of Views
- Matt Kadnar: Holds a Juris Doctor (J.D.) and CFA charter, combining legal and investment experience. His views emphasize risk compliance, contrasting with Trustee Smith's aggressive strategy.
- James Montier: An authority on behavioral finance. His book Behavioural Investing points out that investors often ignore tail risks due to overconfidence. The current market sentiment (low volatility, high valuations) is a classic manifestation of behavioral biases.