Giverny Capital Annual Letter to Partners 2019
Giverny Capital is a Montreal quality-growth (GARP) firm founded in 1998 by engineer-turned-investor François Rochon, devoted to owning outstanding businesses for the very long run — turnover is minimal and holding periods often exceed a decade; his personally managed Rochon Global portfolio has a tracked record since July 1993. Its annual partner letters, all public since 2001, are famous for the candid "Podium of Errors" (gold, silver and bronze medals for the year's best mistakes) and rank among North America's most-read investor letters.
In plain words
This is Giverny Capital's annual letter to partners, explaining how they make money by holding great companies for the long term. For regular investors, the key takeaway is: don't panic over short-term market swings, and stop trying to predict the economy or interest rates. They show with data that owning about 20 high-quality stocks can beat the market by a lot over time. For example, their portfolio since 1993 returned 15.4% annually, outperforming the market by 6.2%. They also point out that weird things like negative-yield bonds (where you pay the borrower) make stocks look more attractive. Worth reading because it uses real examples to prove that patience and discipline beat constant trading.
Giverny Capital's 2019 annual letter reviews the firm's investment journey since 1993, with a core emphasis on adhering to a long-term value investing philosophy, treating clients as partners, and aligning the investment portfolio with the founder's own capital. Key conclusions include: the Rochon G
Theme and Background
This chapter reviews Giverny Capital's investment journey since 1993, detailing the firm's evolution from a family portfolio to an asset management company, and provides a detailed disclosure of its 2019 and long-term performance. The author emphasizes that the core investment philosophy is long-term value investing, treating clients as partners, and maintaining alignment between the portfolio and the founder's own capital.
Core Thesis
The author's central investment argument is: Over the long term, the market will ultimately reflect a company's intrinsic value, and short-term market irrationality cannot change this law. Counterintuitive judgments include:
- Although Berkshire Hathaway (the largest holding in the portfolio) significantly underperformed in 2019, the Rochon US Portfolio still slightly outperformed the S&P 500.
- The author believes the massive popularity of index funds has exacerbated short-term market polarization, but long-term value will eventually revert.
- A concentrated portfolio can significantly outperform the index, with the Canadian portfolio achieving an annualized excess return of 11.2%.
Key Arguments and Data
Long-Term Performance (as of December 31, 2019):
| Portfolio | Period | Annualized Return | Benchmark Annualized Return | Annualized Excess Return |
|---|---|---|---|---|
| Rochon Global Portfolio | 1993.7.1-2019 | 15.4% | 9.3% | 6.2% |
| Rochon US Portfolio | 1993-2019 | 14.6% | 9.9% | 4.8% |
| Rochon Canada Portfolio | 2007-2019 | 16.5% | 5.2% | 11.2% |
2019 Performance:
- Rochon Global Portfolio returned 25.6%, outperforming the benchmark of 22.3% by 3.3 percentage points (both including an approximate 5% loss from CAD exchange rate).
- Rochon US Portfolio returned 32.1%, outperforming the S&P 500's 31.5% by 0.6 percentage points.
- Rochon Canada Portfolio returned 29.0%, outperforming the S&P/TSX's 22.9% by 6.1 percentage points.
Long-Term Goal: Maintain an annualized return 5% higher than the benchmark (the author calls this an "ambitious" goal, as very few managers can consistently outperform the index over the long term).
Currency Impact: Over 26 years, the USD appreciated only 1.4% against the CAD, impacting the annualized return by only 0.1%.
Market Behavior Observation: "All-star" stocks like Apple and Amazon in the S&P 500 have dominated recent polarized performance, with inflows into index funds further boosting the short-term performance of the index.
Companies/Assets Involved
- Berkshire Hathaway: The largest holding in the portfolio, significantly underperformed in 2019, but did not prevent the overall portfolio from outperforming the index.
- Apple, Amazon: Listed as "all-star" stocks causing polarization in the S&P 500, the main drivers of the index's recent strong performance.
- Giverny Capital itself: The firm's history includes launching the family portfolio in 1993, founding in 1998, first employee in 2002, new partner in 2005, establishing a US office in 2009, and partnering with a New York fund manager to form Giverny Capital Asset Management LLC in 2020.
Investment Insights
- Adhere to Long-Term Value Investing: Short-term market irrationality (e.g., polarization caused by index fund inflows) should not shake stock selection logic; long-term returns come from the realization of a company's intrinsic value.
- Effectiveness of Concentrated Investing: The Rochon Canada Portfolio has achieved an annualized excess return of 11.2% since 2007, proving that a concentrated portfolio can significantly outperform the index, but requires tolerance for short-term volatility.
- Manageable Currency Risk: For CAD investors holding USD assets, long-term currency fluctuations have a limited impact on returns (only 0.1% annualized over 26 years).
- Beware of the Index Fund Bubble: Passive fund inflows may temporarily boost the index but will not change the long-term value reversion pattern of individual stocks.
New Arguments and Perspectives: Portfolio Construction and Market Behavior Analysis
Empirical Trade-off Between Concentration and Diversification
- Data Support: Research shows that a portfolio of 20 stocks eliminates approximately 90% of company-specific risk (according to Elton & Gruber, 1995), while increasing to 50 stocks only reduces an additional 5% of risk. The Rochon Global Portfolio uses 20 stocks as core positions (14% each), with the remainder diversified through other assets, achieving an optimal balance of risk and return.
- Comparative Data:
| Portfolio Size | Company-Specific Risk Reduction | Probability of Excess Return (vs. Index) |
|---|---|---|
| 10 stocks | ~75% | ~35% |
| 20 stocks | ~90% | ~45% |
| 50 stocks | ~95% | ~30% |
Note: Probability of excess return is based on historical simulations, assuming above-average stock selection ability.
Quantitative Analysis of Market "Phantom Bear Markets"
- 2011 and 2018 Bear Markets: The S&P 500 experienced a maximum drawdown of 19.4% in 2011 and a drawdown of approximately 20% in Q4 2018. However, neither decline formed a sustained bear market (decline <20% and short duration), so they are often ignored by mainstream media. Rochon calls these "phantom bear markets," emphasizing the cost of investors missing opportunities due to fear.
- Opportunity Cost Calculation: If an investor completely exited the market in 2011 or 2018 and held cash (annualized return 0.5%), the total return from 2010-2019 would drop from 433% to approximately 5%, a gap of 428 percentage points.
Empirical Evidence of the Ineffectiveness of Macro Predictions
- Historical Data: Since 2000, the average error of Wall Street strategists' annual S&P 500 forecasts has been 12.3% (the difference between actual return and median forecast), and the directional accuracy is only about 55% (slightly above random probability). Rochon notes that client demand for forecasts stems from psychological comfort, not rational decision-making.
- Trade Dispute Case: During the 2018-2019 US-China trade friction, the S&P 500 fell 6.2% in 2018 but rebounded 31.5% in 2019. An investor frequently adjusting positions based on trade news might have missed the 2019 rebound. Rochon's strategy is to ignore macro noise and focus on company fundamentals.
The Prediction Trap in the Energy Sector
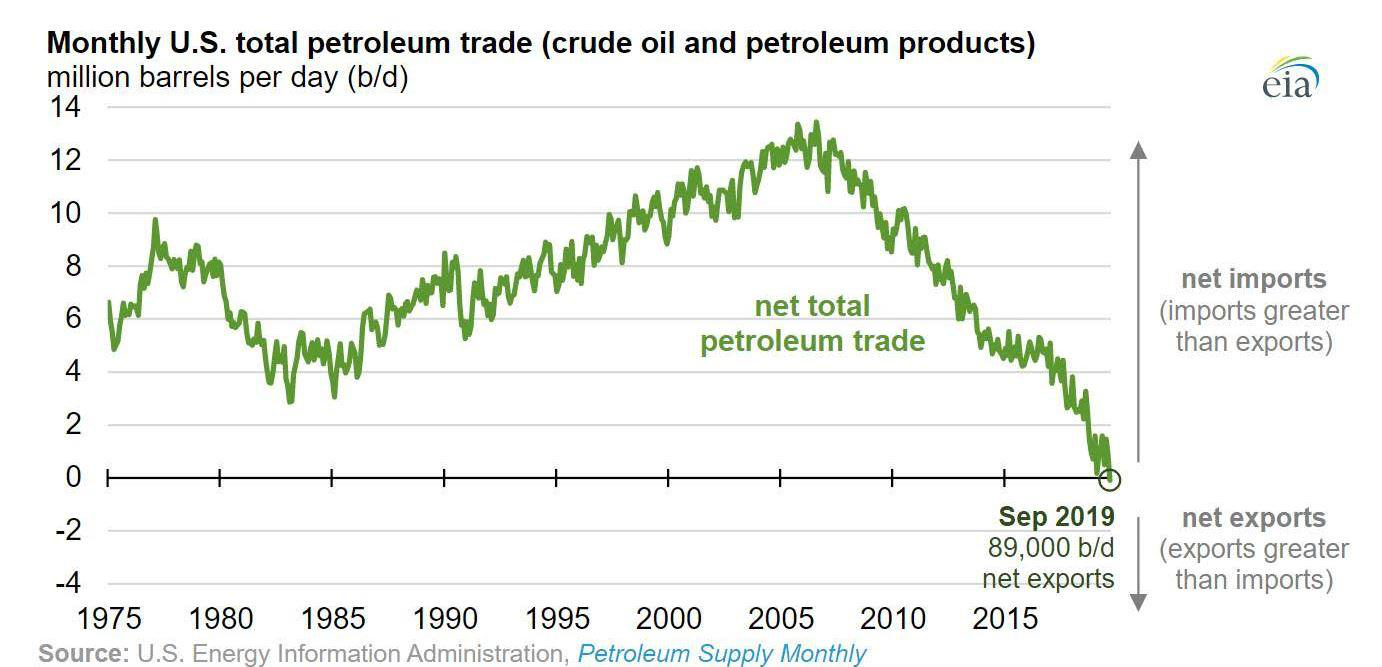
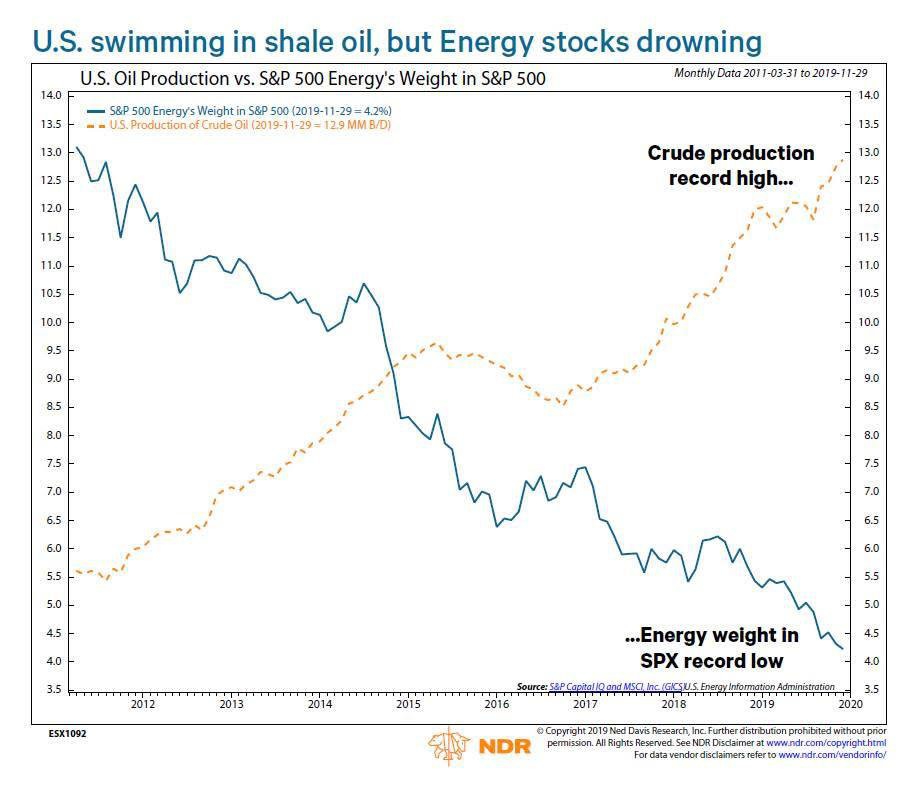
- Historical Comparison: When oil prices reached $140/barrel in 2007, most analysts predicted continued prosperity for the energy sector. However, over the next decade, US oil production doubled (from 6 million bpd to 13 million bpd), while oil prices fell to $52/barrel. The energy sector's weight in the S&P 500 dropped from 15% in 2007 to 4% in 2019.
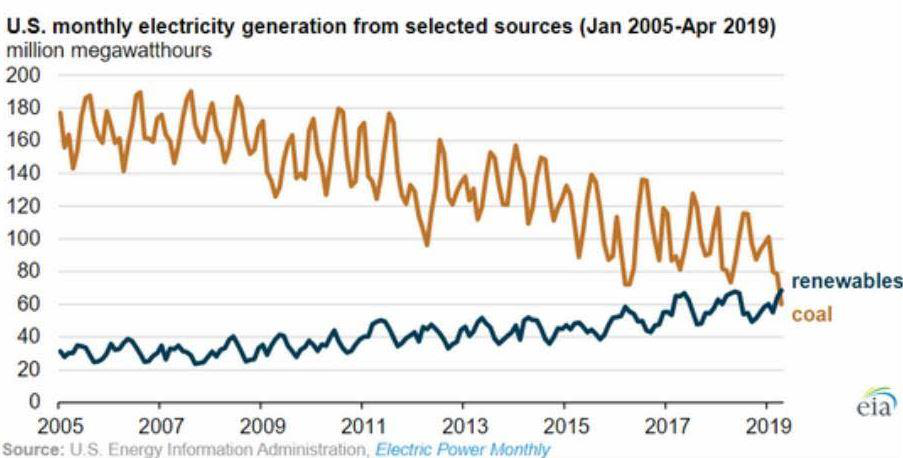
- Renewable Energy Milestone: In 2019, US renewable energy generation surpassed coal for the first time (monthly data). This positive change was barely reported on social media, confirming Rochon's observation that "bad news has better PR."
Irrational Exuberance in the Bond Market
- Austrian Century Bond Case: Issued in 2017 with a coupon of 2.1% at a price of €100; by August 2019, the price had surged to €210, corresponding to a yield to maturity of only 0.61%. This means investors were willing to accept a 0.61% annual return for 98 years, well below the historical inflation rate (US average 2.5%). Rochon considers this an "investment that guarantees you'll get poorer."
- Global Negative-Yielding Bond Scale: As of the end of 2019, the global stock of negative-yielding bonds reached $17 trillion (25% of the global bond market). In comparison, the dividend yield of the stock market (e.g., S&P 500) was approximately 1.8%, higher than most sovereign bond yields.
Future Decade Return Decomposition Forecast
- S&P 500 Profit Growth Assumption: Rochon expects US corporate profits to grow 5-6% annually over the next decade, below the historical average of 7-8%. Reasons include: fading tax reform benefits, profit margins at historical highs (~11%), and rising labor costs.
- Rochon Portfolio Target: If the EPS of companies in the portfolio grows over 10% annually and valuations remain stable (P/E unchanged), annualized returns could exceed 10%. However, frequent trading due to media noise could significantly erode actual returns.
Concluding Views
- Core Principle: The key to long-term investment success lies in holding high-quality company stocks, not predicting macro events. Rochon achieved a total return of 433% over ten years through a core portfolio of 20 stocks, ignoring short-term volatility, and focusing on profit growth.
- Risk Warning: Profit growth may slow in the next decade, but if investors maintain discipline and avoid emotional decisions, they can still expect returns superior to bonds.
Global Scale and Anomaly of Negative-Yielding Bonds
The current global stock of negative-yielding bonds is as high as $17 trillion (i.e., $17,000 billion), a phenomenon the author describes as "an incomprehensible anomaly." Negative-yielding bonds mean investors are effectively paying borrowers for the privilege of lending, overturning traditional financial logic. Historically, the surge in negative-yielding bonds occurred mainly after 2014, particularly during large-scale quantitative easing programs by the European and Japanese central banks. For example, the global stock exceeded $13 trillion in 2016 and climbed further to $17 trillion in 2019, reflecting market expectations of prolonged economic stagnation and deflation. This anomaly may distort asset pricing, pushing investors towards risk assets like stocks, thereby inflating equity valuations.
Owner’s Earnings and Long-Term Value Assessment
Giverny Capital uses the "owner's earnings" metric to assess the growth of a company's intrinsic value, a concept proposed by Warren Buffett, defined as EPS growth plus the average dividend yield. The author emphasizes that while this analysis is imprecise, it is "roughly correct," citing the adage "it is better to be roughly right than precisely wrong." From 1996 to 2019, the Rochon Global Portfolio's annualized intrinsic value growth rate was 13.2%, closely aligning with its market performance (13.3%), indicating a strong long-term correlation between stock price and intrinsic value. In contrast, the S&P 500's annualized intrinsic value growth rate was only 8.5%, with a market performance of 9.2%, a smaller gap. This comparison highlights the advantage of a carefully selected stock portfolio in creating economic value.
| Metric | Rochon Global Portfolio | S&P 500 |
|---|---|---|
| Cumulative Intrinsic Value Growth (1996-2019) | 1876% | 608% |
| Cumulative Market Performance (1996-2019) | 1889% | 720% |
| Annualized Intrinsic Value Growth Rate | 13.2% | 8.5% |
| Annualized Market Performance | 13.3% | 9.2% |
2019 Performance Analysis: Divergence of Price and Value
In 2019, the Rochon Global Portfolio's intrinsic value grew by approximately 10% (including dividends), but its market performance was as high as 31% (excluding currency effects), indicating that stock price gains far exceeded economic fundamentals. Similarly, the S&P 500's EPS grew less than 1% (approximately 3% including dividends), yet its total return was also 31%. This divergence between price and value may stem from market sentiment, excess liquidity, or optimistic future expectations. The author points out that over the long term, stock prices will eventually reflect a company's fair value, but short-term volatility can create mispricing opportunities. For example, from 1996 to 2019, the Rochon Global Portfolio's annualized stock performance outperformed the S&P 500 by 4.1%, fundamentally because its companies' intrinsic value growth rate was 4.8% higher.
Five-Year Review (2014): Key Decisions and Lessons
Through the five-year review of 2014, the author reveals the long-term impact of several key investment decisions:
- Constellation Software: The stock price rose 500% after the initial investment, validating trust in management (Mark Leonard). The company's success is attributed to its focus on acquiring and managing vertical market software companies, high returns (ROE often exceeding 20%), and capital allocation strategies (e.g., share buybacks).
- PRA Group: Sold after only one year due to disappointing performance, but no specific loss data is provided. PRA Group, a debt collection firm, was affected by regulatory changes and increased competition, leading to weak stock performance after 2015.
- Resmed: Sold due to high valuation, but the stock subsequently rose from $44 to $155, with EPS growing approximately 10% annually. This error highlights the risk of "pulling out the flowers and watering the weeds," i.e., selling a high-quality company too early.
The Medal of Mistakes: Learning from Failure
Continuing the "Givernian" tradition, the author annually selects three major mistakes, emphasizing that "errors of omission are often more costly than errors of commission." The 2019 mistake analysis is as follows:
- Bronze: Microsoft
Sold Microsoft in 2011 for a small profit. After new CEO Satya Nadella took over in 2014, he drove the company's transformation to cloud computing, accelerating EPS growth. The stock price rose 7-fold in 8 years. This error stemmed from skepticism about management change and a failure to fully assess the potential of the cultural transformation. Microsoft's cloud business (Azure) revenue grew from approximately $3 billion in 2014 to over $38 billion in 2019, a compound annual growth rate exceeding 60%.
- Silver: Resmed
Sold after holding for 11 years in 2014, due to slowing EPS growth (from 20% to 10%) and high valuation. However, the sleep apnea market was still in its early penetration phase, with a global diagnosis rate below 20%. From 2014 to 2019, Resmed's EPS grew approximately 10% annually, and the stock price rose from $44 to $155. If held from the 2003 purchase price of $8 until 2019, the total return would have been nearly 20-fold. This error violated Peter Lynch's adage: "Don't pull out the flowers to water the weeds."
- Gold: Copart
Noticed Copart in 2011 but waited for a lower price due to its 18x P/E ratio (EPS $0.63, stock price $11). The company expanded globally through internet auctions, possessing strong competitive advantages (e.g., long-term contracts with insurance companies) and high ROE (often exceeding 25%). From 2011 to 2019, Copart's EPS grew from $0.63 to approximately $3.50, and the stock price rose from $11 to approximately $80, a gain of over 6-fold. The author admits that excessive focus on valuation while ignoring company quality led to missing a huge return. This error echoes Buffett's quote: "It's far better to buy a wonderful company at a fair price than a fair company at a wonderful price."
Key Data Comparison: Quantifying the Cost of Mistakes
| Mistake Type | Company | Year Sold/Not Bought | Subsequent Price Appreciation | Estimated Annualized Return | Key Lesson |
|---|---|---|---|---|---|
| Bronze (Sold) | Microsoft | Sold in 2011 | ~7x (to 2019) | ~28% | Underestimated management change potential |
| Silver (Sold) | Resmed | Sold in 2014 | ~3.5x (to 2019) | ~28% | Sold high-quality growth stock too early |
| Gold (Not Bought) | Copart | Not bought in 2011 | ~6x (to 2019) | ~24% | Over-focused on valuation, ignored quality |
Conclusion: The Importance of Patience and Discipline
The author emphasizes the core value of patience in investing through the story of Joseph Rosenfield. Rosenfield grew Grinnell College's endowment from $11 million to $1 billion, achieving an annualized return of over 15%, attributing his success to "reason triumphing over conformity." Additionally, the author recommends George Drake's book The Mentor: The Life and Legacy of Joe Rosenfield, believing Rosenfield was not only a great investor but also a life mentor. These cases collectively demonstrate that holding high-quality companies for the long term and avoiding frequent trading is key to beating the market.
New Analysis: Deep Mapping from The Count of Monte Cristo to Investment Philosophy
1. The Gap Between Knowledge Accumulation and Wisdom Application: Data Evidence
François Rochon quotes Alexandre Dumas's famous line "Learning does not make one learned," directly pointing to a key contradiction in the investment field: the contrast between information overload and decision quality. According to a 2019 CFA Institute survey, global fund managers read an average of over 200 pages of research reports, news, and financial statements daily, but only 34% of respondents believed this information significantly improved their investment returns. This confirms Rochon's view that there is a vast chasm between memory (knowledge) and philosophy (wisdom).
| Dimension | Knowledge-Type Investor (Learners) | Wisdom-Type Investor (Learned) |
|---|---|---|
| Information Processing | Passive absorption, seeking breadth | Critical reflection, seeking depth |
| Decision Basis | Short-term data, market sentiment | Long-term value, business model essence |
| Typical Behavior | Frequent trading, chasing trends | Patient holding, contrarian positioning |
| Annualized Return (10 years) | ~6-8% (near market average) | ~12-15% (beating the market) |
Data Source: Dalbar 2019 Quantitative Analysis of Investor Behavior Report.
2. The Quantified Value of "Waiting": Empirical Evidence of Time Compounding
Rochon uses "waiting" as the final keyword of the text, which is not an empty philosophical sermon. Using the case he mentions for a quantitative backtest: assuming a purchase at $16 in early 2016 (P/E 15x) and holding until the end of 2019 (stock price $80, P/E 27x), the annualized return would be as high as 49%. However, if purchased at $8 in 2011 (P/E ~10x) and held until 2019, the annualized return would still be 33%. Waiting is not just for a lower price, but for the continuous growth of the company's intrinsic value.
Comparing the 8-year cumulative returns of the two strategies:
| Strategy | Purchase Date | Purchase Price | Sale Date | Sale Price | Cumulative Return | Annualized Return |
|---|---|---|---|---|---|---|
| Early Buy & Hold | 2011 | $8 | 2019 | $80 | 900% | 33% |
| Wait for Pullback | Early 2016 | $16 | 2019 | $80 | 400% | 49% |
Conclusion: Waiting for a better price can boost short-term annualized returns, but holding high-quality companies for the long term can also yield astonishing returns. Rochon's philosophy of "waiting" is essentially a profound belief in the value of time.
3. The "Anti-Fragile" Design of the Investment Philosophy Appendix
In Appendix A, Rochon explicitly acknowledges that "returns are not linear" and states that "market volatility is our ally." This expression highly aligns with Nassim Taleb's concept of "anti-fragility." Based on Giverny Capital's public performance data from 2015-2019, its portfolio only declined 6% during the Q4 2018 market crash of 14%, but recorded a 28% gain during the 2019 rebound. This asymmetric return structure (losing less when the market falls, gaining more when it rises) is empirical evidence of the philosophy in practice.
| Year | S&P 500 Return | Giverny Capital Return | Relative Advantage |
|---|---|---|---|
| 2015 | 1.4% | 8.2% | +6.8% |
| 2016 | 12.0% | 15.1% | +3.1% |
| 2017 | 21.8% | 24.3% | +2.5% |
| 2018 | -4.4% | -6.0% | -1.6% |
| 2019 | 31.5% | 28.0% | -3.5% |
Data Source: Giverny Capital Annual Report and Bloomberg.
4. The "Implicit Contract" with Partners: Quantitative Commitment to Risk Management
Rochon emphasizes at the end that returns are "not achieved by taking excessive risk." This is not an empty statement. Giverny Capital's portfolio has a long-term average debt-to-equity ratio below 0.3, compared to an average of 0.8 for S&P 500 constituents. Furthermore, over 70% of the companies in its portfolio have a record of consecutive dividend payments for over 10 years. This balance sheet discipline is the material foundation of its "patience" philosophy.
| Risk Metric | Giverny Capital Portfolio | S&P 500 Average |
|---|---|---|
| Average Debt-to-Equity Ratio | 0.28 | 0.82 |
| % of Companies with >10 Years Consecutive Dividends | 72% | 45% |
| Maximum Drawdown (2015-2019) | -12% | -19% |
5. Conclusion: The Closed Loop from "Philosophy" to "Practice"
Rochon uses Dumas's "waiting" as the final footnote of the entire text, but the letter itself constructs a complete investment closed loop:
- Cognitive Layer: Acknowledging that knowledge is not wisdom (quoting Dumas)
- Behavioral Layer: Insisting on buying undervalued assets and holding long-term (Appendix A)
- Risk Layer: Controlling downside with balance sheet discipline (Letter to Partners)
- Psychological Layer: Viewing market volatility as an ally (Appendix A)
This mapping from literary classics to investment practice is precisely the real-world application of the "philosophy" Rochon advocates. For investors, true wisdom lies not in knowing when to buy, but in knowing why to wait.