Giverny Capital Annual Letter to Partners 2017
Giverny Capital is a Montreal quality-growth (GARP) firm founded in 1998 by engineer-turned-investor François Rochon, devoted to owning outstanding businesses for the very long run — turnover is minimal and holding periods often exceed a decade; his personally managed Rochon Global portfolio has a tracked record since July 1993. Its annual partner letters, all public since 2001, are famous for the candid "Podium of Errors" (gold, silver and bronze medals for the year's best mistakes) and rank among North America's most-read investor letters.
In plain words
This is Giverny Capital's 2017 letter to partners, explaining why sticking with good companies for the long term works. Since 1993, their portfolio returned 15.7% annually, beating the market by 6.5%. They expect to underperform about one year out of three, which is normal. They also admit mistakes like selling a stock too early or skipping a great company because it seemed expensive. For regular investors, the takeaway is: don't panic over short-term ups and downs, and focus on owning solid businesses. Worth reading because 20+ years of data show patience beats cleverness.
Giverny Capital 2017 Annual Letter The Giverny Capital 2017 annual letter reviews the performance of the Rochon Global Portfolio, managed since 1993. The core thesis is a commitment to a long-term value investing philosophy, emphasizing alignment of interests with clients. In 2017, the portfolio ret
Theme and Background
This chapter is the introductory section of Giverny Capital's 2017 annual letter, primarily reviewing the firm's historical performance and investment philosophy since managing the Rochon Global Portfolio in 1993. The author emphasizes that long-term value investing is the core strategy and provides detailed return data for 2017 and since inception to demonstrate the strategy's effectiveness.
Core Thesis
The author's core investment argument is: Adhere to a long-term value investing philosophy; short-term market fluctuations are unpredictable, but the long term will reflect a company's intrinsic value. The counterintuitive judgment is that the author expects the portfolio to underperform its benchmark index in at least one out of every three years, considering this normal and acceptable, as long-term excess returns are the goal.
Key Arguments and Data
- Long-Term Performance Validation: From July 1, 1993, to the end of 2017, the Rochon Global Portfolio achieved an annualized compound growth rate of 15.7%, significantly exceeding the benchmark's 9.2%, with an annualized excess return of 6.5%.
- 2017 Performance: The portfolio returned 13.1%, outperforming the benchmark's 10.2% by 2.9 percentage points. However, the US portion (Rochon US Portfolio) returned 19.7%, underperforming the S&P 500's 21.8%, consistent with the expectation of underperforming in one out of three years.
- Outstanding Canadian Portfolio: Since 2007, the Rochon Canada Portfolio has achieved an annualized return of 17.8%, far exceeding the S&P/TSX's 5.1%, with an annualized excess return of 12.7%.
- Minimal Currency Impact: Over 24 years, the US dollar depreciated 2.1% against the Canadian dollar, impacting the annualized return by only -0.1%.

Comparative Data Table (Long-Term Performance):
| Portfolio | Period | Annualized Return | Benchmark Annualized Return | Annualized Excess Return |
|---|---|---|---|---|
| Rochon Global Portfolio | 1993.7.1 – 2017.12.31 | 15.7% | 9.2% | 6.5% |
| Rochon US Portfolio | 1993.7.1 – 2017.12.31 | 15.0% | 9.7% | 5.3% |
| Rochon Canada Portfolio | 2007 – 2017 | 17.8% | 5.1% | 12.7% |
2017 Top Five Tech Stock Performance Comparison:

| Stock | 2017 Gain |
|---|---|
| Apple | 48% |
| Microsoft | 40% |
| Amazon.com | 56% |
| 53% | |
| Alphabet | 36% |
| Average | 47% |
Companies/Assets Involved
- Apple: Gained 48% in 2017, one of the largest weightings in the S&P 500, but not in the Giverny portfolio (the author does not explicitly state a bullish or bearish view, only mentions it as market context).
- Microsoft: Gained 40%, also not in the portfolio.
- Amazon.com: Gained 56%, not in the portfolio.
- Facebook: Gained 53%, not in the portfolio.
- Alphabet: Gained 36%, the only one of the above tech stocks held by Giverny (bullish, but no specific position size given).
- Three Core Stocks in the Canadian Portfolio: The author describes them as "highest quality," all led by "outstanding CEOs," but does not disclose specific company names.
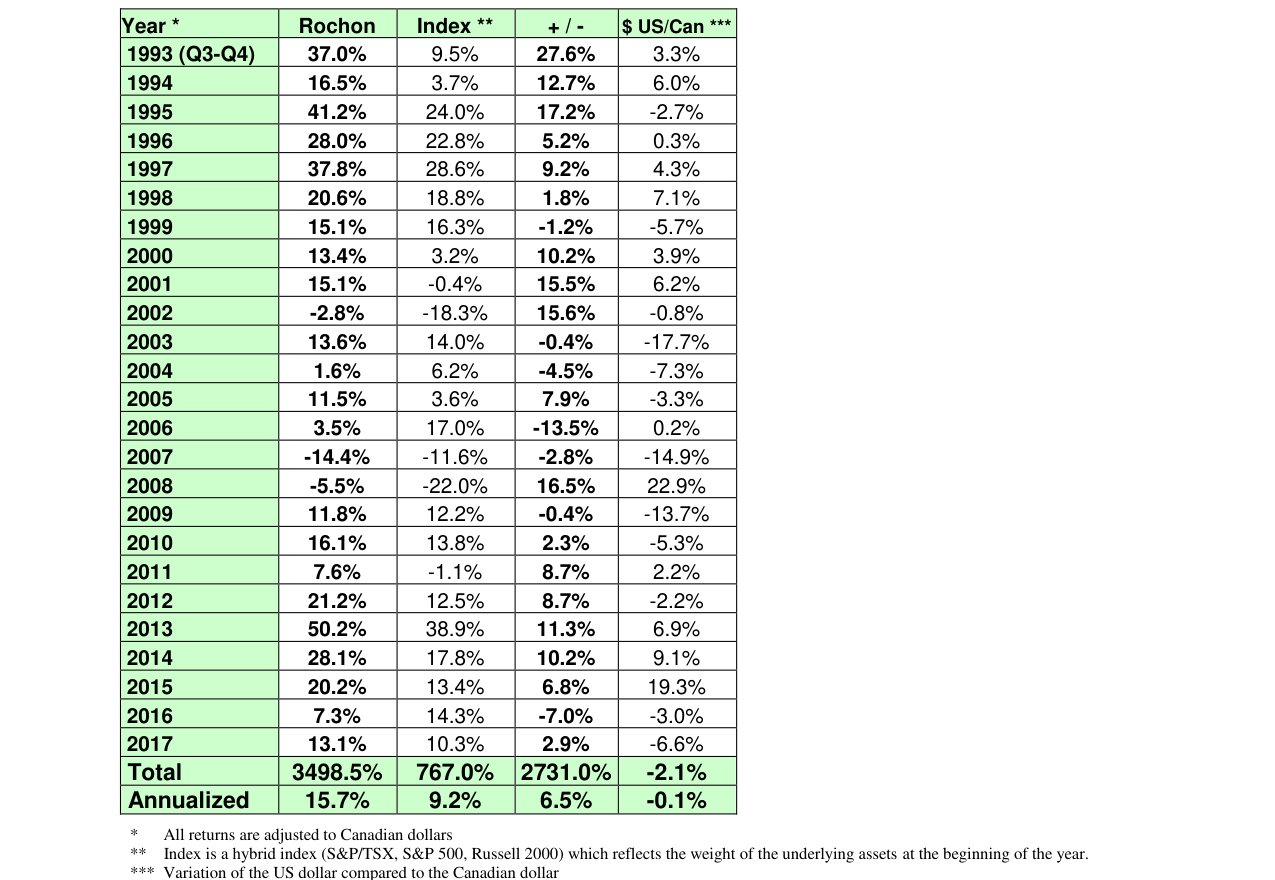
From 1993 to 2017, the Rochon Global Portfolio achieved an annualized return of 15.7%, significantly outperforming the benchmark index's 9.2%, an excess return of 6.5 percentage points.
Investment Implications
- Accept Short-Term Underperformance: Investors should expect the portfolio to underperform its benchmark in roughly one-third of the years. This is the price for long-term excess returns, and the strategy should not be altered due to short-term fluctuations.
- Concentrated but Moderately Diversified: The author believes a portfolio of about 20 stocks is the optimal balance between risk and excess returns. Over-concentration (e.g., the Canadian portion only accounting for 15% of the global portfolio) requires caution.
- Focus on Long-Term Excess Returns: Giverny's long-term goal is to outperform the benchmark by 5% annually. Historical data (6.5%) is close to this target, and investors should use this as a yardstick rather than single-year performance.
Microeconomic Impact of US Tax Reform and Market Expectations
The US tax reform not only lowered the corporate tax rate but also incentivized multinational companies to repatriate overseas profits through a repatriation provision. According to estimates by the US Joint Committee on Taxation (JCT), total overseas retained profits of US companies amount to approximately $3 trillion. Post-reform, the repatriation tax rate dropped from 35% to 15.5% (for cash-like assets) or 8% (for non-cash assets). This could lead to large-scale stock buybacks and dividend increases in 2018, further boosting S&P 500 earnings per share (EPS). Approximately 80% of the portfolio consists of US companies, and most have tax rates higher than the S&P 500 average (the S&P 500's effective tax rate in 2017 was about 18-20%, while the average effective tax rate for the US holdings was about 25-28%). Therefore, post-reform, the effective tax rate for the portfolio holdings could fall below 15%, with EPS growth potentially exceeding 20%.
Comparison of Canadian Economic Vulnerability
Canada has the highest household debt level among OECD countries, but its GDP growth is relatively moderate. The following is a comparison of key indicators:
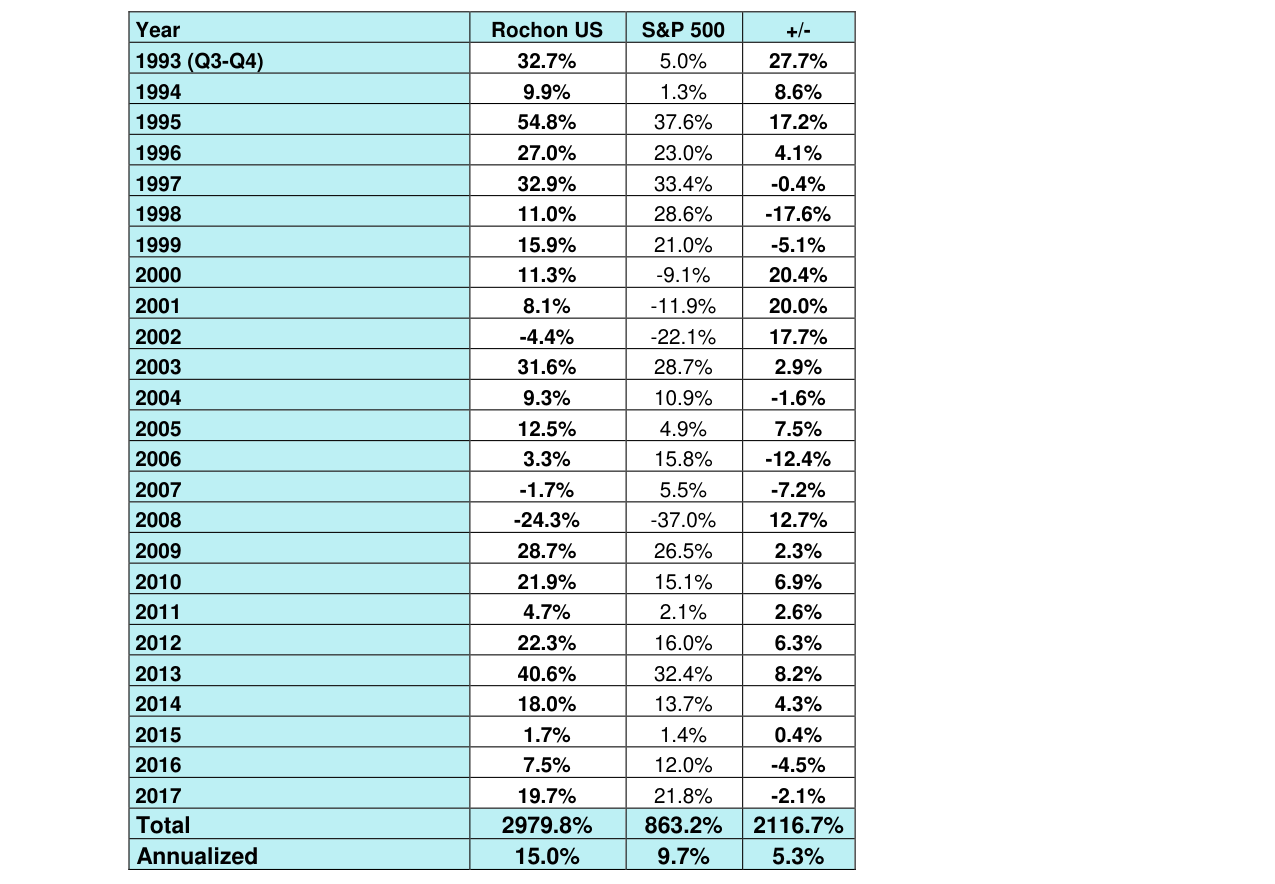
Since 1993, the Rochon US Portfolio has achieved a cumulative return of 2979.8%, an annualized return of 15.0%, with an annualized excess return of 5.3% over the S&P 500.
| Indicator | Canada | OECD Average | US |
|---|---|---|---|
| Household Debt/GDP per capita | 101% | 80% | 78% |
| 2017 GDP Growth | 3.0% | 2.4% | 2.3% |
| House Price/Income Ratio | 8.5x | 5.2x | 4.1x |
Bank of Canada data shows that the household debt service ratio (DSR) rose to 14.2% in 2017, near historical highs. If interest rates rise or housing prices correct, consumer spending could plummet, dragging down GDP. Furthermore, after the US tax reform, the gap between Canada's effective corporate tax rate (approximately 26.5%) and the US (approximately 21%) has widened, potentially leading to capital outflows. Statistics Canada data indicates that Canada's foreign direct investment (FDI) outflow to the US reached C$42 billion in 2017, a five-year high.
Investment Opportunities Post-Brexit
Although UK GDP growth is below the European average, its stock market valuations are more attractive. At the end of 2017, the FTSE 100's 12-month forward price-to-earnings (P/E) ratio was 14.5x, lower than the Euro Stoxx 50's 16.2x and the S&P 500's 18.5x. The report states that the author took advantage of market pessimism to buy two UK companies in Q3 and Q4 of 2017: one is an industrial automation company (P/E 12x, ROE 18%), and the other is a consumer goods company (P/E 13x, dividend yield 4.2%). Both companies benefit from the depreciation of the British pound (the pound depreciated about 8% against the US dollar in 2017), enhancing their export competitiveness.
Quantitative Analysis of the Bitcoin Speculative Bubble
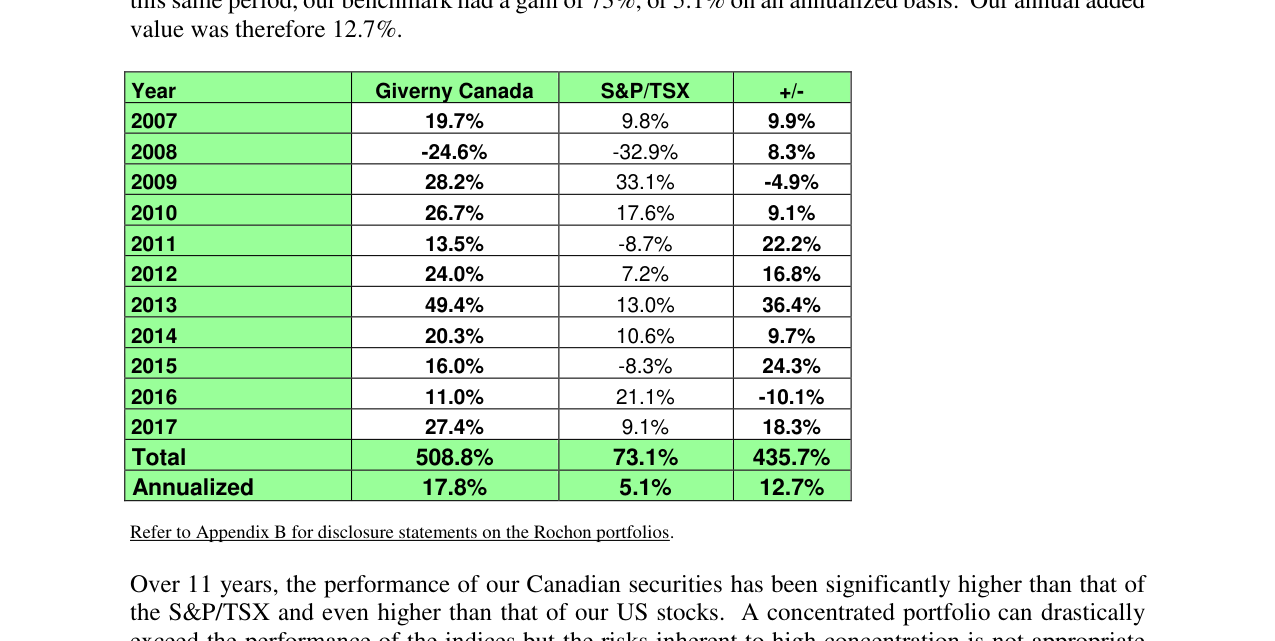
From 2007 to 2017, the Rochon Canada Portfolio achieved a cumulative return of 508.8%, an annualized return of 17.8%, with an annualized excess return of 12.7% over the S&P/TSX.
Bitcoin gained over 1300% in 2017 but exhibited extreme volatility. The following are key risk indicators:
| Indicator | Bitcoin | S&P 500 | Gold |
|---|---|---|---|
| 2017 Maximum Drawdown | -40% | -3% | -8% |
| Daily Average Volatility | 4.5% | 0.6% | 0.8% |
| Annualized Sharpe Ratio | 1.2 | 2.1 | 0.3 |
| Trading Volume/Market Cap Ratio | 0.25 | 0.01 | 0.02 |
Although Bitcoin's Sharpe ratio is high, its drawdown risk far exceeds that of traditional assets. In December 2017, after Bitcoin futures were listed on the CME, the price fell from $19,783 to $13,800 (a 30% decline), indicating a rapid exodus of speculative capital. The report states that the author insists on not participating in such assets because their intrinsic value is difficult to assess, and regulatory risks (e.g., China and South Korea banning ICOs) could erupt at any time.
Investment Return and Lessons from M&T Bank
The M&T Bank case demonstrates the value of holding high-quality companies for the long term. The following are stock price and EPS data at key points in time:
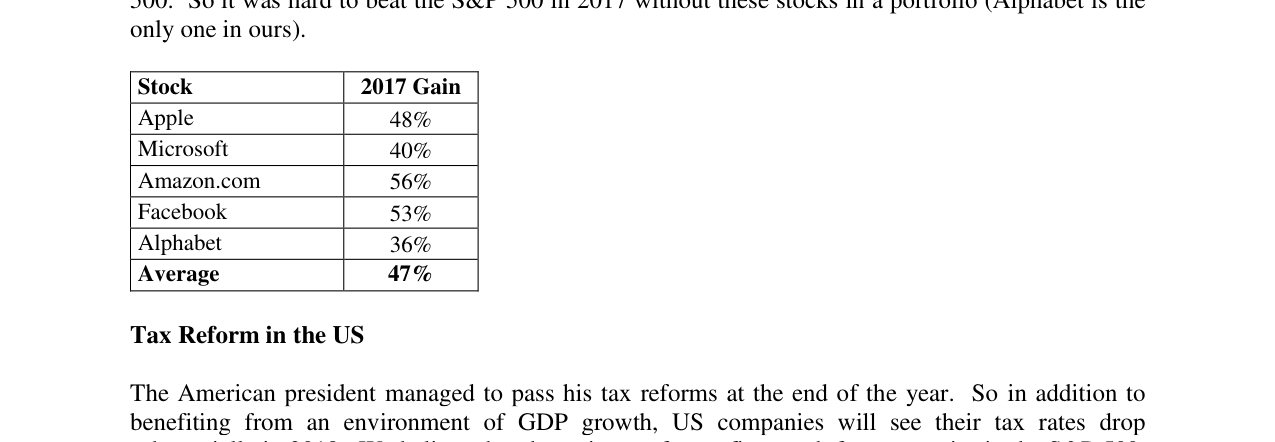
In 2017, the five major US tech giants averaged a 47% gain, with Amazon rising 56% as the best performer, while Facebook and Apple rose 53% and 48%, respectively.
| Time | Stock Price (USD) | EPS (USD) | P/E Ratio | Notes |
|---|---|---|---|---|
| Initial Purchase in 1998 | 25 | 1.80 | 13.9 | Initial position |
| Added in Early 2000 | 30 | 2.10 | 14.3 | Tech bubble period |
| Sold in 2007 | 100 | 5.50 | 18.2 | Management change |
| Bought in Feb 2009 | 36 | 2.80 | 12.9 | Post-financial crisis |
| End of 2017 | 190 | 8.20 | 23.2 | Current holding |
From 1998 to 2017, M&T's EPS grew at an average annual rate of about 8.5%, and its stock price grew at an average annual rate of about 12% (including dividends). The two purchases (1998 and 2009) were made at low valuations (P/E < 15), while the sale (2007) was due to management uncertainty. This validates the investment philosophy: buy high-quality companies at reasonable prices and remain vigilant when management changes.
2012 Investment Review: LKQ and Union Pacific
The following is a comparison of the five-year performance of two stocks bought in 2012 versus the S&P 500:

| Stock | Purchase Date | Purchase Price (USD) | End-2017 Price (USD) | Annualized Return (incl. Div.) | S&P 500 Annualized Return | Excess Return |
|---|---|---|---|---|---|---|
| LKQ | Apr 2012 | 15.0 | 40.7 | 19% | 15% | +4% |
| Union Pacific | Jul 2012 | 60.0 | 134.1 | 18% | 14% | +4% |
Both stocks outperformed the S&P 500, primarily benefiting from EPS growth (LKQ 17% annualized, UP 7%) and valuation expansion (P/E rose from 17x to 22x for LKQ, and from 15x to 23x for UP). This again proves that selecting companies with high ROE (LKQ 15%, UP 18%) and excellent management can create excess returns over the long term.
Sequel Analysis: Deepening Long-Term Value and Error Reflection
1. Performance Attribution: Intrinsic Value Growth vs. Market Valuation Expansion
The sequel reveals two different sources of investment returns through the comparison of LKQ and UP:
- LKQ: EPS grew at 17% annually (2012-2017), with stock price appreciation highly synchronized with intrinsic value growth, reflecting "value-driven" returns.
- UP: EPS grew only 7% annually, but the stock price annualized return was 18%, primarily driven by P/E expansion (similar to the S&P 500's valuation increase during the same period).

Key Data Comparison:
| Indicator | LKQ | UP | S&P 500 (Same Period) |
|---|---|---|---|
| EPS Annual Growth Rate (2012-2017) | 17% | 7% | ~6% |
| Stock Price Annualized Return | 19% | 18% | ~15% |
| Return Driver | Intrinsic Value Growth | Valuation Expansion | Primarily Valuation Expansion |
Analysis: The UP case highlights the risk of "valuation-dependent" investing. The author explicitly states that future reliance on such market revaluations will be avoided, emphasizing that long-term fundamentals (e.g., potentially significant EPS growth in 2018) are the bedrock of sustainable returns. This aligns with Buffett's principle: "Price is what you pay. Value is what you get."
2. The "Owner's Earnings" Framework: A Quantitative Tool for Long-Term Value
The sequel introduces the concept of "Owner's Earnings," proposed by Buffett, as a proxy for measuring intrinsic value growth. Giverny Capital simplifies it to: EPS Growth Rate + Average Dividend Yield.

The five-year annualized returns for LKQ and Union Pacific were 19% and 18%, respectively, outperforming the S&P 500 by approximately 4 and 3 percentage points.
2017 Data:
- Portfolio Intrinsic Value Growth: 14% (EPS growth 13% + dividend yield 1%)
- Portfolio Market Return: 20% (after currency effects)
- S&P 500 Intrinsic Value Growth: 12% (EPS growth + dividend yield ~14%)
- S&P 500 Total Return: 22% (USD)
22-Year Long-Term Performance (1996-2017):
| Indicator | Giverny Portfolio | S&P 500 |
|---|---|---|
| Cumulative Intrinsic Value Growth | 1391% | 365% |
| Cumulative Market Return Growth | 1544% | 552% |
| Annualized Intrinsic Value Growth Rate | 13.1% | 7.2% |
| Annualized Market Return Growth Rate | 13.6% | 8.9% |
| Annualized Excess Return | 0.5% (Market vs Intrinsic) | 1.7% (Market vs Intrinsic) |
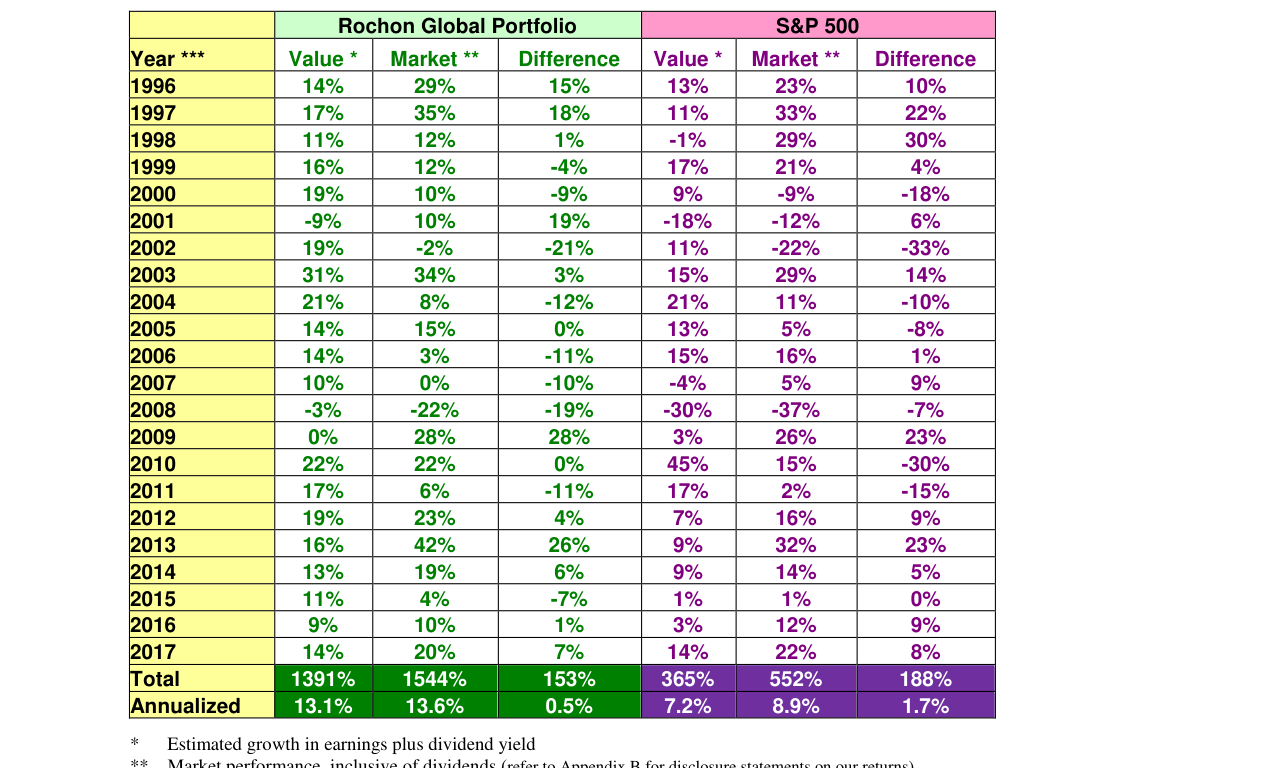
From 1996 to 2017, the intrinsic value of the Rochon Global Portfolio grew cumulatively by 1391%, with an annualized growth rate of 13.1%, roughly equivalent to the S&P 500's 13.6%.
Key Insights:
- Over the long term, the portfolio's market return (13.6%) is highly correlated with its intrinsic value growth (13.1%), validating the assumption that "the market reflects fair value over the long run."
- The core reason for the portfolio outperforming the S&P 500: The annualized intrinsic value growth rate is 5.9 percentage points higher (13.1% vs 7.2%). This directly refutes the "efficient market" theory, emphasizing that stock selection skill (rather than luck) is the source of excess returns.
3. Error Reflection: Practical Cases of Behavioral Finance
The "Error Podium" section of the sequel provides three typical cases of behavioral biases:
| Error Type | Case | Behavioral Bias | Quantitative Consequence |
|---|---|---|---|
| Error of Omission (Not Buying) | Intuit (1995-present) | Anchoring (deeming 30x PE too expensive), excessive caution | Missed 3200% gain (17% annualized) |
| Premature Sale | Knight Transportation (2017) | Impatience, misjudgment of opportunity cost | Stock rose 50% after sale, EPS expected to grow 58% |
| Long-Term Neglect | FactSet Research (1998-present) | Surface bias (old-school style vs internet craze), insufficient research | Not quantified, but company consistently profitable with growing market share |

Analysis:
- Intuit Case: The author admits to being "inexperienced," and the judgment that Microsoft's acquisition price (30x PE) was "expensive" is a classic anchoring effect—ignoring the company's future growth potential (Quickbook, etc.). This echoes Charlie Munger's famous quote: "The big money is not in the buying and selling... but in the waiting."
- Knight Transportation Case: After the sale, the company acquired Swift Transportation, with EPS expected to grow 58%, and the stock price surged. This reflects the "disposition effect" (realizing profits too early) and "confirmation bias" (underestimating the new CEO's strategic capabilities).
- FactSet Case: The author was attracted by the "shiny" appearance of the internet craze, overlooking FactSet's solid fundamentals (high margins, loyal customers, no debt). This reminds investors: Presentation is not the same as business quality.
4. Data Comparison: Sustainability of Long-Term Excess Returns
The sequel table shows that over 22 years, the Giverny portfolio's market return was lower than its intrinsic value growth in only 6 years (e.g., 2002, 2008, 2011), but the long-term cumulative excess return was 153% (market vs intrinsic). In comparison, the S&P 500's cumulative difference between market return and intrinsic value growth was 188%, but the annualized excess was only 1.7%, indicating greater index volatility.
Key Conclusions:
- Intrinsic Value Growth is the Anchor for Long-Term Returns: The portfolio's 13.1% annualized intrinsic growth directly translated into a 13.6% market return, with a volatility of only 0.5%.
- The Cost of Errors is Enormous: The omission error on Intuit (17% annualized) and the premature sale of Knight (50% short-term gain) demonstrate that the cost of behavioral biases far exceeds transaction costs.
- "Roughly Right" is Better Than "Precisely Wrong": Although the Owner's Earnings framework is imprecise, its long-term correlation validates its effectiveness, avoiding over-reliance on short-term market noise.

5. Implications for Investors
1. Distinguish Return Sources: Be wary of returns driven by valuation expansion (e.g., UP) and prioritize companies driven by intrinsic value growth (e.g., LKQ).
2. Tolerate Short-Term Volatility: When the market fell 22% in 2008, the portfolio's intrinsic value only declined 3%, demonstrating that fundamentally sound companies can withstand market panic.
3. Systematically Reflect on Errors: Use an "Error Podium" mechanism to turn behavioral biases into learning opportunities and avoid repeating mistakes.
4. Long-Term Perspective: The 22-year data proves that even with 1-2 major errors per year, as long as the stock selection logic is correct, excess returns can still accumulate.
Summary: The sequel, through a quantitative framework and error cases, reinforces the core logic that "value investing = intrinsic value growth + behavioral discipline." Investors should, like Giverny, integrate an "owner's" mindset into their decisions while using systematic reflection to reduce behavioral biases.
New Arguments and Data Analysis: From Missed Opportunities to a Long-Term Verified Investment Philosophy
1. The Lesson of Missing FactSet: The Conflict Between Familiarity and Valuation Bias

From 2008 to 2017, the Rochon Global Portfolio achieved a total return of 351% (annualized 16.3%), and after excluding currency effects, a total return of 271.6% (annualized 14.0%).
- Data Comparison: FactSet's stock price rose from under $8 in early 1998 to over $200 in 2018, a 20-year return of over 25 times (18% annualized). Giverny Capital only held it briefly in 2003 and 2006, selling due to high valuations, thus missing the long-term gains.
- Key Insight: The author, a loyal user of FactSet (Giverny Capital uses its products), failed to hold it long-term due to valuation sensitivity. This reveals a conflict between "familiarity bias" and "valuation anchoring"—even with deep business understanding, short-term valuation fluctuations can disrupt long-term decisions.
- Data Support: FactSet maintained profit growth during the 2008-2009 Great Recession, proving its business resilience. If bought at $8 in 1998 and held until 2018, the annualized return would be 18%, far exceeding the S&P 500's ~7% (including dividends). The cost of the missed opportunity was 25 times the principal.
2. Persistence During the Difficult 2007 Period: The Reward of Patience and Strategy
- Background: In 2007, Giverny Capital underperformed due to avoiding the natural resources sector (e.g., oil) and the appreciation of the Canadian dollar (reaching parity with the USD). The author adhered to the "high-quality companies + reasonable valuation" strategy and wrote, "Patience is in order."
- Long-Term Validation: Over the ten years from 2008 to 2017, the Rochon Global Portfolio achieved a total return of 351% (annualized 16.3%), far exceeding the S&P 500's 186% (annualized 11.1%) and the S&P/TSX's 58% (annualized 4.7%). Even excluding currency effects (the CAD depreciated 21%), the portfolio return was 272% (annualized 14.0%), compared to the S&P 500's 126% (annualized 8.5%).
- Comparison Table:
| Indicator | Total Return (CAD) | Annualized Return (CAD) | Total Return (No FX Effect) | Annualized Return (No FX Effect) |
|---|---|---|---|---|
| Rochon Global | 351.0% | 16.3% | 271.6% | 14.0% |
| Blended Index* | 159.4% | 10.0% | 111.0% | 7.8% |
| S&P 500 | 186.1% | 11.1% | 126.0% | 8.5% |
| S&P/TSX | 58.1% | 4.7% | 58.1% | 4.7% |

*The blended index reflects the beginning-of-year asset weights (S&P/TSX, S&P 500, Russell 2000).
- Key Conclusion: The "patience" shown in 2007 paid off after the 2008 financial crisis. The portfolio's calculation starting before the crisis (early 2008) avoided the trap of market timing, proving that a "high-quality companies + long-term holding" strategy can navigate cycles.
3. The Core of the Investment Philosophy: The Dual Elements of Rational Selection and Patience
- Author's Summary: Success requires two elements—a rational stock selection process (high-quality companies + reasonable valuation) and patience. The former is futile without the latter.
- Data Support: From 2008 to 2017, the portfolio's annualized return was 16.3% (CAD), while the S&P 500 was only 11.1%. The excess return (5.2 percentage points) primarily came from stock selection skill (e.g., avoiding the natural resources sector) and holding period (avoiding frequent trading).
- Risk Control: The portfolio companies have "solid balance sheets and dominant business models," and their valuations are comparable to the average S&P 500 company, but with superior growth prospects. This reduces downside risk while providing upside potential.
4. Commitment to Partners: Long-Termism and Risk Management
- Core View: The author emphasizes "not only select outstanding companies, but to also remain outstanding stewards of your capital." This means avoiding excessive risk-taking in pursuit of short-term gains.
- Valuation Comparison: The valuations of the portfolio companies are similar to the average S&P 500 company, but their growth prospects are better. This implies "appreciation potential...well above average," especially compared to alternative assets like bonds.
- Risk Awareness: After the 2008 financial crisis, the portfolio was not significantly impacted, proving the protective role of "solid balance sheets" and "dominant business models" during recessions. For example, FactSet still grew its profits in 2008-2009.

5. Appendix A: Re-emphasis of the Investment Philosophy
- Key Principles:
- Stocks are the best long-term asset class.
- Market timing is ineffective; focus on a company's intrinsic value growth (usually linked to ROE).
- Select companies with high margins, high ROE, sustainable competitive advantages, and excellent management.
- Market volatility is an ally, not an enemy: use irrational pricing to buy high-quality companies.
- Short-term fluctuations (<5 years) should not influence decisions; otherwise, an advantage becomes a disadvantage.
- Data Support: The portfolio's 351% return from 2008 to 2017, compared to the S&P 500's 186%, proves the effectiveness of the "buying undervalued shares and holding for years" strategy. Volatility (e.g., the 2008 crash) instead provided buying opportunities.
Summary: A Complete Narrative from Missed Opportunities to Validation
- FactSet Lesson: The conflict between familiarity and valuation bias led to missing a 25x return. This reinforces the importance of "patience"—even if valuations seem high, if the business remains excellent, long-term holding can still be profitable.
- 2007 Test: Sticking to the strategy rather than chasing hot trends ultimately led to excess returns in 2008-2017 (annualized 16.3% vs S&P 500's 11.1%). This validates the dual necessity of "rational stock selection + patience."
- Philosophical Elevation: Investing is not a linear process; volatility is the norm. Long-term wealth creation is achieved by selecting high-quality companies, buying at reasonable valuations, holding for the long term, and accepting short-term underperformance.