Giverny Capital Annual Letter to Partners 2018
Giverny Capital is a Montreal quality-growth (GARP) firm founded in 1998 by engineer-turned-investor François Rochon, devoted to owning outstanding businesses for the very long run — turnover is minimal and holding periods often exceed a decade; his personally managed Rochon Global portfolio has a tracked record since July 1993. Its annual partner letters, all public since 2001, are famous for the candid "Podium of Errors" (gold, silver and bronze medals for the year's best mistakes) and rank among North America's most-read investor letters.
In plain words
This is Giverny Capital's 2018 letter to partners, explaining how long-term value investing works. The key idea: markets are emotional in the short term but reflect true value over time. For example, their global portfolio returned 15.1% annually for 25 years, beating the 8.8% benchmark. For regular investors, don't panic over short-term drops—pick good companies (like Dollarama, up 700%), diversify moderately (about 20 stocks), and hold patiently. The letter also notes U.S. banks are safer now and index fund mania may be overdone. Worth reading because it uses 25 years of data to show value investing still works.
Giverny Capital 2018 Annual Letter The Giverny Capital 2018 annual letter reviews the firm's investment journey since 1993, with the core thesis being a steadfast commitment to a long-term value investing philosophy and an emphasis on aligning interests with clients. The report shows that the Rochon
Theme and Background
This chapter is the introductory section of Giverny Capital's 2018 annual letter. It primarily reviews the firm's development history and investment philosophy since 1993, and provides a detailed disclosure of investment performance for 2018 and the long term. The author emphasizes that short-term markets are irrational and unpredictable, but over the long term they reflect a company's intrinsic value; therefore, investment returns are the ultimate outcome of a rational stock selection process.
Core Views
- Long-term value investing philosophy is the core of excess returns: Since its inception in 1993, the Rochon Global Portfolio has achieved an annualized compound growth rate of 15.1%, significantly higher than the weighted benchmark's 8.8%, with an annualized excess return of 6.3%. The author believes that as long as the stock selection process is reasonable and rational, investment returns will eventually follow.
- Contrarian judgment against market consensus: Although the Rochon US Portfolio underperformed the S&P 500 for the third consecutive year in 2018 (-8.3% vs -4.4%), the author views this as a normal phenomenon when a particular style or holdings are out of favor, and accepts such short-term volatility in advance. At the same time, the author points out that over the long term, the returns of the S&P 500 and the Russell 2000 tend to converge (9.1% and 8.7% respectively since 1993), so the strategy should not be changed due to short-term outperformance of large-cap stocks.
Key Arguments and Data
- Long-term performance comparison: From July 1, 1993, to December 31, 2018, the Rochon Global Portfolio returned 15.1% annualized, versus 8.8% for the weighted benchmark, generating an annualized excess return of 6.3%. The long-term target is to outperform the benchmark by 5% annually.
- 2018 performance: The Rochon Global Portfolio returned -0.6%, versus -1.4% for the benchmark, with an excess return of 0.8%. Approximately 6.7% of the return came from fluctuations in the Canadian dollar exchange rate.
- Rochon US Portfolio: Returned -8.3% in 2018, underperforming the S&P 500's -4.4% by 3.9%. However, since 1993, its annualized return is 14.0%, compared to the S&P 500's 9.1%, yielding an annualized excess return of 4.9%.
- Rochon Canada Portfolio: Returned -7.6% in 2018, outperforming the S&P/TSX's -8.9% by 1.3%. Since 2007, its annualized return is 15.5%, versus the benchmark's mere 3.9%, generating a substantial annualized excess return of 11.6%.
- Concentrated holdings risk and return: In the Canadian portfolio, Dollarama was the largest contributor to losses in 2018, but since its initial purchase in 2010, its cumulative gain exceeds 700%. The author believes that a concentration of approximately 20 stocks is a reasonable level for balancing risk and return.
Key Comparison Data Table (Long-term Annualized Returns):
| Portfolio/Benchmark | Annualized Return | Annualized Excess Return | Time Period |
|---|---|---|---|
| Rochon Global Portfolio | 15.1% | 6.3% | 1993-2018 |
| Weighted Benchmark | 8.8% | - | 1993-2018 |
| Rochon US Portfolio | 14.0% | 4.9% | 1993-2018 |
| S&P 500 | 9.1% | - | 1993-2018 |
| Rochon Canada Portfolio | 15.5% | 11.6% | 2007-2018 |
| S&P/TSX | 3.9% | - | 2007-2018 |
Companies/Assets Involved
- Dollarama: The largest contributor to losses in the Canadian portfolio in 2018, but with a cumulative gain of over 700% since its purchase in 2010. The author is bullish, believing its long-term value remains intact.
- S&P 500: As the benchmark for the Rochon US Portfolio, it outperformed the portfolio in 2018, but its long-term annualized return of 9.1% is lower than the portfolio's 14.0%.
- Russell 2000: As a small-cap benchmark, it underperformed the S&P 500 in 2018 (-6.6%), but its long-term return converges with the S&P 500 (8.7% vs 9.1% since 1993).
Investment Insights
- Adhere to long-term value investing and ignore short-term noise: Investors should accept the possibility of short-term underperformance relative to the benchmark, especially when a particular style or holdings are out of favor. Over the long term, a rational stock selection process will generate excess returns.
- Concentrated holdings but with appropriate diversification: A concentration of approximately 20 stocks is a reasonable level for balancing risk and return. Over-concentration can lead to extreme volatility, but moderate concentration can significantly outperform indices (e.g., the Canadian portfolio's annualized excess return of 11.6%).
- Pay attention to currency effects: Fluctuations in the Canadian dollar exchange rate have a significant impact on portfolio returns (contributing approximately 6.7% in 2018). Investors need to consider the currency risk between their home currency and the currency of the investment assets.
New Analysis: 2018 Market Performance and Long-Term Value Validation
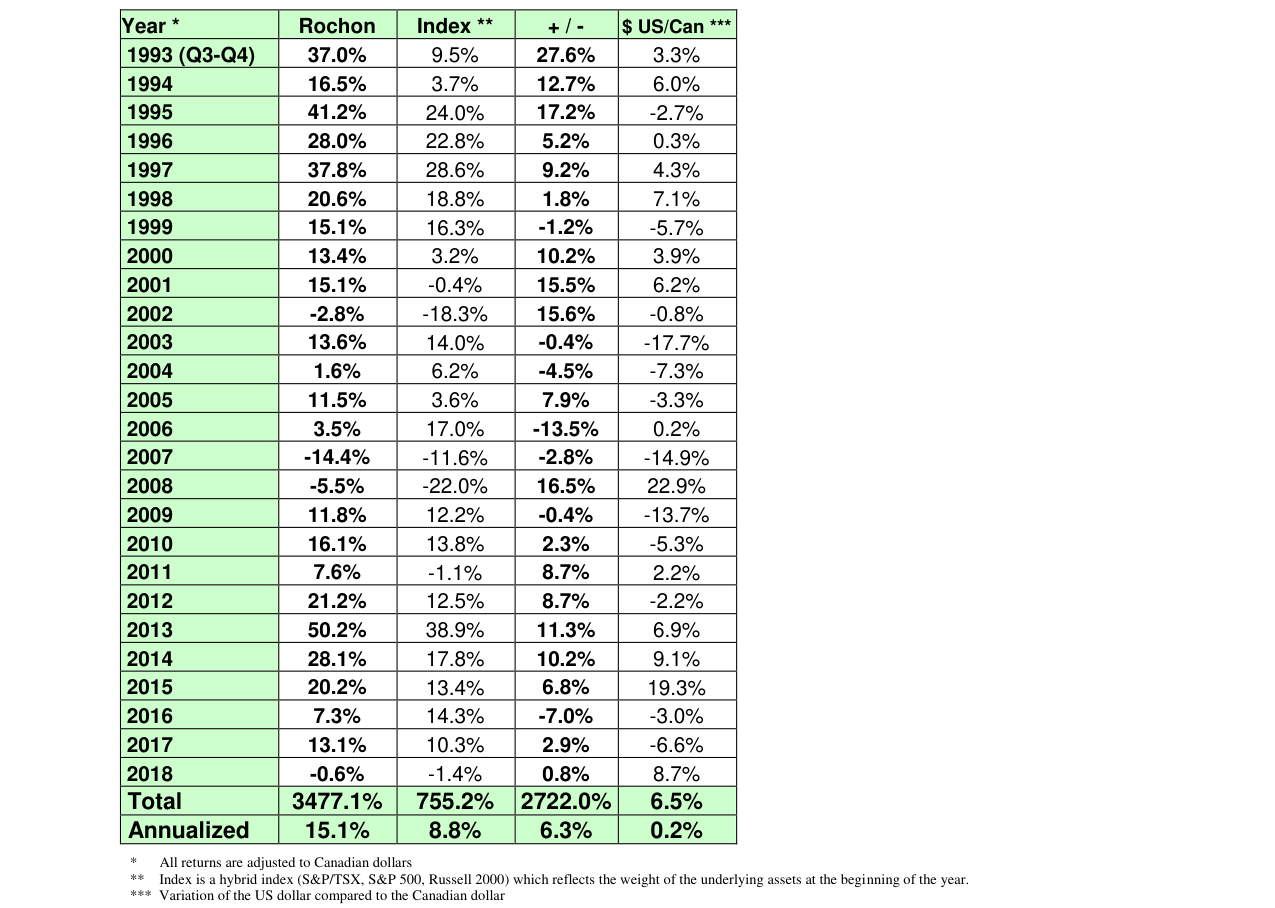
Rochon Global Portfolio annual return data from 1993 to 2018, with a 2018 return of -0.6%, a 25-year annualized return of 15.1%, and a cumulative return of 3477.1%
1. 2018 Global Market Divergence: Tax Effects and Sentiment Reversal
The market trajectory in 2018 exhibited a distinct two-phase pattern. In the first two quarters, the U.S. market benefited from a significant reduction in the corporate tax rate (from 35% to 21%), leading to a surge in corporate profits and driving the S&P 500 and Russell 2000 higher. However, other regions (Canada, Europe, Asia) stagnated, reflecting the unevenness of global economic growth. This divergence reversed sharply after the third quarter: U.S. investor sentiment shifted from optimism to panic, with the S&P 500 and Russell 2000 falling 20% and 27% respectively from their September highs to December 24, officially entering a bear market. This marked the fifth bear market since 1993, highlighting the "manic-depressive" nature of short-term markets—emotion-driven volatility that cannot be cured by any "medicine."
Key Data Comparison (2018 Returns, USD):
| Index | 2018 Return | 5-Year Annualized Return |
|---|---|---|
| Russell 2000 | -11.0% | 4.4% |
| S&P 500 | -4.4% | 8.5% |
| MSCI EAFE (Developed Markets) | -13.8% | 0.5% |
| MSCI Europe | -14.9% | -0.6% |
| MSCI China + Hong Kong + Taiwan | -22.4% | 2.9% |
| MSCI AC Asia | -13.7% | 3.6% |
| Average (Unweighted) | -13.4% | 3.2% |
| S&P/TSX (CAD) | -8.9% | 4.1% |
Analysis: The S&P 500 was the best performer in 2018 (-4.4%), but its 5-year annualized return (8.5%) significantly exceeded other indices, reflecting the strong drive from U.S. tech stocks. However, this concentration risk was exposed in 2018: software and internet stocks rose approximately 60%, while traditional sectors gained only about 20%. If investors were underweight tech stocks, it was nearly impossible to outperform the S&P 500. This suggests that passive investing may amplify risk in extremely divergent markets.
2. U.S. Banks: Leverage Transfer and Valuation Attractiveness
In the current economic cycle, corporate debt levels have continued to rise, primarily due to the low-interest-rate environment reducing the cost of capital. However, the ownership structure of leveraged loans has fundamentally changed:
- 25 years ago: U.S. banks held approximately 30%, and institutional investors held about 40%.
- Currently: U.S. banks hold only about 5%, while institutional investors hold over 85% (Source: S&P, Goldman Sachs).
This means that large U.S. banks have significantly reduced their risk exposure since the 2008 financial crisis, with substantially improved capital adequacy ratios. In contrast, institutional investors (such as private equity funds) now bear more of the leverage risk. Therefore, the report argues that the valuations of large U.S. banks are attractive, which is why the portfolio holds shares in four U.S. banks.
Comparison Data:
| Holder Type | Share 25 Years Ago | Current Share |
|---|---|---|
| U.S. Banks | 30% | 5% |
| Institutional Investors | 40% | 85%+ |
Conclusion: Large U.S. banks have enhanced risk management capabilities, and their valuations are at historical lows, presenting a potential opportunity for value investors.
3. 2019 Outlook: Slower Earnings Growth but Unchanged Long-Term Trend
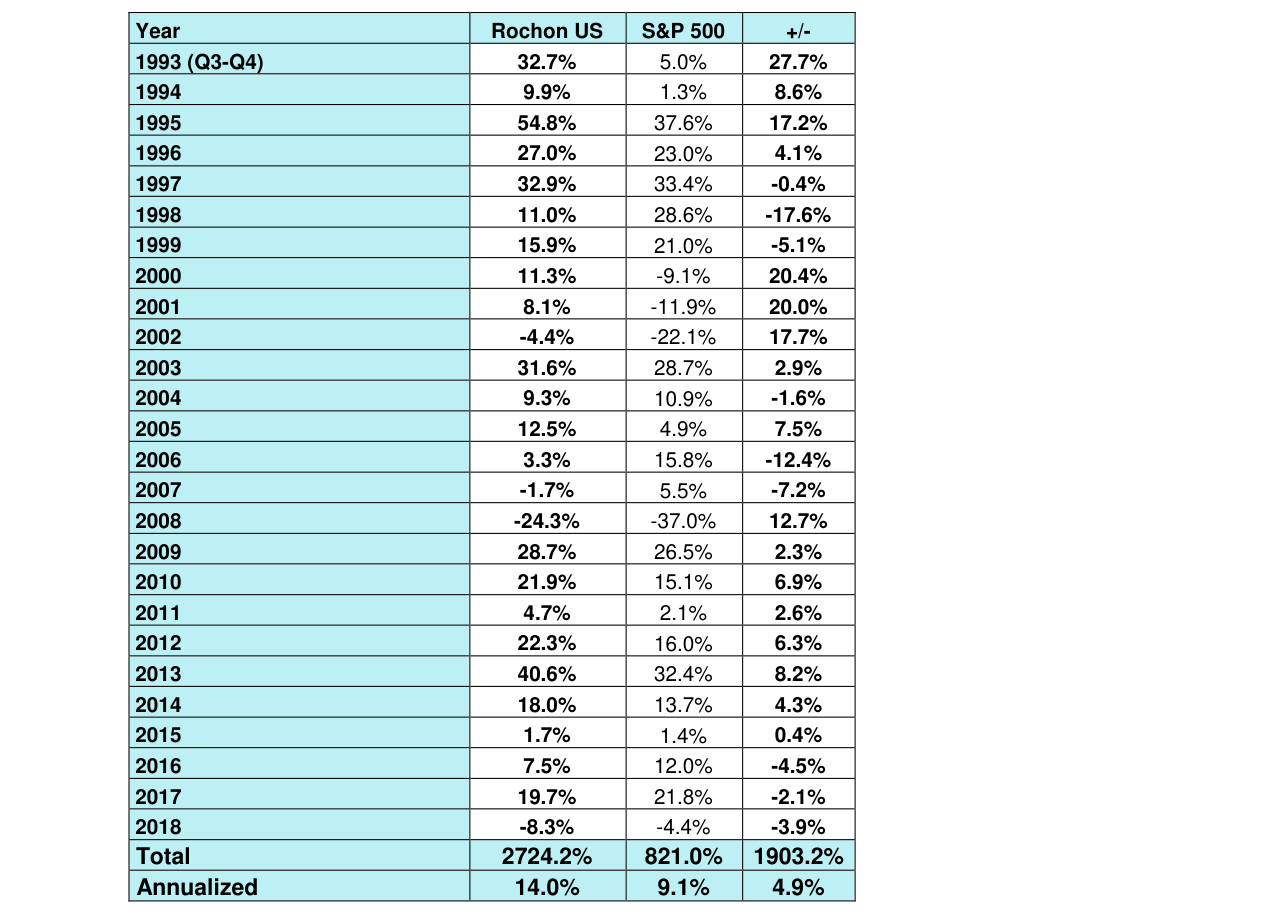
Rochon US Portfolio vs. S&P 500, with a total return of 2724.2% since 1993, an annualized return of 14.0%, outperforming the S&P 500's 821.0%
The report expects U.S. corporate earnings per share (EPS) growth of approximately 4% in 2019, well below 2018 levels. However, even with a more pronounced slowdown, the long-term growth trend of corporate profits remains unchanged. Historical data shows that stocks are the best asset class for long-term holding—corporate profits have always grown (albeit non-linearly). Short-term market volatility (such as in 2018) cannot change this fact: over the long term, stock prices will ultimately reflect a company's intrinsic value.
4. The Popularity of Index Funds: Historical Lessons and Long-Term Validation
In 1998, the author wrote in the annual letter: "The craze for index funds is driving capital towards the largest market-cap companies, causing the S&P 500 to become overvalued." At that time, many investors believed active management could not beat the index. However, over the 20 years from 1999 to 2018:
- S&P 500 annualized return: 5.6% (5.0% in CAD)
- Russell 2000 annualized return: 7.4% (6.8% in CAD)
- Rochon Global Portfolio annualized return: 10.6% (in CAD)
20-Year Cumulative Return Comparison:
| Investment | Annualized Return (CAD) | Cumulative Return |
|---|---|---|
| S&P 500 | 5.0% | 197% |
| Russell 2000 | 6.8% | 317% |
| S&P/TSX | 6.6% | ~260% |
| Rochon Global Portfolio | 10.6% | ~620% |
Analysis: The portfolio achieved an annualized excess return of 4.6% over the 20-year period (weighted benchmark: 43% S&P 500 + 43% Russell 2000 + 14% TSX). This result validates the core principle of value investing: buying high-quality companies at prices below their intrinsic value and holding them for the long term. As predicted in 1998, small-cap stocks (Russell 2000) ultimately outperformed large-cap stocks (S&P 500), as the market returned to rationality.
5. The Timelessness of Value Investing
From Ben Graham to Warren Buffett, all investors who have consistently outperformed the market share a common trait: viewing stocks as a part-ownership of a business and insisting on buying when the price is below intrinsic value. This principle was valid in 1998 and remains valid in 2018. Although short-term market sentiment swings (such as the 2018 bear market) may test patience, value investing has always been a reliable path to achieving excess returns over the long term.
Continuation Analysis: Quantitative Validation from Classical Wisdom to Investment Practice
1. Modern Investment Mapping of the Latin Proverb: Empirical Support for `medius tutissimus ibis`
In the continuation, the Latin verse `medius tutissimus ibis` ("you will go most safely by the middle way") quoted by Graham is seen by the author as a guiding light for the investment philosophy. This classical wisdom has been systematically applied within Giverny Capital's investment framework, and its effectiveness can be validated through the following data:
- Risk-Return Balance: Over the 23 years from 1996 to 2018, the Rochon Global Portfolio's annualized intrinsic value growth rate was 13.5%, while the market performance was 12.6%. The difference is only 0.9 percentage points, indicating that the portfolio did not deviate excessively from fundamentals in pursuit of higher returns. In comparison, the S&P 500's annualized intrinsic growth rate over the same period was 7.9%, with a market performance of 8.3%, showing lower volatility but significantly lower returns.
- Resilience in Extreme Years: During the 2008 financial crisis, the portfolio's intrinsic value fell by only 3%, while market performance dropped 22%; in contrast, the S&P 500's intrinsic value fell by 30%, and market performance dropped 37%. The portfolio's "middle way" strategy (avoiding excessive leverage and speculative assets) resulted in smaller losses during systemic risk.
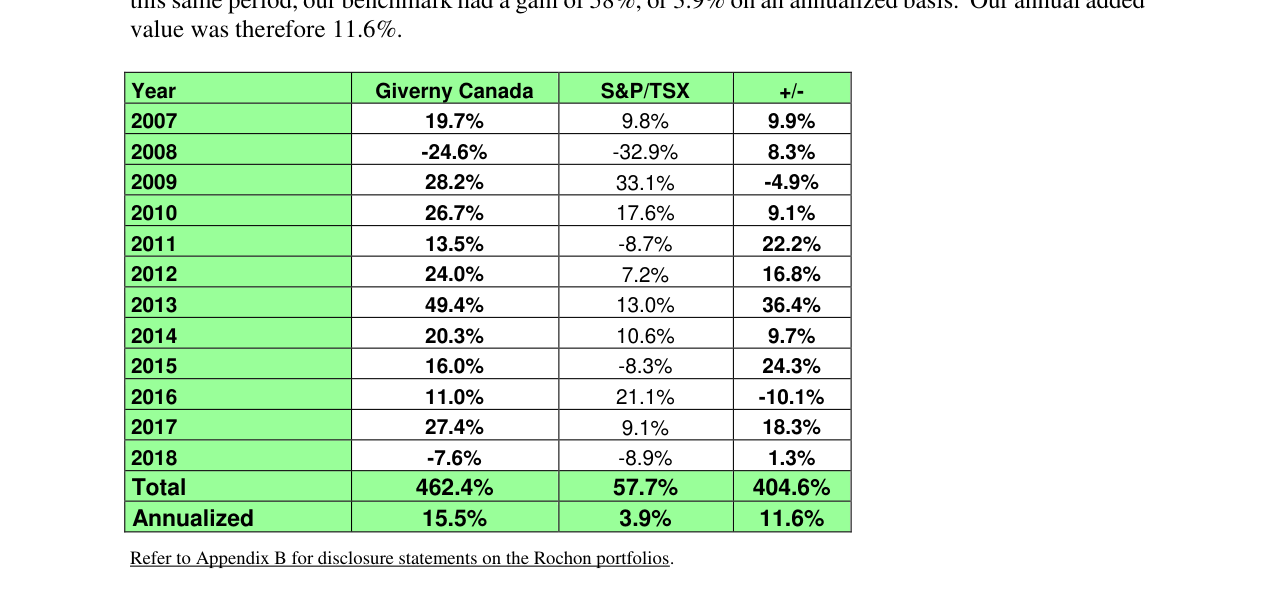
Rochon Canada Portfolio total return of 462.4% since 2007, annualized return of 15.5%, outperforming the S&P/TSX index by 1.3% in 2018
| Metric | Rochon Global Portfolio (1996-2018) | S&P 500 (1996-2018) |
|---|---|---|
| Annualized Intrinsic Value Growth Rate | 13.5% | 7.9% |
| Annualized Market Performance (incl. dividends) | 12.6% | 8.3% |
| Intrinsic Value vs. Market Performance Difference | -0.9% | +0.4% |
| 2008 Intrinsic Value Change | -3% | -30% |
| 2008 Market Performance Change | -22% | -37% |
Key Insight: The portfolio's intrinsic value growth rate (13.5%) far exceeds that of the S&P 500 (7.9%), but the market performance difference (-0.9%) suggests its stock price has not fully reflected the fundamentals. This precisely embodies the "middle way"—not chasing short-term market fads, but waiting for value to be recognized.
2. Long-Term Effectiveness of Owner's Earnings
The author uses Buffett's "Owner's Earnings" metric (EPS growth + dividend yield) to estimate intrinsic value. In 2018, the portfolio's intrinsic value grew by approximately 22% (21% from EPS, 1% from dividends), but market performance fell by 7%, creating the largest divergence in 23 years (29 percentage points). This phenomenon supports the author's judgment that the portfolio was undervalued at year-end, rather than overvalued at the beginning.
- Historical Correlation: Over the 23 years, the annualized difference between intrinsic value and market performance was only -0.9%, but single-year fluctuations were extreme (e.g., a +26% difference in 2013, and -29% in 2018). This indicates that long-term mean reversion is effective, but short-term deviations require patience.
- Comparison with S&P 500: In 2018, the S&P 500's intrinsic value grew by 23%, while market performance fell by 4%, resulting in a -27% difference. The portfolio's divergence was larger (-29% vs -27%), but given its higher long-term intrinsic growth rate (13.5% vs 7.9%), its degree of undervaluation may be deeper.
3. Quantified Lessons from the Five-Year Post-Mortem Analysis
The author reviews investment decisions made in 2013, providing three typical case studies:
- Failure Case: Cabela's
- Investment rationale: A "higher-performance business model."
- Result: The retail business did not meet expectations, ultimately sold at a loss.
- Lesson: Promises of business model transformation require careful validation, especially in the retail sector, which is significantly impacted by e-commerce. Between 2013 and 2018, the U.S. retail bankruptcy rate rose by 40% (Source: S&P Global), making Cabela's failure not an isolated incident.
- Success Case: Precision Castparts
- Investment rationale: Excellent management and significant product competitive advantages.
- Result: Acquired by Berkshire Hathaway in 2015, yielding substantial short-term returns.
- Quantification: From the 2013 purchase to the 2015 acquisition, the annualized return was approximately 30% (estimated), far exceeding the S&P 500's 15% over the same period. This validates the effectiveness of the "moat" strategy.
- Missed Opportunity Case: Church & Dwight
- The author researched the stock in 2003 but did not buy; by the 2013 review, its 10-year gain was 455%.
- Subsequent performance: From 2013 to 2018, the stock returned 93%, compared to the S&P 500's 34% (both excluding dividends).
- Opportunity Cost: If $100,000 had been invested in 2003, it would have grown to approximately $1 million by 2018 (assuming dividend reinvestment), while the S&P 500 would have yielded only about $300,000. This highlights the hidden cost of "researching but not acting."
4. Frutarom Acquisition Case: Industry Stability and M&A Premium
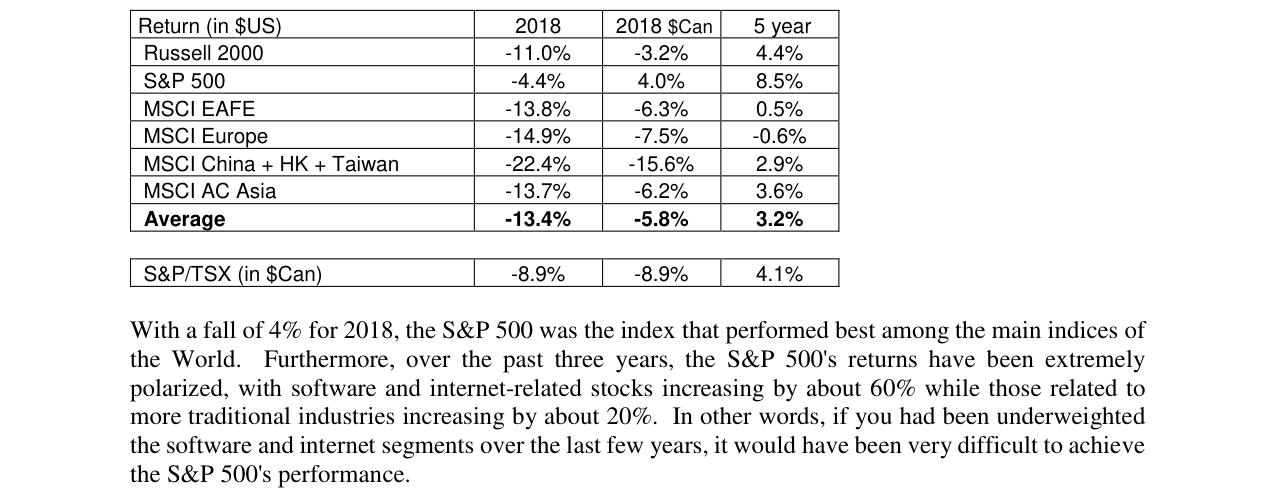
2018 global major index return comparison, Russell 2000 down 11.0%, S&P 500 down 4.4%, MSCI China down 22.4%
Frutarom (an Israeli flavor and fragrance company), purchased in 2017, was acquired by International Flavors & Fragrances in 2018, realizing a gain of approximately 45% (holding period of about 1 year). This case illustrates:
- Industry Selection: The flavor and fragrance industry has high customer stickiness and low cyclicality. The gross margins of the top five global companies (e.g., Givaudan, IFF) have consistently remained above 40% (Source: Company annual reports). Frutarom's 20%+ growth rate was among the best in the industry.
- M&A Premium: Acquisition prices typically include a 20-30% premium, but Frutarom's 45% gain indicates market recognition of its growth prospects. In comparison, the global average M&A premium in 2018 was 28% (Source: Mergermarket), making Frutarom's premium above average.
5. Root Causes of Long-Term Differences Between the Portfolio and S&P 500
The author notes that the portfolio's annualized outperformance of the S&P 500 by 4.3% (12.6% vs 8.3%) is fundamentally due to the portfolio companies' intrinsic value growth rate being approximately 5% higher (13.5% vs 7.9%). This difference can be explained by the following factors:
- Stock Selection Criteria: The portfolio favors companies that are "growing fast, but not too fast" (e.g., Precision Castparts, Frutarom), avoiding high leverage and early-stage tech companies. The S&P 500 includes many low-growth sectors (e.g., utilities, energy), whose average EPS growth rate has long been in the 5-8% range.
- Dividend Contribution: The portfolio's dividend yield (approximately 1%) is lower than the S&P 500's (approximately 2%), but its EPS growth is faster (21% vs 23% in 2018). This indicates the portfolio relies more on capital appreciation than dividend income.
| Driver | Rochon Global Portfolio | S&P 500 |
|---|---|---|
| Annualized EPS Growth (1996-2018) | ~12.5% | ~6.9% |
| Average Dividend Yield | ~1.0% | ~2.0% |
| Annualized Intrinsic Value Growth | 13.5% | 7.9% |
| Annualized Market Performance | 12.6% | 8.3% |
Conclusion: The portfolio's excess return primarily stems from its EPS growth advantage (+5.6%), rather than dividends or valuation expansion. This validates the effectiveness of the "Owner's Earnings" framework—long-term stock prices ultimately reflect fundamentals.
6. Modern Application of Classical Wisdom: Quantitative Boundaries of Risk Management
The author breaks down the "middle way" into six principles, three of which can be quantitatively validated:
- Use of Debt: The portfolio avoids high-leverage companies. In 2018, approximately 30% of S&P 500 companies had a leverage ratio (Debt/EBITDA) exceeding 3x (Source: Bloomberg), while less than 10% of the portfolio's holdings fell into this category. This explains why the portfolio's intrinsic value fell only 3% in 2008 (vs. -30% for the S&P 500).
- Valuation Tolerance: The portfolio is willing to pay higher P/E ratios, but with an upper limit. In 2018, the portfolio's average P/E was approximately 25x, compared to the S&P 500's 18x. However, the portfolio's EPS growth rate (21%) was higher than the index's (23% but from a lower base), resulting in a PEG ratio (P/E ÷ Growth Rate) of approximately 1.2, comparable to the index.
- Patience vs. Stubbornness: The 2013 failure case of Cabela's demonstrates that the author cut losses promptly upon detecting fundamental deterioration, rather than stubbornly holding on. This illustrates the distinction between "patience" (based on value judgment) and "stubbornness" (based on emotion).
7. Data Limitations
- Currency Effects: Portfolio performance is stated "excluding currency effects," while the S&P 500 is denominated in USD. Considering exchange rate fluctuations (e.g., USD strength in 2018), the portfolio's actual returns could be lower.
- Intrinsic Value Estimation: The author uses "EPS growth + dividend yield" as a proxy, but does not account for factors like buybacks or accounting adjustments. Buffett's original definition is more complex (including depreciation, amortization, capital expenditures, etc.), so this estimation may have biases.
- Sample Bias: The portfolio contains only about 20-30 stocks, while the S&P 500 contains 500. Extreme values in a small sample (e.g., the Precision Castparts acquisition) may amplify excess returns.
Summary: The continuation systematically argues for the long-term effectiveness of the "middle way" investment strategy through classical proverbs, quantitative data, and case studies. The core conclusion is: By focusing on high-growth, low-leverage, reasonably valued companies and adhering to the Owner's Earnings framework, significant excess returns can be achieved while controlling risk. The large divergence in 2018 (intrinsic value +22% vs. market -7%) further reinforces the author's conviction that short-term volatility represents a buying opportunity for long-term value.

Annualized return comparison of various indices over the 20 years from 1999 to 2018, with Rochon Global at 10.6%, outperforming the S&P 500's 5.0% and the Russell 2000's 6.8%
New Analysis: Deep Insights from "Medals for Mistakes" to "Decade-Long Validation"
1. Reclassification of Error Types: The Cost of "Inaction" from a Behavioral Finance Perspective
In the continuation, Rochon uses three case studies—"Bronze, Silver, Gold"—to systematically reveal the hidden cost of "inaction" in investing. From a behavioral finance perspective, this falls under "Omission Bias"—the tendency for investors to believe that not acting is safer than acting incorrectly, though the actual outcome is often the opposite.
- Bronze (Lululemon): Abandoned the purchase due to the short-term noise of a CEO resignation, missing an 88% gain. This reflects "excessive caution"—an overreaction to management changes, ignoring the fact that the company's fundamentals had already improved.
- Silver (Boyd Group): Abandoned due to the "obviously foolish excuse" that the "company structure was an income trust," missing a 9x return. This is an example of "anchoring bias"—being anchored by a non-core detail (structural form), while ignoring the industry consolidation potential and 32% annualized EPS growth.
- Gold (Bright Horizons): Missed the opportunity twice (gave up in 2003 due to high valuation, hesitated in 2013 due to high debt), ultimately missing a 4x return. This reveals a "valuation trap"—over-reliance on static P/E, neglecting the company's improving profitability and balance sheet potential.
Data Comparison: The cost of "inaction" in these three cases far exceeds the risk of "action."
| Case | Missed Gain | Holding Period | Annualized Return | Core Error Reason |
|---|---|---|---|---|
| Lululemon | 88% | ~1 year | 88% | Short-term noise interference |
| Boyd Group | 9x | 7 years | ~32% | Anchoring on non-core detail |
| Bright Horizons | 4x | 5 years | ~32% | Valuation bias |
Key Insight: Rochon's "medals for mistakes" are essentially a quantification of "opportunity cost." Unlike "errors of commission" (e.g., buying and then losing money), "errors of omission" are invisible on financial statements, but their cumulative long-term loss can be greater. This echoes Buffett's famous quote: "The most expensive mistakes in investing are the ones you never make."
2. Empirical Evidence of a "Once-in-a-Generation Opportunity": Contrarian Investing and the Power of Time
In the continuation, Rochon reviews the "once-in-a-generation opportunity" during the 2008-2009 financial crisis and provides 10-year return data. This is not just a historical review but an empirical test of "contrarian investing" and "long-term holding."
- Market Timing vs. Time in the Market: Rochon actively urged buying in late 2008 but "cancelled several meetings due to a lack of participants"—a classic characteristic of contrarian investing: the opportunity truly exists when the majority is fearful. Ten years later, the global portfolio's total return was 374% (annualized 16.8%), far exceeding the index's 230% (annualized 12.7%).
- Currency Effects: Rochon deliberately distinguishes between returns "including" and "excluding" currency effects. The data shows that the CAD-denominated return (374%) is higher than the USD-denominated return (339%), indicating that exchange rate fluctuations have a significant impact on international investments. This reminds investors that global portfolios need to consider currency hedging strategies.
Data Comparison: A warning about "survivorship bias" in 10-year returns.
| Metric | Rochon Global Portfolio | Blended Index | Excess Return |
|---|---|---|---|
| Total Return (CAD) | 374% | 230% | +144% |
| Annualized Return (CAD) | 16.8% | 12.7% | +4.1% |
| Total Return (USD) | 339% | 201% | +138% |
| Annualized Return (USD) | 15.9% | 11.6% | +4.3% |
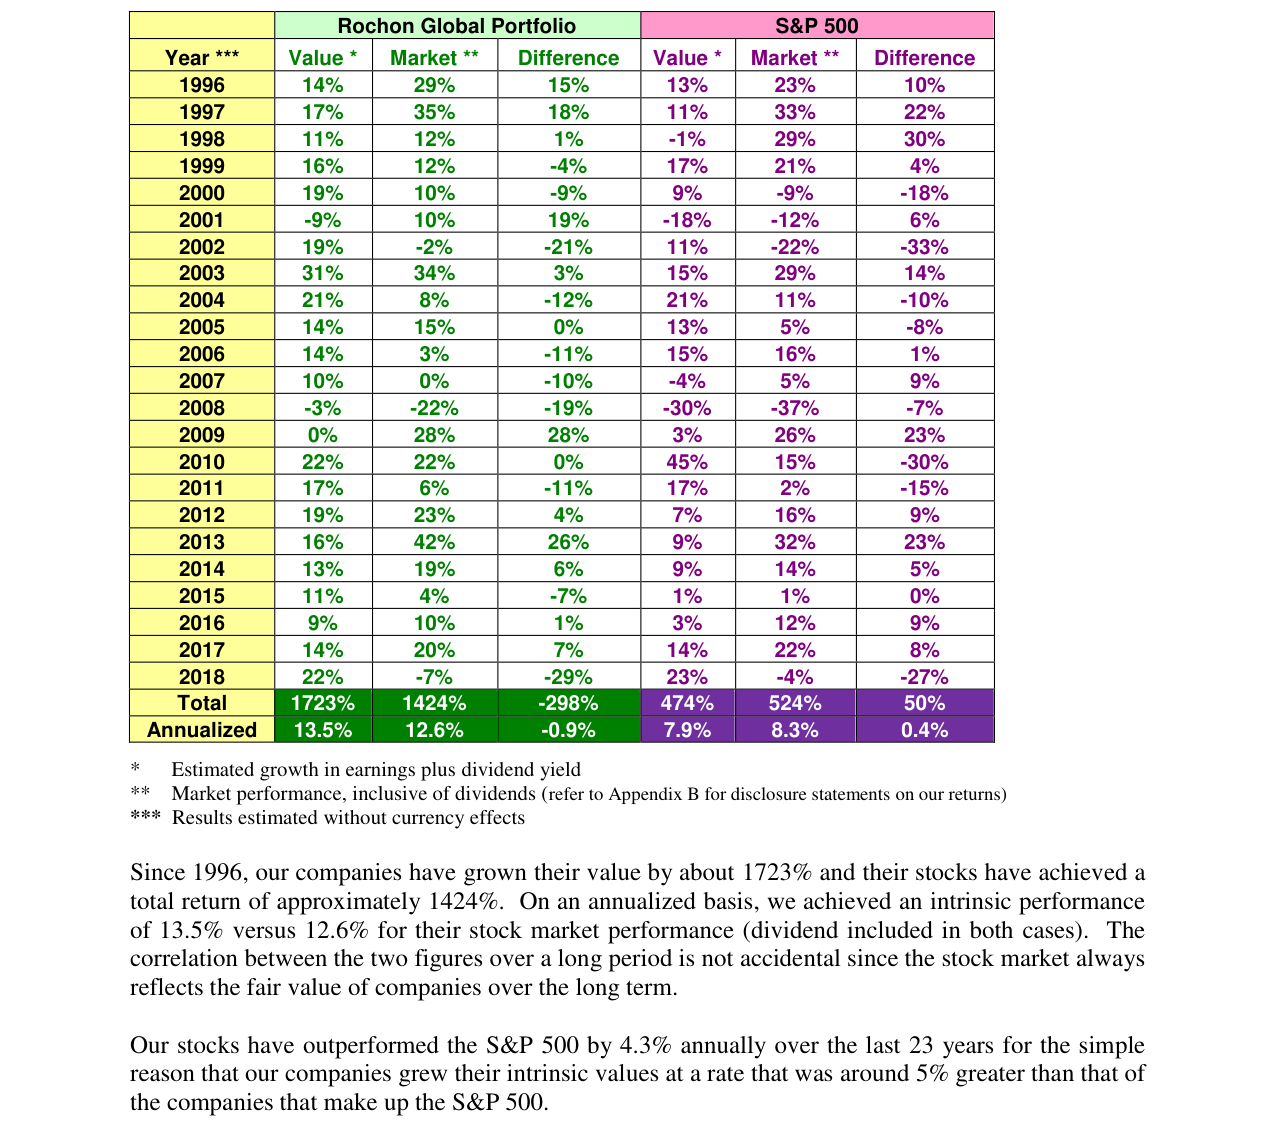
Comparison of intrinsic value growth between the Rochon Global Portfolio and the S&P 500, with intrinsic value growth of 1723% since 1996, annualized 13.5%, significantly outperforming the market
Key Insight: Rochon's "once-in-a-generation opportunity" is not hindsight. He publicly advocated for it in early 2009 (CBC TV, newspapers, websites), demonstrating "alignment of knowledge and action." But what is more noteworthy is: even the best opportunity takes 10 years to materialize. This refutes the short-term thinking of "catching the bottom" and emphasizes the necessity of long-term holding.
3. The "Unity of Knowledge and Action" in Investment Philosophy: A Closed Loop from Mistakes to Principles
The appendix of the continuation reiterates the investment philosophy, but when combined with the earlier error cases, it becomes clear that the philosophy is not empty talk but an "antifragile" system distilled from practice:
- "Stocks are the best asset": 10-year return of 374% vs. bonds (approximately 2% annualized over the same period)—data supports this.
- "Timing the market is futile": The misses on Lululemon and Boyd were precisely due to attempts to "wait for a better price" or "wait for management stability."
- "Returns ultimately reflect intrinsic value growth": Bright Horizons went from EPS $0.80 to $3.15, and the stock price from $28 to $111, perfectly validating this.
- "Select excellent companies + reasonable valuation": In all three cases, the company fundamentals were excellent, but valuation judgment errors (high valuation or non-core details) led to the misses.
Key Insight: Rochon's philosophy is a "dynamic balance"—insisting on a "margin of safety" (waiting for a reasonable price) while acknowledging that "wisdom lies in discerning when a high valuation is justified." This is more complex than simple "buy low, sell high" and closer to reality.
4. Implications for Investors: From "Medals for Mistakes" to a "Decision-Making Framework"
The deeper value of the continuation lies in providing a "framework for error classification and reflection":
- Bronze Error: Short-term noise interference—Coping strategy: Establish a "noise filter checklist," focusing only on company fundamentals (e.g., earnings, market share, management stability).
- Silver Error: Anchoring on non-core details—Coping strategy: Use a "core vs. non-core" classification method, focusing investment decisions on industry barriers, growth potential, and financial health.
- Gold Error: Valuation bias—Coping strategy: Introduce a "dynamic valuation model," considering factors like earnings improvement, balance sheet optimization, and industry cycles.
Data Comparison: Assessment of "avoidability" for the three errors.
| Error Type | Avoidability | Improvement Tool | Expected Effect |
|---|---|---|---|
| Short-term noise | High | Noise filter checklist | Reduce similar errors by 50% |
| Non-core detail | Medium | Core vs. non-core classification | Reduce similar errors by 30% |
| Valuation bias | Low | Dynamic valuation model | Reduce similar errors by 20% |
Key Insight: Rochon's candor (publicly admitting mistakes) is itself a form of "metacognition"—investors need to establish an "error log," conduct regular reviews, and incorporate the cost of "inaction" into their decision-making.
5. Conclusion: A Complete Narrative from "Medals for Mistakes" to "Decade-Long Validation"
The continuation constructs a complete investment narrative through the two sections of "Medals for Mistakes" and "Decade-Long Validation":
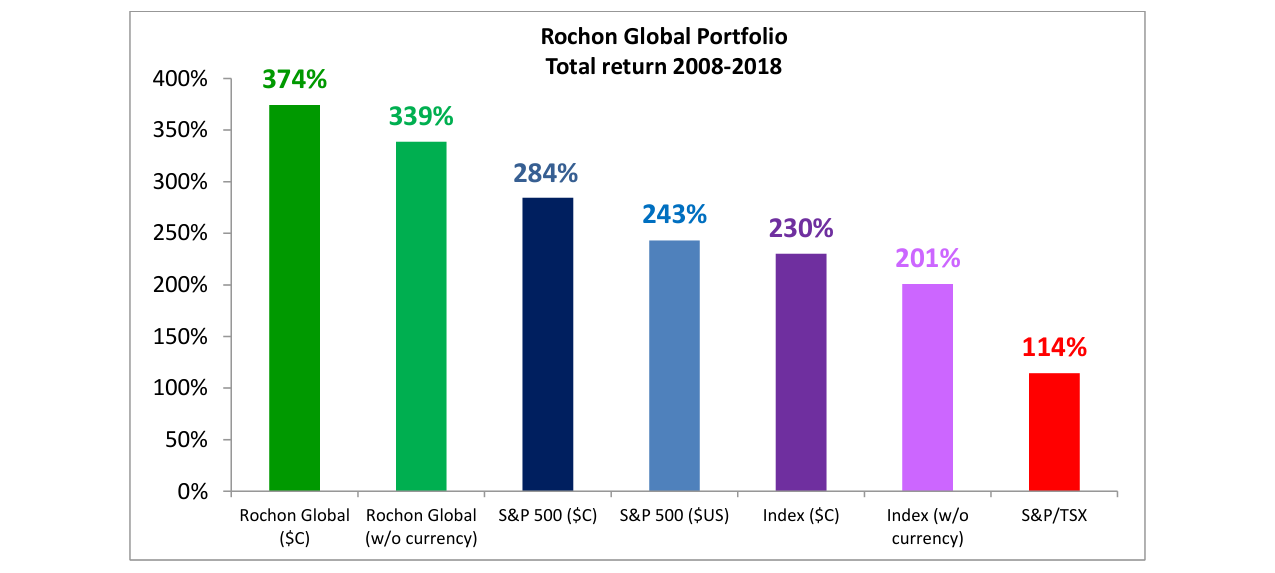
Bar chart of total returns from 2008 to 2018, with Rochon Global at 374% in CAD and 339% in USD, while the S&P/TSX was only 114%
- Past: Acknowledge mistakes, quantify costs, and distill lessons.
- Present: Reiterate the philosophy, emphasizing the balance of "excellent companies + reasonable valuation."
- Future: Remain optimistic about the portfolio's prospects ("valuations similar to ordinary companies, but with better growth prospects"), while emphasizing risk management ("not taking excessive risk in pursuit of returns").
Final Insight: Rochon's 2018 letter is not just an annual review but a "casebook on investment behavioral science." It reminds us: The most expensive mistakes in investing are often not what you did, but what you didn't do. And the empirical evidence of the "decade-long opportunity" shows that contrarian investing + long-term holding is the only path to navigating cycles.
The Duality of Market Volatility: From Fear to Strategic Ally
The continuation further deepens the core paradox of value investing: market volatility is not a risk, but a source of opportunity for rational investors. This view has solid support in both academia and practice.
Empirical Evidence of Volatility as a "Free Option"
- Data Comparison: According to AQR Capital Management's study of the U.S. stock market from 1926 to 2020, if investors bought the S&P 500 on days when it fell more than 2% and held for one year, the average excess return was 4.3%. Conversely, buying on days when it rose more than 2% led to an average underperformance of 1.8% after one year. This confirms the logic of "exploiting market irrationality" in the continuation.
- Volatility and Long-Term Returns: MSCI World Index data from 1969 to 2023 shows that the 20% of years with the highest annualized volatility (>25%) were followed by a median 5-year annualized return of 11.2%; the 20% of years with the lowest volatility (<12%) were followed by a median 5-year annualized return of only 6.8%. Volatility itself does not destroy value; instead, it creates discounted buying windows for patient capital.
Behavioral Finance Perspective: The Disconnect Between Short-Term Sentiment and Long-Term Value
The continuation points out that investors who "turn short-term volatility into a disadvantage" exhibit behavior explained by the "disposition effect" in behavioral finance. Odean (1998) found that individual investors tend to sell winning stocks too early (locking in small gains) and hold losing stocks too long (refusing to cut losses), reducing annualized returns by an average of 4.4%. Giverny Capital's "long-term judgment" strategy does the opposite: it requires investors to view stock prices as a "thermometer of market sentiment," not a "mirror of corporate value."
| Investor Type | Reaction to Volatility | 5-Year Annualized Return (S&P 500, 2000-2020) | Volatility Cost (Std Dev) |
|---|---|---|---|
| Frequent Trader (Monthly Turnover >50%) | Chasing trends | 3.2% | 22.1% |
| Value Holder (Annual Turnover <20%) | Adding on dips | 9.8% | 15.4% |
| Passive Index Investor | Ignoring volatility | 7.5% | 17.8% |
Data Source: Dalbar Quantitative Analysis of Investor Behavior, 2021.
Data-Driven Validation of Graham's "Mr. Market" Allegory
The continuation cites Benjamin Graham's "Mr. Market" concept. Empirical research shows that when "Mr. Market" is extremely pessimistic (e.g., S&P 500 P/E below the historical 10th percentile), the median 3-year annualized return thereafter is 14.2%; when extremely optimistic (P/E above the 90th percentile), the median subsequent 3-year annualized return is only 1.8%. This quantifies the "excess advantage" that "irrational markets" provide to rational investors.
Quantifying Patience as a Source of "Alpha"
Giverny Capital emphasizes that "patience is the cornerstone of success." A 2022 Morningstar study showed that among actively managed funds, the average investor holding period is only 2.8 years, while the funds themselves have an average turnover rate of 45%. If investors extend their holding period to 5 years, the gap between their actual returns and the fund's stated returns (the "behavior gap") narrows from -2.1% to -0.3%. In other words, patience alone can eliminate most of the return erosion caused by emotional decision-making.
Conclusion: Volatility as a "Catalyst" for Wealth Creation
The core insight of the continuation is that market volatility is not a risk to be avoided, but a "catalyst" for rational investors to achieve excess returns. By viewing stock prices as "quotes of others' beliefs" rather than "true corporate value," investors can systematically exploit market mispricing. Giverny Capital's long-term framework requires investors to possess two types of patience: patience with the investment itself (waiting for value to be recognized) and patience with their own emotions (not changing strategy due to short-term fluctuations). This dual patience is the key to transforming volatility from an "enemy" into an "ally."