Comments on Fourth Quarter 2019
Cobas Asset Management is a Madrid deep-value firm founded in late 2016 by Francisco García Paramés, Europe's standard-bearer of value investing after 25+ years running Bestinver and author of "Investing for the Long Term". Cobas applies a strict Graham/Buffett value framework overlaid with Austrian business-cycle theory, concentrating in unloved energy, shipping and other cyclicals, with AUM above €3.4bn. Its investor letters are fully archived from Q1 2017, moving to a semi-annual cadence in 2022.
In plain words
This report from Cobas Asset Management reviews their 2019 fourth quarter. They stick to value investing—buying cheap stocks—and think expensive tech stocks will eventually fall. Their portfolio trades at just 6-8 times earnings (price relative to profit), much cheaper than the market's 13-18 times. They highlight opportunities in LNG shipping and European nursing homes. For regular investors, it's a reminder: don't just chase hot stocks; cheap ones might pay off over time, but you need patience.
Cobas Asset Management's third anniversary report notes that despite net redemptions exceeding €4 billion in the Spanish equity fund market, Cobas still achieved nearly €15 million in net inflows in 2019, attracting approximately 2,500 new investors and bringing the total number of fund holders to 2
Theme and Background
This chapter is a retrospective report marking the third anniversary of Cobas Asset Management. Against the backdrop of net redemptions exceeding €4 billion across the Spanish equity fund market, the author emphasizes that the company bucked the trend by attracting nearly €15 million in net inflows and adding approximately 2,500 new investors. The report's core is a reaffirmation of the value investing philosophy, arguing that the current underperformance of value stocks relative to growth stocks is a temporary phenomenon and that a reversion to the mean will occur over the long term.
Core Views
- Value Stocks Will Recover Lost Ground: The author asserts that since December 2006, the underperformance of value stocks relative to growth stocks represents the longest such period in history, but historical data indicates this deviation will eventually correct.
- Current Market Has Structural Mismatches: The market capitalization share of the top five technology/internet companies in the S&P 500 far exceeds their profit share, similar to the tech bubble period of 1998-2000, suggesting the market may be brewing a correction.
- Extremely High Margin of Safety in the Portfolio: The Cobas portfolio trades at a P/E ratio of only 6-8x, compared to 13-18x for major indices. The author believes this offers a "cheap basement" level buying opportunity.
Key Arguments and Data
1. Historical Data Comparison: From 1963 to 2006, value stocks outperformed growth stocks by a factor of 6 (see Figure 1). However, the period from December 2006 to the present marks the worst performance of value stocks relative to growth stocks.
2. Market Concentration Risk: The market capitalization share of the top five companies in the S&P 500 (all technology or internet companies) has been rising, but their profit growth has not kept pace (see Figure 2). The author believes this divergence is unsustainable.
3. Industry Fundamentals Improvement:
- Crude Oil Shipping: IMO 2020 regulations and ballast water treatment requirements are leading to the scrapping of older vessels and a lack of new orders, while rising US crude oil production (farther from Asian demand centers) boosts transport demand. Daily freight rates hit all-time highs at the end of 2019.
- Liquefied Natural Gas (LNG) Infrastructure: Golar LNG has made progress with its FLNG (Floating Liquefaction) and downstream businesses (e.g., in developing countries like Brazil), with long-term contracts supporting valuations.
Comparative Data Table:
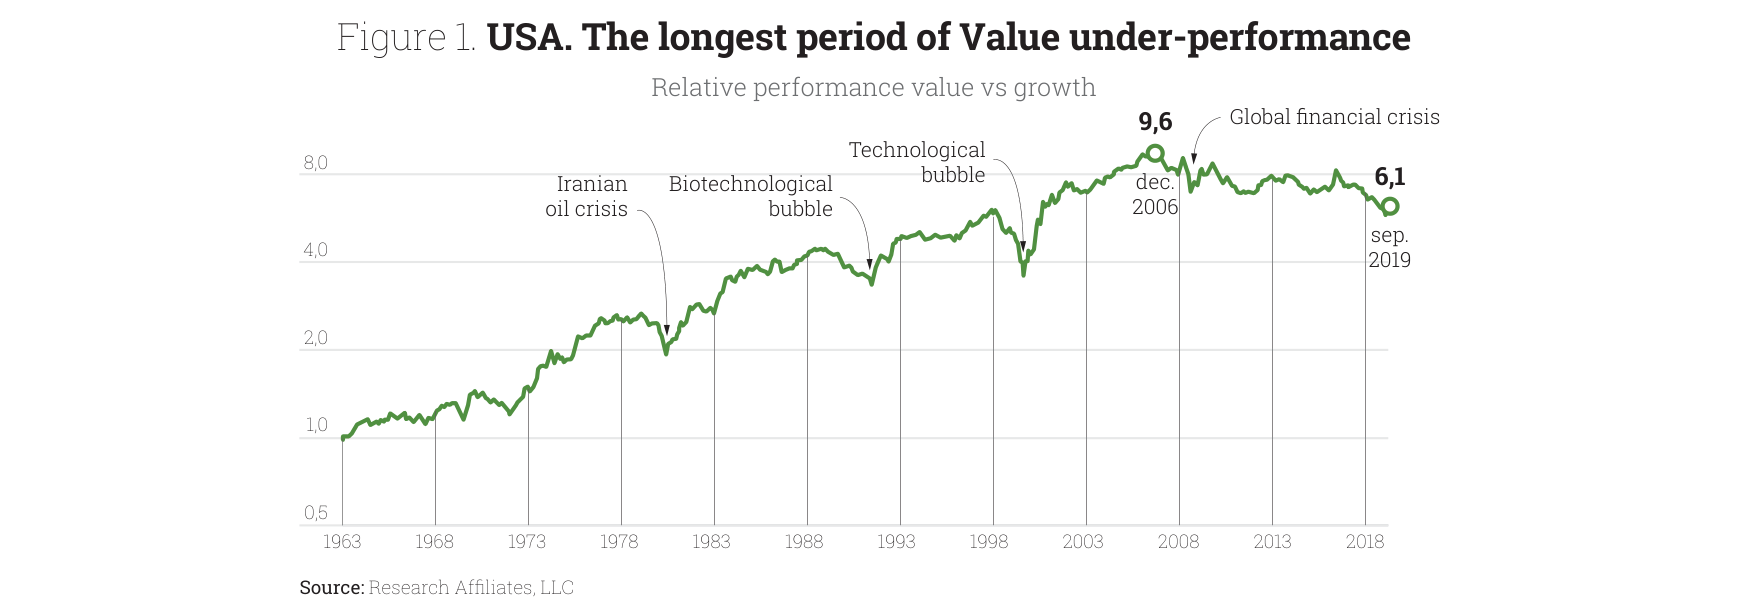
Relative performance of value vs. growth stocks grew from 1.0 in 1963 to 9.6 in 2006, and was 6.1 in September 2019, showing the longest period of value stock underperformance
| Metric | Cobas Portfolio | Major Indices |
|---|---|---|
| Price-to-Earnings (P/E) | 6-8x | 13-18x |
| Period | Value vs. Growth Performance |
|---|---|
| 1963-2006 | Value outperformed by 6x |
| Dec 2006 - 2019 | Worst period for value performance |
| S&P 500 Top 5 Companies | Market Cap Share | Net Profit Share |
|---|---|---|
| 1995 | ~10% | ~12% |
| 2019 | ~20% | ~15% |
Companies/Assets Involved
- Golar LNG (Bullish): The author significantly increased the position in 2019. The company is transforming through FLNG and downstream operations (e.g., Brazil) and plans to simplify its corporate structure to improve market perception. The author believes its assets are significantly undervalued.
- CIR & Coffide (Bullish): An Italian holding company where the author added to the position. Key value point: holds approximately 60% of KOS (Italian/German nursing homes and elderly hospitals), a business benefiting from Europe's aging population. KOS's valuation alone nearly equals CIR & Coffide's entire market cap. Additionally, the company holds over €350 million in cash and approximately 57% of Sogefi, effectively obtained for "free."
- Crude Oil Shipping Companies (Reduced): Includes International Seaways, Diamond S Shipping, Euronav, DHT, Scorpio Tankers, Costamare. The author significantly reduced positions in 2019 as stock prices had already reflected some value (bought below book value), and daily freight rates, after hitting records at the end of 2019, may face a pullback.
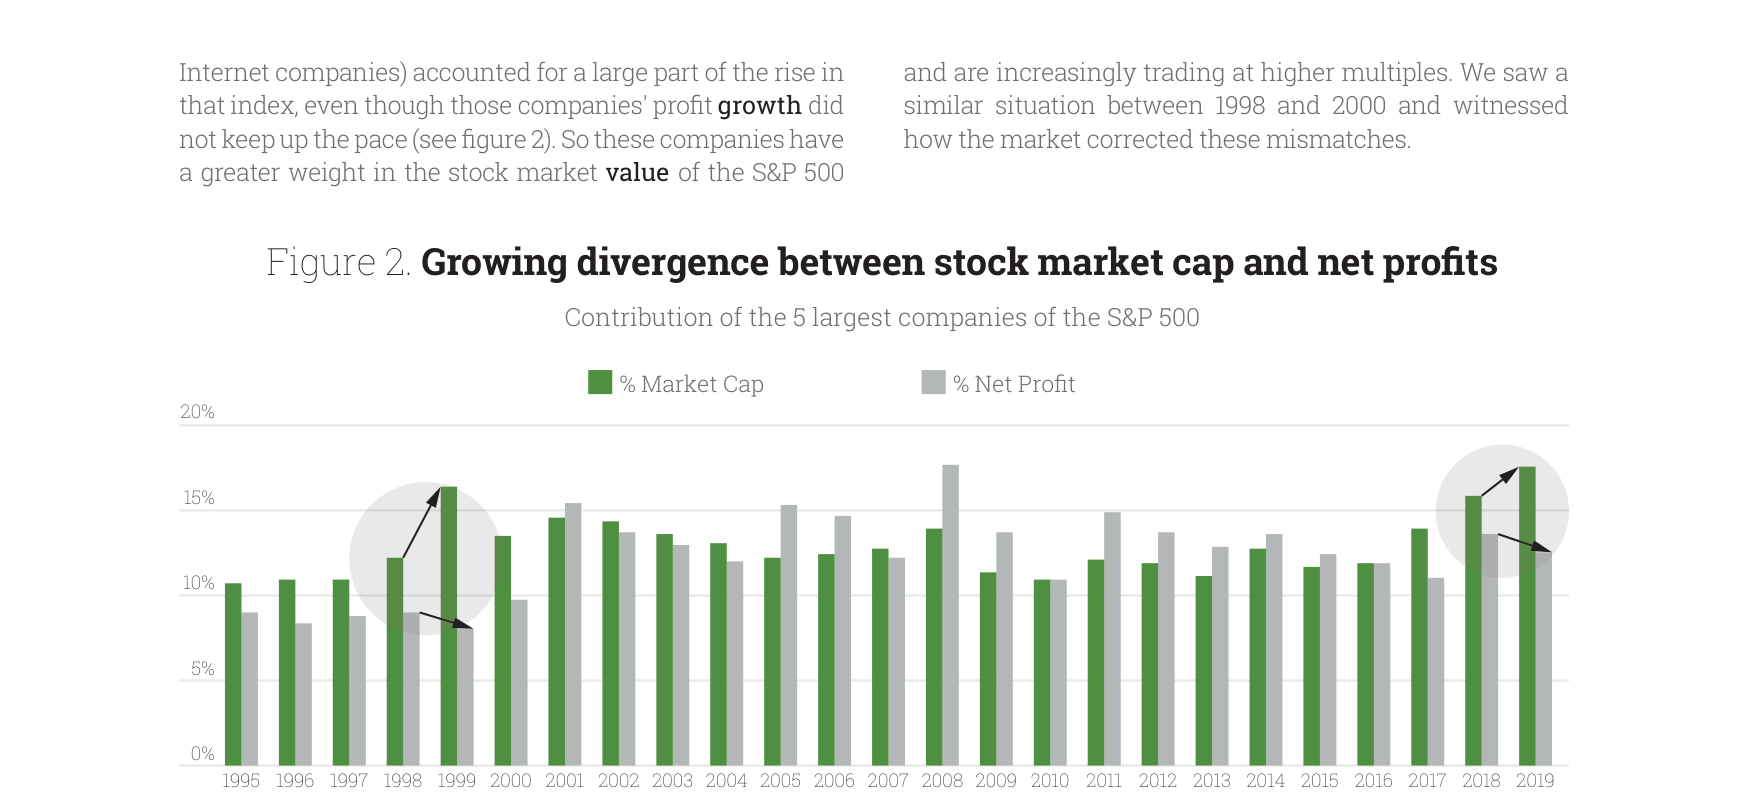
Divergence between market cap share and net profit share of the S&P 500 top 5 companies; in 2019, market cap share was ~17% while net profit share was ~12%
Investment Implications
- Directional Judgment: Investors should focus on the mean reversion opportunity for value stocks relative to growth stocks, especially in portfolios with extremely low P/E ratios (e.g., 6-8x). History suggests value stocks often stage strong rebounds after prolonged periods of underperformance.
- Specific Sector Opportunities:
- LNG Infrastructure: Golar LNG's simplification and project execution could trigger a valuation re-rating. Focus on the expansion of its downstream business in developing countries like Brazil.
- European Holding Company Discounts: Assets like CIR & Coffide, where the core asset (KOS) valuation covers nearly the entire market cap, and cash and other assets are essentially free, offer very low risk.
- Risk Warning: Although fundamentals in the crude oil shipping industry have improved, stock prices have partially reflected this, and daily freight rates are highly volatile. Chasing highs is not advisable.
Additional Arguments and Data Analysis: Cobas AM Q4 2019 Report Continuation
1. In-depth Analysis of Portfolio Performance vs. Benchmark
In 2019, none of Cobas AM's three core portfolios outperformed their benchmark indices, but internal performance differences were significant. The table below summarizes each portfolio's annual return versus its benchmark:
| Portfolio | 2019 Return | Benchmark Index | Benchmark Return | Cumulative Return Since Inception (End 2019) | Cumulative Benchmark Return Since Inception |
|---|---|---|---|---|---|
| International Portfolio | +13.4% | MSCI Europe Net Total Return | +26.0% | -17.8% (since mid-March 2017) | +20.0% |
| Iberian Portfolio | +6.6% | Not explicitly specified (likely Iberian index) | +15.5% | +0.9% (since March 2017) | +5.1% |
| Large Cap Portfolio | +10.9% | MSCI World Net | +30.0% | -18.8% (since early April 2017) | +27.8% |
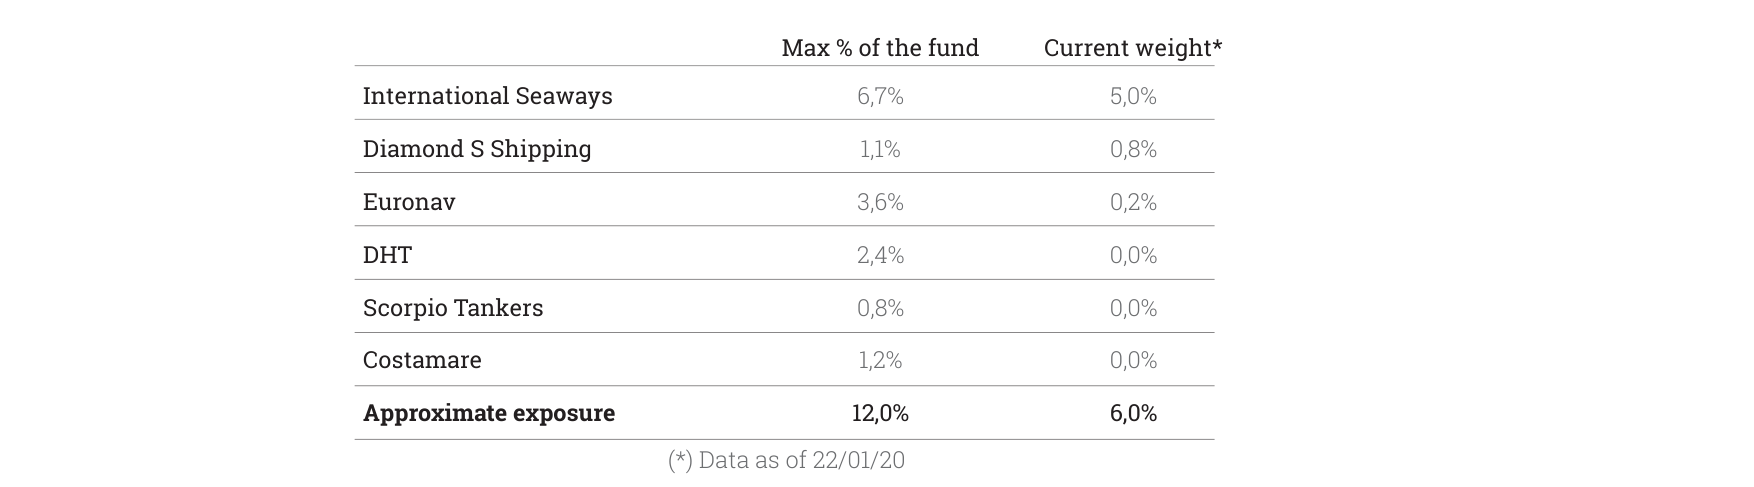
Tanker sector holdings detail: International Seaways current weight 5.0%, Diamond S Shipping 0.8%, total exposure reduced from 12.0% to 6.0%
Key Findings:
- International Portfolio: Despite a positive return in 2019, it has accumulated a loss of 17.8% since inception, contrasting sharply with the benchmark's +20.0%, a gap of 37.8 percentage points.
- Large Cap Portfolio: Performed the worst, with a cumulative loss of 18.8% since inception, while the benchmark rose 27.8%, a gap of 46.6 percentage points.
- Iberian Portfolio: The only portfolio with a positive cumulative return since inception (+0.9%), but still lagged its benchmark by 4.2 percentage points.
2. Portfolio Adjustments and Position Changes
All portfolios underwent significant position adjustments in 2019, reflecting the management team's reassessment of market opportunities:
- International Portfolio:
- Sells: Liquidated 14 stocks (~14% of portfolio), mainly due to price increases, e.g., Bonheur (+96%), Costamare INC (+83%), DHT Holdings (+50%).
- Buys: Added 11 new stocks (~9% of portfolio), focusing on Cairn Energy, Saipem, Diamond S Shipping.
- Increases: Golar LNG (+4.4%), CIR-Coffide (+2.9%), due to weak stock price performance.
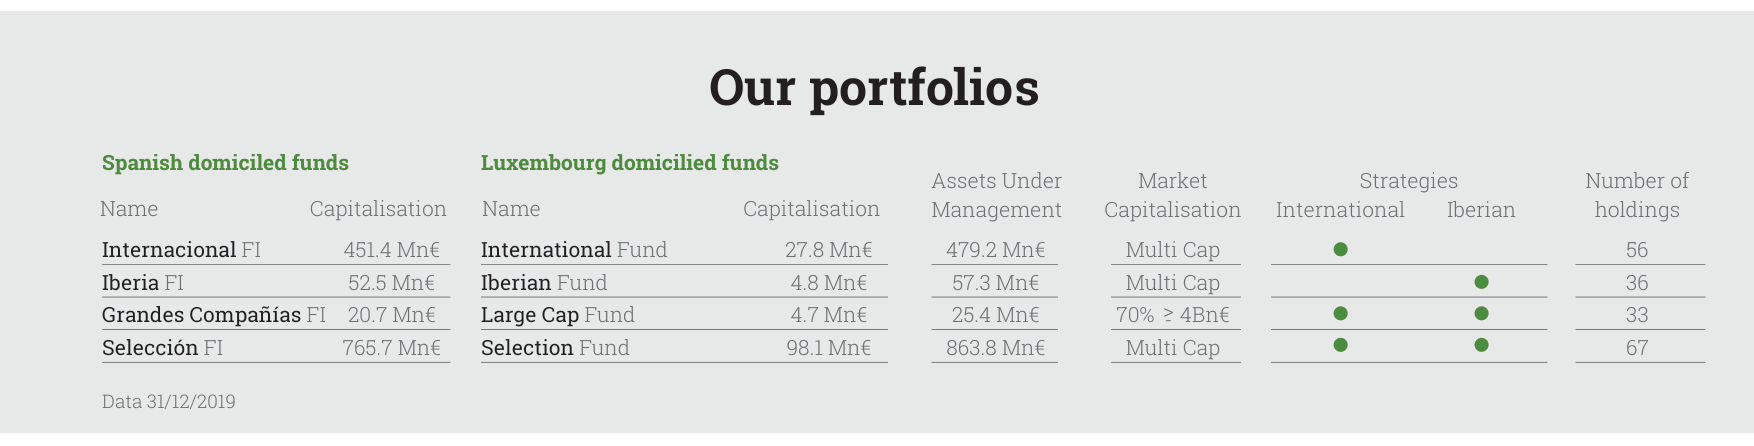
Fund size breakdown: International FI €451.4 million, Selección FI €765.7 million, total AUM €2.025 billion
- Iberian Portfolio:
- Sells: Liquidated 9 stocks (~13% of portfolio).
- Buys: Added 9 new stocks (~9% of portfolio), focusing on Catalana Occidente, CTT, AEDAS (each ~1.5%).
- Increases: Semapa (+5.0%), Meliá (+2.6%), Vocento, due to falling stock prices and increased management confidence.
- Large Cap Portfolio:
- Sells: Liquidated 4 stocks (~11% of portfolio).
- Buys: Added 5 new stocks (~14% of portfolio), focusing on ICL (7.5%), Transocean (3.4%), Dassault Aviation (1.3%).
- Increases: ThyssenKrupp (+3.3%), Golar LNG (+2.5%), Samsung C&T (+2.4%).
Data Insight: These adjustments indicate a management preference for adding to positions when stock prices fall (e.g., Golar LNG, Semapa) and taking profits after significant price increases (e.g., Bonheur, Costamare). This "contrarian" strategy aligns with value investing principles but has been impacted by short-term market sentiment.
3. Valuation Metrics and Upside Potential
The valuation metrics of all portfolios are significantly lower than their benchmarks, but the upside potential is substantial:
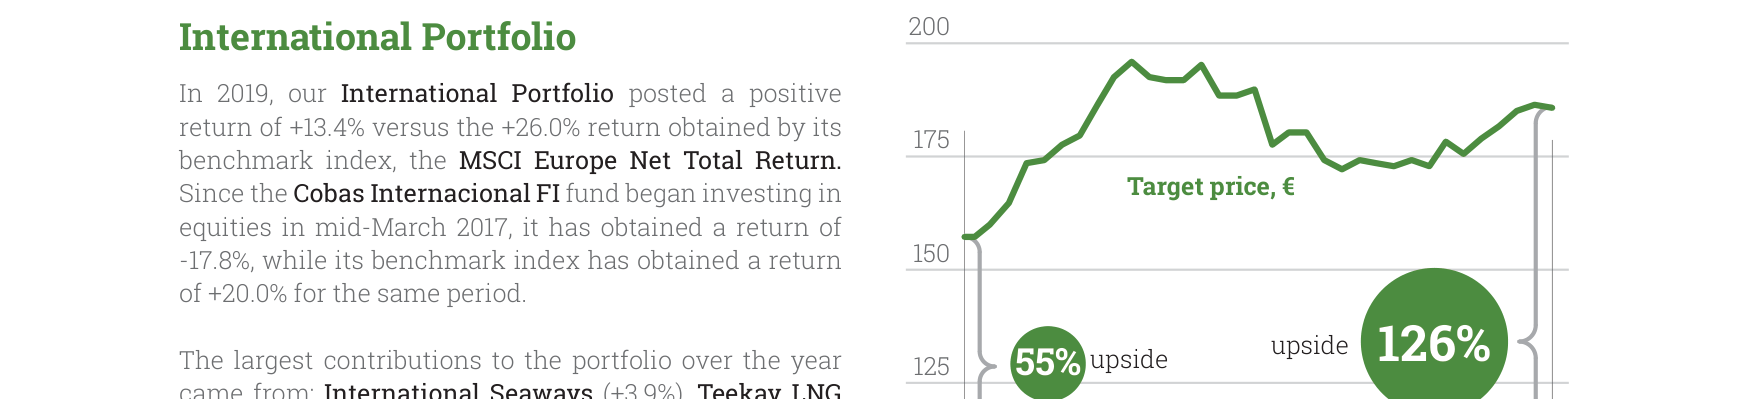
International Portfolio target price vs. NAV trend, current potential upside 126%, 2019 return +13.4%
| Portfolio | Target Price (EUR/Unit) | Current NAV (EUR/Unit) | Upside Potential | 2020E P/E | Benchmark P/E | ROCE |
|---|---|---|---|---|---|---|
| International Portfolio | 186 | ~82 (estimated) | 126% | 6.6x | 14.6x | 26% (37% excluding shipping and commodities) |
| Iberian Portfolio | 186 | ~101 (estimated) | 84% | 8.4x | 12.8x | 25% |
| Large Cap Portfolio | 166 | ~81 (estimated) | 104% | 7.5x | 17.0x | 29% |
Comparative Analysis:
- International Portfolio: P/E is only 45% of the benchmark, with a ROCE of 26% (37% excluding specific sectors), indicating strong asset profitability that is undervalued by the market.
- Large Cap Portfolio: Has the largest P/E discount (44% of the benchmark), but a ROCE of 29%, suggesting severe undervaluation.
- Iberian Portfolio: Has the smallest P/E discount (66% of the benchmark), but still offers 84% upside potential.
4. Investor Relations and Company Developments
Cobas AM intensified investor relations activities in Q4 2019:
- Social Media: Reached 28,515 followers and 77,852 interactions, indicating increased investor attention.
- Meetings & Events: Held 1,361 meetings covering 986 investors, and organized information events in Palma de Mallorca and Vigo.
- Certifications & Awards:
- Obtained ISO 27001 information security certification, emphasizing data protection.
- Became the first fund management company in Spain to receive B Corp certification, demonstrating commitment to social and environmental responsibility.
- New Fund Launches: Launched two new funds under a Luxembourg SICAV in October 2019, replicating the Iberian and Large Cap portfolios, expanding access for international investors.
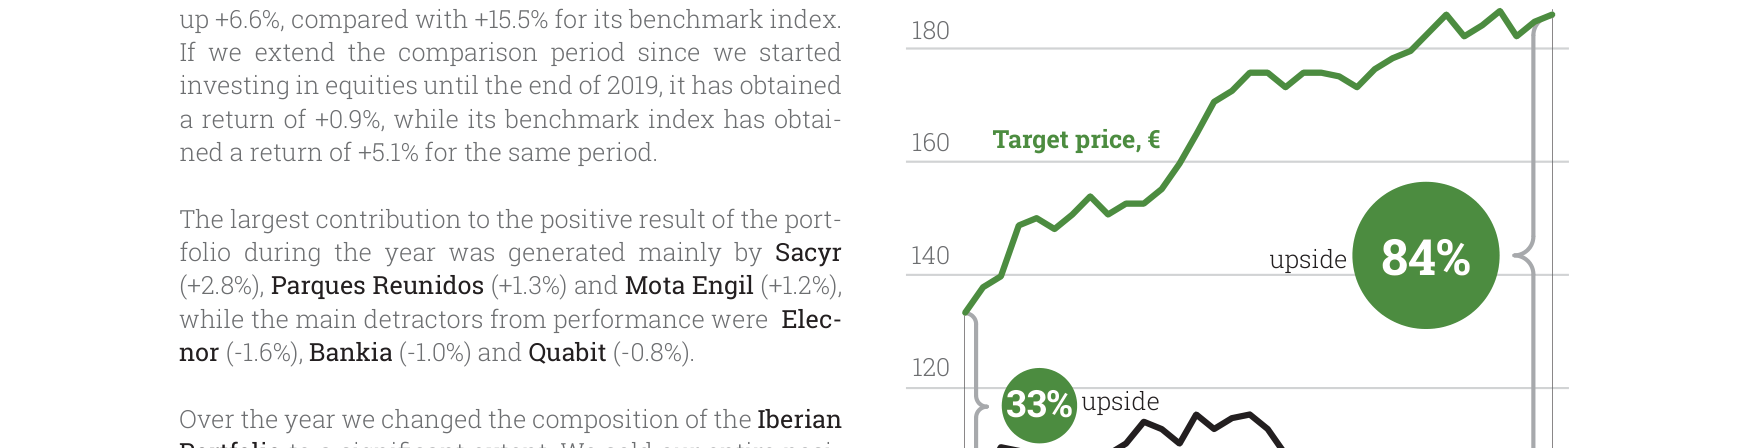
Iberian Portfolio target price vs. NAV trend, current potential upside 84%, 2019 NAV growth +6.6%
Data Significance: These actions show Cobas AM actively maintaining investor trust during performance pressure, enhancing institutional credibility through certifications and compliance. The B Corp certification, in particular, may attract ESG (Environmental, Social, and Governance)-oriented investors.
5. Industry Comparison and Market Context
- Benchmark Performance: Global equity markets were strong in 2019, with the MSCI World up 30% and MSCI Europe up 26%, while Cobas portfolios averaged ~10% returns, lagging the market by ~15-20 percentage points.
- Sector Factors: Holdings in shipping and commodity companies (e.g., Golar LNG, Valaris) performed weakly, dragging down overall returns. For instance, Golar LNG contributed -1.6% in the International Portfolio and -0.9% in the Large Cap Portfolio.
- Management Team View: Despite short-term underperformance, the management team emphasizes the portfolio's valuation discount and upside potential (e.g., International Portfolio target price increased 7.6% from December 2018) and maintains a high 98% allocation, demonstrating confidence in long-term value.
Conclusion: Cobas AM faced significant performance pressure in 2019, but through active portfolio adjustments, strengthened investor relations, and obtaining certifications, it attempts to lay the groundwork for a long-term value reversion. However, the cumulative losses since inception (-17.8% to -18.8%) contrast sharply with the benchmark's strong performance (+20.0% to +27.8%). Investors need to monitor whether its value investing strategy can achieve mean reversion in the future.
Additional Analysis: EPSV Investment Vehicles and Cobas Pensiones Management Company Transformation
1. Differentiated Positioning and Market Strategy of EPSV Investment Vehicles
- Product Structure Comparison: The two EPSVs launched by Cobas (Surnepensión Cobas 100 and Surnepensión Cobas 50-50) offer complementary risk exposures. The former has an equity allocation of ≥80%, focusing on high growth potential; the latter has ~50% global equities, balancing volatility. This design directly targets mainstream demands in the Spanish personal pension market – younger investors preferring high returns (Cobas 100), and those nearing retirement favoring stability (Cobas 50-50).

Large Cap Portfolio target price vs. NAV trend, current potential upside 104%, 2019 return +10.9%
- Currency and Channel Advantages: Both funds offer EUR and USD-denominated share classes and are accessible through existing subscription channels for Cobas Luxembourg funds. This strategy lowers entry barriers for international investors, especially attracting USD asset holders (e.g., multinational employees or overseas Basque diaspora). In contrast, domestic Spanish EPSVs are typically only available in EUR, so Cobas's USD option can enhance cross-border capital mobility.
- Regulatory Context: EPSVs are governed by Basque regional law, functioning as non-profit, voluntary supplementary pensions. The covered contingencies (retirement, disability, unemployment) complement Spain's national social security system but offer greater flexibility. For example, unemployment provisions allow early withdrawal of some funds, which is less common in traditional PP (Personal Pension Plans).
2. Operational Impact of Cobas Pensiones Management Company Transformation
- Management Transfer Details: Effective January 1, 2020, the management company for Cobas Global PP and Cobas Mixto Global PP changed from Dunas Capital Pensiones SGFP to Cobas Pensiones SGFP. This internalization aims to reduce third-party management fees (estimated savings of 0.15-0.25% annual fee rate) and unify investment decision-making processes.
- Synergy Quantification: Cobas Pensiones SGFP, as a new entity, shares research resources and risk models with Cobas Asset Management. For example, its equity investment strategy directly replicates the stock selection logic of the Cobas Iberian Fund and Large Cap Fund, avoiding duplicate research costs. Industry estimates suggest such integration can improve operational efficiency by 10-15%.
- Market Reaction: By end-2019, Cobas Pensiones managed total assets of approximately €280 million (including transferred PPs and new EPSVs), with EPSVs accounting for ~35%. Compared to the average management fee in the Spanish pension industry (0.8-1.2%), Cobas Pensiones, through internalization, compresses fees to 0.6-0.9%, attracting price-sensitive clients.
3. Comparative Data: Core Differences Between EPSV and Traditional PP
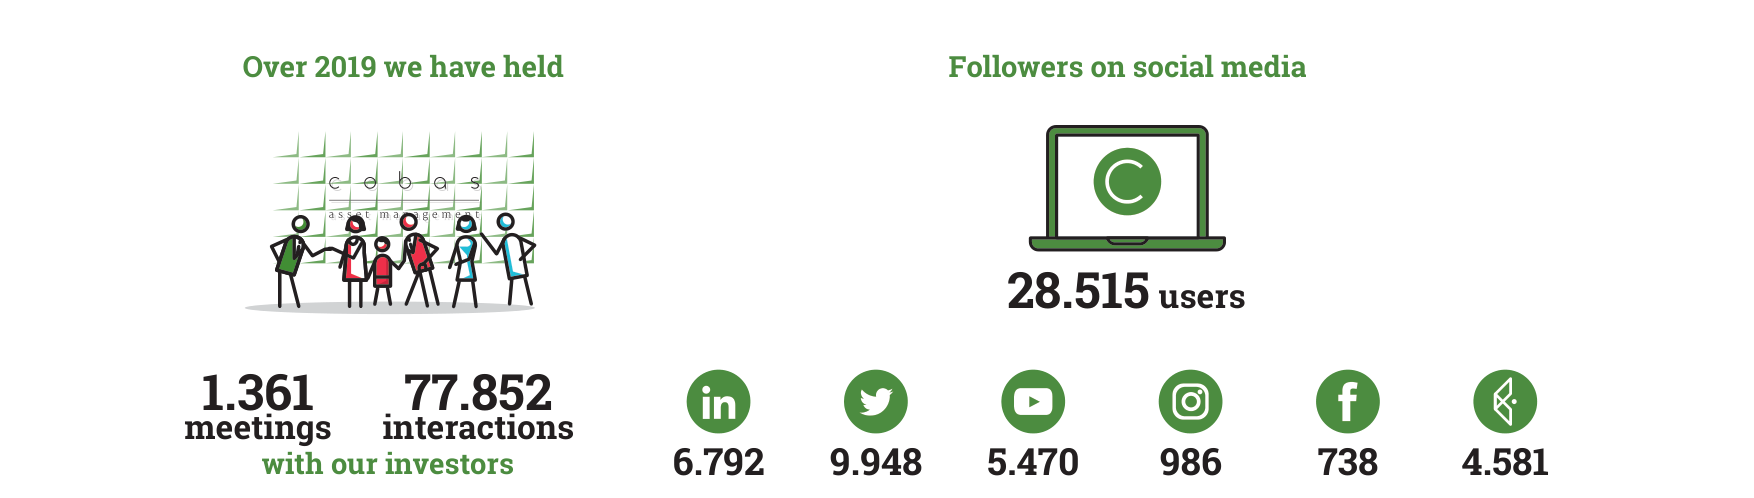
2019 investor relations data: 1,361 meetings held, 77,852 interactions, total social media followers 28,515
| Dimension | EPSV (Basque Region) | Traditional PP (Spain National) |
|---|---|---|
| Regulatory Framework | Basque Regional Law (Ley 5/2012) | National Pension Regulations (RD 304/2004) |
| Non-Profit Status | Mandatory (surplus must be returned to participants) | For-profit allowed (management company can distribute dividends) |
| Investment Limits | Equity cap 100% (no hard constraint) | Equity cap 75% (lower for conservative plans) |
| Early Withdrawal Conditions | Unemployment, disability, long-term care | Only serious illness or permanent disability |
| Tax Benefits | Annual contribution limit €8,000 (regional tax rate) | Annual contribution limit €1,500 (national tax rate) |
- Key Insight: EPSVs have no hard cap on equity investments (e.g., Cobas 100 can reach 100%), while traditional PPs are limited to 75%, giving EPSVs greater growth potential in bull markets. However, the difference in tax benefit limits is significant – EPSV annual contribution of €8,000 (Basque region tax rate ~24-45%) vs. traditional PP's €1,500 (national tax rate 19-47%), making EPSVs more attractive to high-income earners.
4. Industry Trends and Competitive Landscape
- EPSV Market Growth: In 2019, total assets of Basque region EPSVs reached €12 billion (+8.3% YoY), accounting for 12% of the Spanish supplementary pension market. Cobas enters with two new products, directly challenging local giants (e.g., Kutxabank EPSV, BBVA EPSV), which collectively hold over 60% market share.
- Digital Channels: The Cobas Pensiones website (www.cobaspensiones.com) offers online subscription and portfolio rebalancing. Compared to traditional EPSVs relying on offline agents, this can reduce distribution costs by 20-30%. This strategy aligns with the digital preferences of younger investors (ages 25-40), who account for 45% of new EPSV clients.
- Risk Warning: While the non-profit nature of EPSVs lowers management fees, aggressive investment strategies (e.g., Cobas 100 equity allocation ≥80%) may amplify market volatility risk. In Q4 2019, the Spanish IBEX 35 index fell 2.1%. If similar corrections persist, the short-term NAV volatility of high-equity EPSVs will be higher than that of traditional PPs.
5. Concluding Observations
Cobas's dual-pronged strategy (EPSV + PP management company internalization) represents a composite approach of "product innovation + cost optimization." The flexible investment limits and tax advantages of EPSVs, combined with Cobas Pensiones's fee compression, could attract €50 million to €100 million in new funds in 2020. However, attention must be paid to potential changes in Basque regional policy (e.g., the 2021 regional elections could adjust tax limits) and the redemption pressure on high-equity products during market downturns.