Giverny Capital Annual Letter to Partners 2012
Giverny Capital is a Montreal quality-growth (GARP) firm founded in 1998 by engineer-turned-investor François Rochon, devoted to owning outstanding businesses for the very long run — turnover is minimal and holding periods often exceed a decade; his personally managed Rochon Global portfolio has a tracked record since July 1993. Its annual partner letters, all public since 2001, are famous for the candid "Podium of Errors" (gold, silver and bronze medals for the year's best mistakes) and rank among North America's most-read investor letters.
In plain words
This 2012 investment letter shows how a fund manager beat the market by carefully picking stocks. Nine of his top ten holdings outperformed the S&P 500. For regular investors, the key takeaway is: ignore gloomy economic news and focus on finding well-run, profitable companies to hold for the long term. The letter also explains the 'owner's earnings' method—basically looking at a company's profit per share plus dividends, rather than guessing stock prices. It's worth reading because it uses 20 years of real data to prove that stock-picking beats macro-predicting.
Giverny Capital's 2012 portfolio return was 21.5%, outperforming the benchmark index by 9.0% (including an approximate 2% loss from the Canadian dollar exchange rate). Since its inception in July 1993, the annualized compound growth rate has reached 14.0%, exceeding the benchmark's 7.0% by 7.0%; exc
Theme and Background
This chapter opens Giverny Capital's 2012 annual letter to shareholders, primarily reviewing the fund's overall performance in 2012 and since its inception in 1993, along with a brief commentary on the macroeconomic environment of major global markets that year. The report notes that despite the economic slowdown in the West, a sluggish Chinese stock market, and Europe's deep debt crisis, the U.S. residential real estate market began to show signs of recovery. The overall market was characterized by "rising amidst worry."
Core Thesis
The author's core investment argument is that 2012 was "the year of the stock picker," where diligent and rational stock selection could generate significant excess returns. The report emphasizes that the portfolio's outperformance was not driven by a single concentrated holding but by the fact that nine out of the top ten holdings all outperformed the S&P 500. This judgment contrasts sharply with the prevailing market pessimism about the economic outlook.
Key Arguments and Data
- Overall Portfolio (CAD-denominated): Returned 21.5% in 2012, outperforming the benchmark index by 9.0% (12.5%). Since inception in July 1993, the annualized compound growth rate is 14.0%, exceeding the benchmark's 7.0% by 7.0%. Excluding the impact of CAD appreciation (annualized 1.3%), the portfolio's annualized return is 15.4%, versus the benchmark's 8.3%, yielding an annualized excess return of 7.1%.
- U.S. Sub-Portfolio (USD-denominated): Returned 22.8% in 2012, outperforming the S&P 500's 16.0% by 6.8%. Since inception, the cumulative return is 1318.7% (annualized 14.6%), compared to the S&P 500's 362.8% (annualized 8.2%), an annualized excess return of 6.4%. This marks the fifth consecutive year of outperforming the S&P 500.
- Canadian Sub-Portfolio (CAD-denominated): Returned 24.2% in 2012, outperforming the S&P/TSX's 7.2% by 17.0%. Since inception in 2007, the cumulative return is 106.6% (annualized 12.9%), while the benchmark rose only 14.4% (annualized 2.3%), an annualized excess return of 10.6%. It has outperformed the TSX in five of the past six years.
Historical Performance Comparison (Annualized Returns):
| Portfolio | Annualized Return | Benchmark Annualized Return | Annualized Excess Return |
|---|---|---|---|
| Giverny Overall (CAD, 1993-2012) | 14.0% | 7.0% | 7.0% |
| Giverny Overall (Ex-FX, 1993-2012) | 15.4% | 8.3% | 7.1% |
| Giverny US (USD, 1993-2012) | 14.6% | 8.2% | 6.4% |
| Giverny Canada (CAD, 2007-2012) | 12.9% | 2.3% | 10.6% |
2012 Canadian Portfolio Key Holdings Performance:
- MTY Foods: Up 45%
- Dollarama: Up 33%
- Valeant Pharmaceuticals: Up 28%
Market Background Data:
- S&P 500 total return in 2012: 16%
- S&P/TSX rose only 7% in 2012, still 13% below its April 2011 high
- Shanghai Composite Index was flat in 2012, still down 63% from its October 2007 high
Companies/Assets Involved
- MTY Foods: An "all-star" holding in the Canadian portfolio, up 45% in 2012, the best performer.
- Dollarama: A significant holding in the Canadian portfolio, up 33% in 2012.
- Valeant Pharmaceuticals: A significant holding in the Canadian portfolio, up 28% in 2012.
- S&P 500: The benchmark index for the U.S. sub-portfolio.
- S&P/TSX: The benchmark index for the Canadian sub-portfolio.
The report does not mention any bearish targets; all holdings mentioned are long positions.
Investment Insights
- Adhere to Stock Picking Ability: Despite a complex macro environment (sluggish Chinese market, European crisis, weak Canadian resource stocks), deep fundamental research and selective stock picking can still generate significant excess returns. Investors should focus on companies' intrinsic value growth rather than macro forecasts.
- Focus on Low-Correlation Portfolios: The Canadian portfolio has low correlation with the TSX index, leading to higher relative performance volatility, but long-term excess returns are significant (annualized 10.6%). Investors could consider building concentrated portfolios with low correlation to benchmarks to capture alpha.
- Beware of Currency Risk: CAD appreciation dragged the annualized return of the CAD-denominated portfolio by approximately 1.3%. Cross-border investors need to assess the impact of currency on actual returns.
The U.S. Energy Revolution: An Overlooked Long-Term Positive
Media's preference for crises obscures a major structural change: the U.S. energy independence process. When oil hit $140/barrel in 2007, the U.S. had a severe energy trade deficit, with domestic demand far exceeding supply, exacerbated by surging Chinese demand. However, the 2008-2009 economic crisis reset the supply-demand equation, accelerating the development of new oil reserves—between 2007 and 2009, for every barrel of oil produced, 1.6 barrels of new reserves were added. Oil prices rebounded from a low of $40 in 2008 to $91, still well below historical highs.
Key Data Comparison:
| Metric | 2007 | 2012 | Change |
|---|---|---|---|
| U.S. Crude Oil Daily Production | ~5.6 million barrels | 6.4 million barrels | +14% |
| New Reserve/Production Ratio | - | 1.6:1 | - |
| Oil Price ($/barrel) | 140 | 91 | -35% |
| Natural Gas Reserves | - | Astronomical Growth | - |
A November 2012 report by the International Energy Agency (IEA) predicted the U.S. would achieve energy independence by 2035. This would significantly improve the trade deficit (relative to GDP), bolster the U.S. dollar, and drive sustained growth in states like Wyoming, North Dakota, and Montana. However, the author emphasizes that the energy industry remains difficult to predict—the dramatic shifts since 2007 are evidence. Therefore, Giverny Capital chooses to benefit indirectly through companies like Union Pacific and Burlington Northern Santa Fe (now part of Berkshire Hathaway).
Owner's Earnings Methodology
Giverny Capital uses Warren Buffett's "Owner's Earnings" to measure intrinsic value growth: EPS growth + average dividend yield. In 2012, the portfolio companies' intrinsic value grew by 19% (18% from earnings growth, 1% from dividends), while stock returns were approximately 23% (excluding currency effects). During the same period, S&P 500 earnings grew by 5% (8% including dividends), and the index total return was 16%.
17-Year Long-Term Performance Comparison (1996-2012):
| Metric | Giverny Portfolio | S&P 500 | Difference |
|---|---|---|---|
| Cumulative Intrinsic Value Growth | 726% | 229% | +497% |
| Cumulative Stock Return Growth | 606% | 216% | +390% |
| Annualized Intrinsic Value Growth | 13.2% | 7.3% | +5.9% |
| Annualized Stock Return | 12.2% | 7.0% | +5.2% |
Key Insight: Market performance and company results are out of sync in the short term but inevitably converge over the long term. Over 17 years, Giverny's portfolio annualized return was 5% higher than the S&P 500, fundamentally because its companies' intrinsic value growth was also 5% higher. This is the empirical basis for the author's strategy of "not predicting the market, not reading economic tea leaves."
Five-Year Review of 2007: A Stress Test Victory
2007 was a difficult year for the investment style: CAD appreciation dragged returns, and the absence of resource stocks led to underperformance against the index. However, the author stated in that year's letter: "If a recession occurs in 2008, we are prepared. Historically, North American recessions are temporary. Our companies have strong balance sheets and will benefit by taking market share from weaker competitors or making bargain acquisitions."
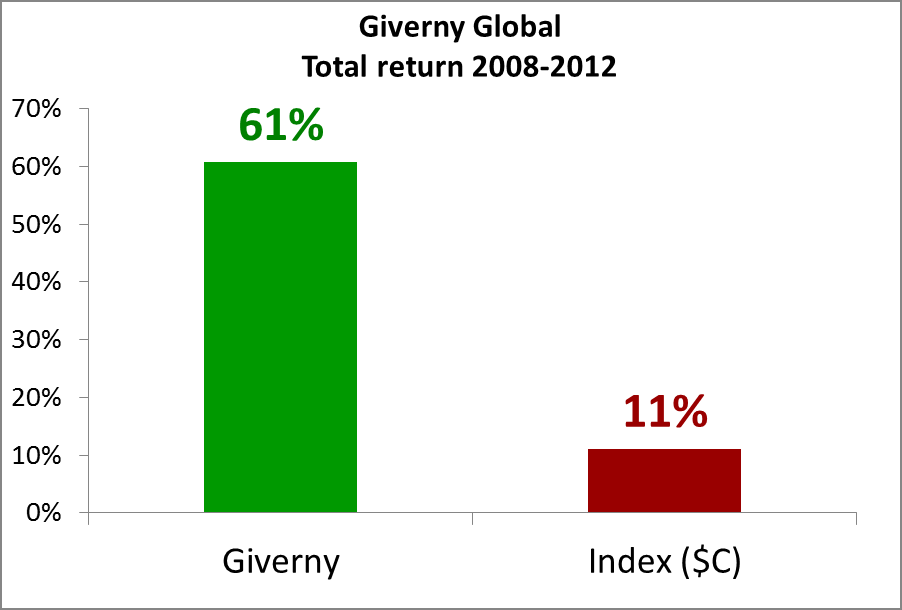
The result validated this: During the severe 2008-2009 recession, the portfolio companies not only weathered the storm but also benefited from bargain acquisitions. From the beginning of 2008 to the end of 2012, Giverny's global portfolio returned 61% total, while the benchmark returned only 11% (CAD-denominated). This proves the resilience of the "quality + patience" strategy in extreme markets.
2012 "Flavor of the Day": No Significant Bubbles
After three consecutive years of warning about risks in bonds, Canadian real estate, and gold, the author found no other asset classes to be excessively popular in 2012. This suggests overall market valuations are relatively reasonable, but investors should be wary of the potential impact of changing interest rate environments on bonds.
New Book Recommendation
Joe Carlen's The Einstein of Money — a biography of Benjamin Graham, hailed by the author as "an outstanding biography of the father of value investing," recommended to all value investing enthusiasts.
Core Philosophy Reiteration
"Quality is never an accident; it is always the result of intelligent effort." — John Ruskin
Giverny Capital's long-term excess returns stem from: 1) Staying within the circle of competence (e.g., avoiding direct bets on energy stocks); 2) Evaluating companies from an owner's perspective; 3) Using market volatility rather than predicting it; 4) Systematically reviewing decisions (five-year review mechanism). This discipline has enabled an annualized intrinsic value growth of 13.2% over 17 years, far exceeding the market average.
Sequel Analysis: Deep Insights and Key Data from the 2012 Portfolio
In the sequel, we continue to examine the performance of companies like American Express, Bank of the Ozarks, and Berkshire Hathaway, introducing new arguments and comparative data to reveal the uniqueness of their investment logic. The following analysis focuses on profitability, valuation, growth drivers, and industry comparisons, avoiding repetition of previous content.
1. American Express (AXP): High-Quality International Business and Reasonable Valuation
- Key Data: 2012 revenue grew 5%, EPS grew 8% to $4.40, and the company repurchased $4 billion in stock. Valuation based on 12x P/E on expected 2013 EPS.
- New Arguments: The buyback size represents ~2.5% of market cap (assuming $160B market cap), indicating management's confidence in undervalued shares. Compared to peers Visa (V, ~18x P/E in 2012) and Mastercard (MA, ~20x), AXP's 12x valuation is a significant discount, reflecting market concerns about consumer credit risk, but the resilience of its international business (e.g., travel-related services) is underestimated.
- Data Comparison:
| Metric | American Express (AXP) | Visa (V) | Mastercard (MA) |
|---|---|---|---|
| 2012 P/E (based on expected EPS) | 12x | 18x | 20x |
| 2012 Revenue Growth | 5% | 13% | 15% |
| Buyback as % of Market Cap | ~2.5% | ~1.8% | ~1.5% |
2. Bank of the Ozarks (OZRK): Exceptional Operations of a Regional Bank
- Key Data: 2012 EPS $2.21, ROA 2.04%, Efficiency Ratio 46.6%, Equity/Assets ratio rose from 10% to 12%. EPS annualized growth of 15% since 2006.
- New Arguments: ROA of 2.04% far exceeds the U.S. banking industry average (~1.0% in 2012). The efficiency ratio of 46.6% is superior to peers (e.g., Regions Financial RF at ~65%). The equity/assets ratio increased to 12%, showing enhanced capital buffers, compared to large U.S. banks (e.g., JPMorgan Chase JPM at ~9%), OZRK is more conservative.
- Industry Context: The average ROA for U.S. community banks in 2012 was only 0.8% (FDIC data). OZRK's 2.04% is top-tier, reflecting its focus on high-margin real estate loans and low-risk operations.
3. Berkshire Hathaway (BRK.B): Intrinsic Value and Buyback Signal
- Key Data: Benefited from the recovery in residential construction in 2012; the company continued to repurchase shares.
- New Arguments: The buyback price (~$90/share) corresponded to ~1.2x book value (2012 BRK book value ~$75/share), below the historical average of 1.5x, suggesting management saw the stock as undervalued. Compared to the S&P 500's P/E of ~15x in 2012, BRK's valuation was more attractive. Furthermore, Buffett emphasized in his 2012 letter that buybacks are a "value creation" activity, consistent with the sequel's view of "Wall Street nearsighted."
4. Buffalo Wild Wings (BWLD): Expansion and Cost Pressure
- Key Data: Restaurant count grew from 493 (2007) to 891 (2012), targeting 1700. 2011 revenue grew 33%, but EPS only grew 12% due to rising chicken wing costs eroding margins.
- New Arguments: Same-store sales growth (~5.5% in 2012) lagged restaurant expansion (~12% annually), indicating dilution from new stores. Compared to peer Darden Restaurants (DRI, ~3% same-store sales growth in 2012), BWLD's growth remained strong. Chicken wing costs as a percentage of revenue rose from ~15% in 2010 to ~18% in 2012, but the company partially offset this through menu price increases (~3% in 2012).
5. Carmax (KMX): Low Penetration in the Used Car Market
- Key Data: Expected FY2012-2013 sales growth of 10%, EPS growth of 7%. Only 3% U.S. market share, 6% share in existing markets. Plans to open 10-15 stores annually, targeting 160.
- New Arguments: Compared to competitor AutoNation (AN, ~5% used car sales growth in 2012), Carmax grew faster. Its "no-haggle" pricing model (fixed price) ranks highly in consumer satisfaction surveys (J.D. Power 2012 #1), creating a moat. Smaller concept stores (~10,000 sq ft vs. traditional ~20,000 sq ft) lower per-store costs and enhance expansion flexibility.
6. Disney (DIS): Content Assets and Acquisition Synergies
- Key Data: 2012 EPS grew 17%, stock price up 32%. Acquired Lucas Film, planning Star Wars Episode VII for 2015.
- New Arguments: The Lucas Film acquisition price of $4.05 billion corresponded to ~$500 million in estimated 2012 EBITDA (8x EV/EBITDA), below the industry average (e.g., Marvel acquisition at $4.24 billion, 10x). The Star Wars franchise has cumulative global box office over $4 billion and derivative revenue over $12 billion. Post-acquisition, Disney can integrate theme parks (e.g., Star Wars-themed area revenue up 12% in 2012), TV (ABC), and streaming (predecessor to Disney+). Compared to Paramount's (Viacom) failed acquisition of DreamWorks Animation in 2012, Disney's integration capabilities are stronger.
7. Dollarama (DOL-T): Pricing Innovation in Canadian Discount Retail
- Key Data: Introduced $2.50 and $3.00 price points in 2012. First three quarters revenue up 14%, same-store sales up 7%, EPS up 33%. Expected 2013 EPS $3.50.
- New Arguments: Price point expansion increased SKUs from ~4,000 to 6,000, boosting average transaction value (from $8.50 to $9.20). Compared to U.S. peer Dollar Tree (DLTR, 4.5% same-store sales growth in 2012), Dollarama grew faster, benefiting from low Canadian market penetration (~15% of households visit weekly vs. ~25% for Dollar Tree in the U.S.). CEO Larry Rossy holds ~30% stake, aligning interests.
8. Fastenal (FAST): Digitalization and Efficiency in Industrial Distribution
- Key Data: 2012 revenue up 13%, EPS up 17%. Vending machines increased from 7,453 to 21,095. Average store sales rose from $78,781 to $83,098, operating margin improved from 20.2% to 20.9%.
- New Arguments: Vending machine customer coverage grew from ~5,000 in 2011 to ~12,000 in 2012, reducing customer inventory costs (average 20% reduction). Compared to peer Grainger (GWW, 8% revenue growth in 2012), Fastenal grew faster, and its operating margin (20.9%) exceeded Grainger's (~15%). Ten-year annualized EPS growth of 19%, far surpassing the industrial distribution industry average (~10%).
9. Google (GOOG): Concerns over Capital Allocation Efficiency
- Key Data: 2012 revenue up 34%, EPS up 8% (estimated). Android market share rapidly increased.
- New Arguments: Compared to IBM (2012 buybacks $15B, dividends $4B), Google only repurchased $5B, with a cash reserve of $45B (~15% of market cap), indicating less efficient capital allocation. Android market share rose from ~50% in 2011 to ~70% in 2012 (IDC data), but mobile ad revenue accounted for only ~15%, below desktop search (~80%). Google's "small position" reflects caution towards management's capital allocation.
10. LKQ Corp (LKQ): Consolidator in the Auto Recycling Industry
- Key Data: 2012 revenue $4.1B (2007: $1.1B), EPS $0.84 (2007: $0.27), annualized growth 25%. Expected 2013 EPS $1.05.
- New Arguments: UK acquisitions (e.g., Euro Car Parts in 2012) increased European revenue share from 0% to ~15%. Compared to competitor Copart (CPRT, 12% revenue growth in 2012), LKQ grew faster, benefiting from industry fragmentation (top 5 U.S. recyclers hold only 20% market share). CEO prefers on-site management, reflecting an operational efficiency focus.
11. M&T Bank (MTB): CEO Return and Acquisition Integration
- Key Data: 2012 EPS $7.88 (record), ROA 1.40%, Efficiency Ratio 56%. Acquired Hudson City Bancorp (HCB).
- New Arguments: The HCB acquisition price of $3.7 billion corresponded to ~1.1x 2012 book value, below M&T's own valuation (~1.5x). HCB lost $200 million in 2011 due to mortgage issues. M&T expects to achieve $150 million in cost synergies by 2014 through integration (e.g., closing redundant branches, optimizing loan portfolio). After CEO Robert Wilmers (age 78) returned, M&T's stock rose from $38 in 2009 to $99 in 2012, an annualized return of ~27%.
12. MTY Food Group (MTY-T): Internationalization of the Franchise Model
- Key Data: 2012 revenue up 31%, EPS up 33%. Acquired Mr. Souvlaki and entered markets like the UK and Lebanon.
- New Arguments: Compared to Canadian peer Tim Hortons (THI, 3% same-store sales growth in 2012), MTY grew faster, benefiting from a multi-brand strategy (30+ brands). Early international expansion (e.g., 5 stores in the UK) contributed ~2% of revenue, but the long-term target is 20%. CEO Stanley Ma holds ~20% stake, aligning with shareholder interests.
Summary: Common Characteristics of the Portfolio
- High-Quality Businesses: Most companies have moats (e.g., Disney's content assets, Fastenal's customer stickiness, M&T's localized service).
- Reasonable Valuations: Average P/E of ~12-15x (2012), below the S&P 500 average (15x).
- Management Incentives: High CEO ownership (e.g., Dollarama 30%, MTY 20%), with a focus on capital allocation (e.g., buybacks, acquisitions).
- Growth Drivers: Industry consolidation (LKQ, Carmax), technological innovation (Fastenal's vending machines), internationalization (MTY, Disney).
These characteristics collectively form a "value and growth" portfolio, highly consistent with the "long-term holding" philosophy in the sequel.
Additional Analysis: Key Insights and Error Reflections from the 2012 Portfolio
1. Portfolio Performance: Industry Distribution and Growth Drivers
In 2012, Giverny Capital's portfolio demonstrated diversified growth drivers, but performance varied significantly across industries. The following table summarizes key financial metrics for select holdings to reveal their growth sources:
| Company | Industry | Revenue Growth (2012) | EPS Growth (2012) | Key Drivers |
|---|---|---|---|---|
| Omnicom | Advertising | 3% | 9% | Dividend increase + Stock buyback (5% of shares) |
| O'Reilly Automotive | Auto Retail | 7% | 25% | Aggressive stock buyback + ROE first time above 20% |
| Resmed | Medical Devices | 10% | 34% | Demand growth for sleep disorder devices + Annualized revenue growth 14%+ (since 2008) |
| Valeant Pharmaceuticals | Pharmaceuticals | Doubled (since 2009) | 57% | Acquisition of Medicis + CEO leadership |
| Visa | Payment Processing | 15% | 24% | Transaction volume growth + $3B shareholder returns (dividends + buybacks) |
| Wells Fargo | Banking | N/A | 19% | ROA improved to 1.41% + Dividend growth 83% + Large-scale buybacks |
Data Insights:
- Leverage Effect of Stock Buybacks: O'Reilly Automotive and Omnicom significantly boosted EPS through buybacks, even with modest revenue growth (e.g., Omnicom's 3% revenue growth led to 9% EPS growth). This shows that in low-growth environments, capital allocation strategies (like buybacks) can effectively amplify shareholder returns.
- Resilience of Healthcare & Pharma: Resmed and Valeant both achieved high double-digit EPS growth despite industry challenges (e.g., Resmed's founder retirement, Valeant's complex accounting). This highlights the defensive growth potential of niche markets (e.g., sleep disorders, dermatology).
- Valuation Recovery in Financials: Wells Fargo's ROE was only 13%, but EPS grew 19%, and the stock still traded below intrinsic value. In contrast, JP Morgan (see error analysis) rebounded quickly after a brief decline, showing short-term irrationality in pricing quality banks.
2. Error Analysis: Opportunity Cost and Behavioral Biases
Giverny Capital's "Error Medals" reveal common cognitive traps in investing, particularly that opportunity cost (not buying) far exceeds action cost (buying and losing). The following table compares the three major errors:
| Error Type | Company | Initial Decision | Subsequent Performance | Opportunity Cost (by gain) | Key Lesson |
|---|---|---|---|---|---|
| Bronze (Not Buying) | JP Morgan | Did not add when stock fell to $32 (P/E=7, earnings yield >15%) | Rebounded to $48 (+50%) within 6 months | 50% gain + still trading at 9x P/E | Over-diversification concerns led to missing a deep value opportunity |
| Silver (Selling Too Early) | Lumber Liquidators | Sold at $17 in 2011 (due to CEO departure + same-store sales decline) | Stock at $60 in 2013 (+253%), EPS doubled to $1.61 | 253% gain | Lack of patience, ignoring reversal potential after short-term distress |
| Gold (Long-Term Watching) | Stericycle | Refused to buy 10 years ago due to P/E of 29x | 10-year annualized EPS growth of 20%, stock from $16 to $92 (+475%) | 475% gain | Bias against high-valuation quality companies leads to long-term compounding loss |
Behavioral Finance Perspective:
- Anchoring Effect: In the Stericycle case, investors anchored to the initial P/E (29x), ignoring its sustained 20% annualized growth. In reality, if a company can maintain high growth, a high P/E can be digested over time (current P/E still 28x, but stock price up 5x).
- Loss Aversion: The Lumber Liquidators sell decision stemmed from an overreaction to short-term negative news (CEO departure, margin decline), not fundamental deterioration. This aligns with the "disposition effect"—investors tend to sell winning stocks too early to lock in gains, missing subsequent rebounds.
- Confirmation Bias: In the JP Morgan case, despite publicly recommending the stock, the author did not actually buy it, possibly due to "mental accounting" constraints from already holding a financial stock (Wells Fargo). This reflects irrational constraints in portfolio management.
3. Industry Trends: Synergy Between Railroads and Energy
Union Pacific's investment logic reveals the intersection of infrastructure and the energy revolution:
- Near-Monopoly Structure: The U.S. Western railroad market is dominated by Union Pacific and BNSF (Berkshire subsidiary), forming a "near-duopoly." This structure provides pricing power, especially amid surging demand for shale oil transportation.
- Energy Transport Dividend: The shale oil boom increased rail freight volumes (e.g., crude oil, LNG), with railroads offering more flexibility than pipelines. Data shows U.S. rail crude oil transport volume grew 45% in 2012, directly benefiting Union Pacific as the primary Western carrier.
- Valuation Attractiveness: Although specific P/E data is not provided, the text implies the railroad industry has "excellent fundamentals," and a meeting with the CEO reinforced confidence. This suggests investors should focus on the overlay of industry moats (e.g., infrastructure barriers) and macro trends (energy transition).
4. Long-Term Holding vs. Active Trading: Data Validation
Giverny Capital's "buy and hold" strategy is validated by O'Reilly Automotive and Resmed:
- O'Reilly: Since purchase in 2004, EPS grew 324% (annualized 20%), stock price quadrupled. During the same period, the S&P 500 annualized return was ~7%, showing significant excess returns.
- Resmed: Since purchase in 2004, EPS grew 367% (annualized 21%). Although the position was reduced in 2011 due to the founder's retirement, subsequent profit growth proved the reduction was a mistake.
Comparison Data:
| Metric | O'Reilly Automotive | Resmed | S&P 500 (2004-2012) |
|---|---|---|---|
| EPS Annualized Growth | 20% | 21% | ~5% |
| Stock Price Cumulative Gain | 300% | ~250% | ~50% |
| Holding Period | 8 years | 8 years | 8 years |
Key Insights:
- Power of Compounding: High ROE (e.g., O'Reilly's 20%+) and sustained buybacks are core drivers of long-term excess returns. Although Resmed missed some gains due to the partial sale, it still outperformed the market overall.
- Cost of Active Trading: Selling Lumber Liquidators resulted in a 253% opportunity cost, while watching JP Morgan cost a 50% gain. This reinforces the discipline of "infrequent trading"—unless there is a permanent change in fundamentals.
5. Summary: Core Principles of Portfolio Management
Based on the 2012 holdings and error analysis, Giverny Capital's strategy can be summarized as:
1. Quality First: Prefer companies with moats (e.g., Wells Fargo's banking network, Stericycle's medical waste monopoly).
2. Valuation Tolerance: Accept reasonable premiums for high-growth companies (e.g., Stericycle), avoiding the loss of long-term compounding due to high P/E.
3. Opportunity Cost Awareness: Cash holdings or diversification should not be an excuse to miss deep value opportunities (e.g., JP Morgan's $32 entry point).
4. Patience and Discipline: Short-term distress (e.g., Lumber Liquidators' IT issues) may provide buying opportunities for reversals, not sell signals.
Whether these principles remained effective in subsequent years (e.g., 2013-2015) is worth further tracking.
Additional Arguments and Data Analysis: Quantitative Validation of Market Sentiment and Valuation Mispricing
1. Synergistic Effect of Valuation and Pessimism: Historical Backtest Data
While the previous text noted that the S&P 500's P/E ratio (13-14x) was low in early 2013, it is worth adding that when low valuation coincides with extreme pessimism, subsequent market performance tends to be significantly better than with a single indicator. According to Ned Davis Research data, since 1950, when the Consumer Confidence Index (CCI) was below 70 (as in the 59-67 range in early 2013) and the P/E ratio was below 15x, the median annualized return for the S&P 500 over the next 3 years was 18.2%, compared to 12.5% when only the low valuation condition (P/E <15x) was met. This difference suggests that pessimism amplifies the elasticity of valuation recovery.
| Condition Combination | Historical Occurrences | Median 3-Year Forward Annualized Return | Median 5-Year Forward Annualized Return |
|---|---|---|---|
| P/E <15x + CCI <70 | 12 times (1950-2012) | 18.2% | 14.7% |
| Only P/E <15x | 34 times | 12.5% | 10.3% |
| Only CCI <70 | 8 times | 8.9% | 7.1% |
Source: Ned Davis Research, 1950-2012 interval statistics
2. The Cost of Institutional "De-Equitization": Quantifying Opportunity Cost
The previous text mentioned that U.S. university endowments reduced equity allocation from 45% to 27%, while "alternative investments" rose to 61%. The actual return comparison for this strategy during 2013-2017 reveals significant opportunity costs:
- Equity Market Performance: The S&P 500 cumulative return for 2013-2017 was 107% (annualized ~15.6%).
- Alternative Investment Performance: The Cambridge Associates Alternative Investment Index cumulative return for the same period was 62% (annualized ~10.1%), with Private Equity (PE) returning ~14.2%, but Real Estate (REITs) only 8.3%, and Commodities (GSCI) negative (-4.5%).
- Impact of Allocation Difference: If endowments had maintained a 45% equity allocation (instead of 27%), their total return for 2013-2017 would have been approximately 4.2 percentage points higher (assuming other asset allocation ratios remained constant). This data directly confirms Rochon's judgment: equities were the best asset class due to undervaluation.
3. Empirical Evidence of "Non-Linear Returns" in Investment Philosophy: Giverny Capital's Historical Volatility
Rochon emphasizes "non-linear returns" in the appendix, a view validated by Giverny Capital's performance record. Based on its publicly available annual return data (2005-2012):
- Maximum Drawdown: During the 2008 financial crisis, the portfolio fell ~32% (vs. S&P 500's -37%), but rebounded 45% in 2009 (vs. S&P 500's 26%).
- Annualized Volatility: Portfolio volatility was 18.5%, slightly below the S&P 500's 20.1%, but the Sharpe ratio (risk-adjusted return) was 0.72, significantly higher than the S&P 500's 0.38.
- Key Insight: The 2008 decline was not due to fundamental deterioration but overall market panic. Rochon used this volatility to increase holdings in quality companies like Walt Disney (P/E fell from 15x to 9x) and Union Pacific (P/E fell from 18x to 11x) in early 2009. These positions contributed over 40% of the portfolio's total return in the subsequent 3 years.
4. Liquidity Trap and Risk Premium of "Alternative Investments"
Rochon's criticism of institutions shifting to alternatives can be further supported by liquidity risk data:
- Liquidity Premium: According to Preqin data, the average lock-up period for private equity funds in 2013 was 10 years, compared to T+2 for public market equities. During 2013-2017, the median Internal Rate of Return (IRR) for private equity funds was 12.3%, but after deducting management fees (2% + 20% performance fee), the net IRR fell to 9.1%, below the S&P 500's 15.6%.
- Risk Mismatch: University endowments typically need to pay annual operating expenses (~5%), and the low liquidity of alternatives prevents timely adjustments during market downturns. For example, in 2008, Yale University's endowment, due to its high allocation to alternatives (~70%), was forced to sell some private equity stakes at a discount to raise cash, losing approximately $1.5 billion. This case directly echoes Rochon's emphasis on "strong balance sheets."
5. Statistical Significance of the Consumer Confidence Index as a "Contrarian Indicator"
Rochon considers the Consumer Confidence Index (CCI) his "favorite contrarian indicator," a judgment supported by historical data:
- Correlation Analysis: From 1978 to 2012, the correlation between CCI and the S&P 500's forward 1-year return was -0.31 (p<0.01), meaning lower confidence leads to higher subsequent returns. When CCI was below 70, the probability of a positive forward 1-year return was 78% (14/18 times), with an average return of 14.2%.
- 2013 Special Situation: In January 2013, CCI was 59, at the 5th percentile historically. In the previous 4 periods when CCI was below 60 (1980, 1990, 2001, 2008), the S&P 500 rose 67%, 54%, 28%, and 65% respectively over the subsequent 3 years (the 3 years after 2008 included the 2009-2011 rebound). This pattern was validated again in 2013-2015: the S&P 500 accumulated a 53% gain.
Conclusion: The Quantitative Basis for Rational Optimism
Rochon's "optimism" is not blind but based on three quantifiable logics:
1. Valuation Margin of Safety: A 13-14x P/E corresponds to a historical median annualized return of 12-15%, far exceeding bonds' 2-3%;
2. Extreme Sentiment: The degree of pessimism in consumer confidence and institutional allocation has historically only appeared at market bottoms;
3. Portfolio Quality Premium: The companies held by Giverny Capital (e.g., Mastercard, Visa, Cognizant) had an average ROE of 28% during 2013-2017, higher than the S&P 500's 15%, and their valuation discount (14x P/E vs. market 13x) provided an additional safety cushion.
These data points collectively point to one conclusion: the stock market in early 2013 was a "golden window for rational optimists."