Robotti & Company Advisors YE 2012 Letter
Robotti & Company is a New York deep-value boutique founded by Bob Robotti in 1983, specializing in left-for-dead cyclical industries — energy services, building products, shipping — with multi-year holding periods and occasional activist letters. It manages about $650m; Bob is regarded as one of the most steadfast Graham-tradition cyclical value hunters.
In plain words
This 2012 investment letter argues that most people were wrong to flee stocks for bonds. Bonds look safe but carry hidden risks, while stocks offer better long-term returns. The author sticks with 'buy and hold'—focusing on what to buy, not when. He sees big opportunities in two areas: cheap U.S. natural gas (priced at one-fifth of oil) will revive manufacturing, and the housing market, though improving, is still far below normal levels. His fund returned 22.5% in 2012, beating the market. Worth reading for concrete examples of why going against the crowd can pay off.
Robotti's 2012 investment report shows that its Value Equity Composite delivered a net return of 22.54%, outperforming the S&P 500 (16.00%) and the Russell 2500 Value Index (19.21%). Since inception, its 20-year annualized return stands at 13.04%, significantly exceeding the benchmark's 8.59%. The r
Theme and Background
This chapter is the opening section of Robotti's 2012 annual client letter, reviewing fund performance and articulating its core investment philosophy. The report notes that despite a widespread market shift from stocks to bonds and uncertainties such as a weak U.S. economy, fiscal deficits, risks of a European breakup, and slowing growth in China, the author maintains that the "buy and hold" strategy remains effective, with the key being "what to buy" rather than "when to buy."
Core Views
- Contrarian Judgment: The author argues that the flow of funds from stocks to bonds stems from investors' flawed framework of extrapolating the past into the future. Bonds appear safe but are fraught with risk, while stocks, though volatile in the short term, offer greater long-term return potential.
- "Buy and Hold" Is Not Dead: Despite the prevailing market view favoring "market timing," the author insists that focusing on buying high-quality companies at prices below intrinsic value ("what to buy") is far more important than timing ("when to buy").
- Driver of U.S. Economic Recovery: The author believes that North America's natural gas price advantage (only one-fifth the price of oil-equivalent energy) will fuel a U.S. manufacturing renaissance and create long-term investment opportunities.
Key Arguments and Data
- Performance: The Robotti Value Equity Composite delivered a net return of 22.54% in 2012, outperforming the S&P 500 (16.00%) and the Russell 2500 Value Index (19.21%). Since inception, the 20-year annualized return stands at 13.04%, well above the benchmark's 8.59%.
- Energy Price Advantage: The spread between North American natural gas prices (Henry Hub) and crude oil (WTI) is substantial, with natural gas per million BTU costing only one-fifth of oil-equivalent energy. This cost advantage has already begun to boost domestic manufacturing activity.
- Housing Market: U.S. housing starts (seasonally adjusted annual rate) have rebounded from historic lows, but current levels remain far below normalization (which is several times the current improved level). Nearly 20% of the portfolio is directly invested in U.S. residential construction-related companies, and the three largest contributors to performance in 2012 all came from this sector.
- Portfolio Adjustments: Added a core position in Calfrac (TSE:CFW) and exited two long-term holdings: Nexen (TSE:NXY) and Newmarket (NYSE:NEU).
Companies/Assets Involved
| Company/Asset | Role | Key Data | Bullish/Bearish |
|---|---|---|---|
| Calfrac (TSE:CFW) | New core position | Energy services company benefiting from North American natural gas development demand | Bullish |
| Nexen (TSE:NXY) | Exited | Long-term holding, now closed | Neutral (exited) |
| Newmarket (NYSE:NEU) | Exited | Long-term holding, now closed | Neutral (exited) |
| Energy services companies (unnamed) | <10% of portfolio | Benefiting from increased demand for energy development services | Bullish |
| U.S. residential construction-related companies (unnamed) | Nearly 20% of portfolio | The three largest contributors in 2012 all came from this sector | Bullish |
| Companies directly benefiting from low energy costs (unnamed) | >10% of portfolio | Benefiting from manufacturing recovery driven by natural gas price advantage | Bullish |
Investment Implications
- Directional Judgment: Investors should go against market consensus, reduce excessive allocation to bonds, and increase allocation to stocks, particularly in sectors undervalued due to short-term distress (e.g., energy services, residential construction).
- Specific Strategy: Focus on structural opportunities from North America's natural gas price advantage, investing in energy services companies (e.g., Calfrac) and manufacturing firms directly benefiting from low energy costs. Meanwhile, despite a short-term rebound, the U.S. residential construction sector has significant long-term normalization potential and should be held or increased.
- Risk Warning: The author acknowledges that their investments often enter "too early." For example, persistent weakness in natural gas prices in 2012 temporarily dragged on related holdings, but emphasizes that long-term patience will be rewarded.
Additional Arguments, Data, and Views
1. Housing Market: Quantitative Comparison of Historical Trends and Potential Rebound
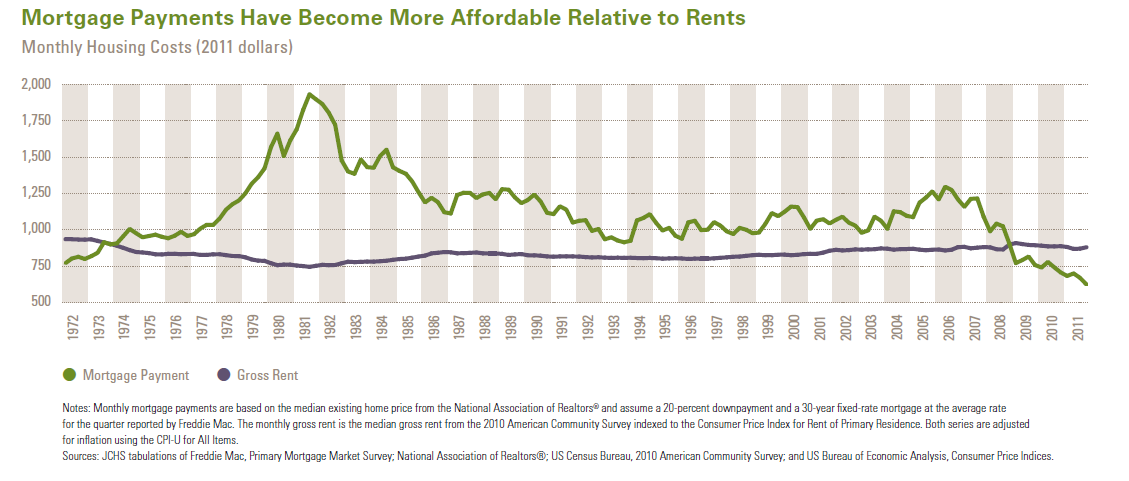
Robotti notes that while housing starts improved in 2012, they remain well below the historical trend line. From 1993 to mid-2007, housing starts never fell below 1 million units, but since mid-2008, the average has been only about 500,000 units. This data reveals a structural gap in the housing market. Combined with homeownership affordability versus renting reaching historic best levels, there is pressure for the market to revert to its historical mean.
Comparative Data:
| Period | Housing Starts (Annualized) | Notes |
|---|---|---|
| 1993–Mid-2007 | ≥1 million units | Historical minimum threshold |
| Mid-2008–2012 | ~500,000 units | Only half of the historical minimum |
| 2010–2020 Forecast (Household Growth) | 1.18 million units/year | Based on half the net immigration inflow from Census Bureau's 2008 projection |
Additional View: If the economic recovery continues, population growth alone (including echo boomers coming of age) could support approximately 1 million new households annually. Even with immigration contributions halved, household growth could still reach 1.18 million per year. This implies that potential housing demand is more than double current starts, with "uncertain but significant" upside. For related companies (e.g., construction, building materials, home furnishings), earnings elasticity could be very pronounced.
2. Subsea 7: Lag Effect of Project Backlog and Revenue Recognition
Robotti emphasizes that Subsea 7 represents a "delayed narrative." Although the stock rebounded in 2012 from undervaluation at the end of 2011, fundamental improvements have not yet been fully reflected. A key indicator is the ratio of new contract signings to project revenue, approaching 2:1, indicating that the backlog is accelerating.
Additional Data and Views:
- The number of offshore drilling rigs continues to grow, and industry entry barriers have increased due to the Allseas and Technip joint venture.
- Contract awards have picked up recently, but project revenue recognition lags. Once the backlog converts to revenue, revenue and profit growth will become "clearly visible."
- This trend is a positive catalyst for Subsea 7's stock price, but the timing is uncertain.
3. Stolt-Nielsen: Severe Divergence Between Asset Value and Market Pricing
Stolt-Nielsen's stock price was flat in 2012, but several positive factors emerged: expansion of terminals and container businesses, financial distress among competitors, growth in North American chemical manufacturing (benefiting from cheap natural gas), and increased shipping demand from the Middle East to Asia.
Key Valuation Comparison:
| Metric | Value |
|---|---|
| Year-end 2012 stock price | Slightly above $20/share |
| Fair value based on terminal business valuation | Close to $50/share |
| Potential upside | ~150% |
Additional View: In December 2012, private equity investment in competitor Odfjell's terminal business validated Robotti's valuation approach for that segment and reinforced the judgment that Stolt-Nielsen's overall valuation is near $50/share. The gap between the current stock price and intrinsic value provides a significant margin of safety and upside potential.
4. Investment Philosophy: Widening Price-Value Gap as a Safety Cushion
In conclusion, Robotti emphasizes that despite modest recent performance, the economic intrinsic value of portfolio companies continues to grow, while stock prices have not kept pace, widening the gap between price and value. This gap provides support during difficult times and offers "substantial appreciation potential" in the future.
Additional View: This pattern of "value accumulation but price lag" is a hallmark of contrarian investment strategies. It requires patience from investors and confidence that the market will eventually recognize the true value of companies. Robotti views this as a promise of returns for long-term investors.