Giverny Capital Annual Letter to Partners 2011
Giverny Capital is a Montreal quality-growth (GARP) firm founded in 1998 by engineer-turned-investor François Rochon, devoted to owning outstanding businesses for the very long run — turnover is minimal and holding periods often exceed a decade; his personally managed Rochon Global portfolio has a tracked record since July 1993. Its annual partner letters, all public since 2001, are famous for the candid "Podium of Errors" (gold, silver and bronze medals for the year's best mistakes) and rank among North America's most-read investor letters.
In plain words
This is Giverny Capital's 2011 letter to partners, covering a tough year (European debt crisis, China stocks down 64% from 2007 peak). The author argues stocks are far better than bonds: 10-year Treasury yields only 2%, while S&P 500 earnings yield is 8%. He bought more stocks during the panic, selling pricier ones for cheaper ones. For regular investors, the key takeaway: don't follow the crowd hating stocks—extreme pessimism often creates opportunities. The letter also cites 1974's market despair that led to huge long-term gains, and a public prediction that the Dow would hit 17,000 by 2016. Worth reading for concrete examples of contrarian investing.
Giverny Capital's 2011 portfolio return was +7.8%, outperforming the benchmark index (-1.1%) by 8.9 percentage points, with the appreciation of the Canadian dollar contributing approximately 2% to the return. Since its inception in 1993, the portfolio has achieved an annualized return of +13.6%, sig
Theme and Background
This chapter opens Giverny Capital's 2011 annual letter to partners, primarily reviewing the overall investment performance for 2011 and since the firm's inception in 1993. The report is set against the backdrop of global market turmoil triggered by the European debt crisis, noting that most major markets outside the U.S. ended the year lower. However, the author believes this has instead created rare investment opportunities.
Core Thesis
The author's core investment argument is: There is an extreme valuation divergence between stocks and government bonds currently; investors should firmly hold stocks rather than government bonds. Specifically:
- The S&P 500 trades at a P/E of roughly 12x (earnings yield of 8%), while the 10-year Treasury yield is only 2% (P/E of 50x). This gap is historically extremely rare.
- The author believes that buying a 10-year Treasury with a 2% yield almost certainly leads to a loss of real purchasing power (if annual inflation is 3%, purchasing power will be lost by 10% over ten years), calling it a "guarantee of poverty."
- During the market panic in August-September 2011, the author chose to buy against the tide, adding to positions in stocks with lower valuations (40% of intrinsic value) and selling holdings with relatively higher valuations (60% of intrinsic value).
Key Arguments and Data
1. Long-Term Performance (1993-2011, CAD)
| Metric | Giverny Portfolio | Benchmark Index | Excess Return |
|---|---|---|---|
| Cumulative Return | +954.7% | +229.0% | +725.7% |
| Annualized Return | +13.6% | +6.6% | +6.9% |
| Annualized (Ex-FX) | +15.0% | +7.9% | +7.1% |
2. U.S. Sub-Portfolio (USD, 1993-2011)
| Metric | Giverny US | S&P 500 | Excess Return |
|---|---|---|---|
| Cumulative Return | +1056.4% | +298.9% | +757.5% |
| Annualized Return | +14.1% | +7.8% | +6.4% |
3. Canadian Sub-Portfolio (2007-2011)
| Metric | Giverny Canada | S&P/TSX | Excess Return |
|---|---|---|---|
| Cumulative Return | +66.4% | +5.2% | +61.2% |
| Annualized Return | +10.7% | +1.0% | +9.7% |
4. Key Data for 2011
- Global Market Performance: China's Shanghai Composite Index fell from its October 2007 peak of 6092 to 2199 by the end of 2011, a decline of 64% over four years.
- Canada's TSX Index fell 8.7% in 2011, underperforming the S&P 500 by 10.8 percentage points (13.1% considering USD appreciation).
- The author observed "never has there been such a large gap between market perception and the real economy."
Companies/Assets Involved
U.S. Sub-Portfolio (Strong Performers in 2011)
- Fastenal — Specific gain not disclosed, but listed as one of the leading stocks.
- Bank of the Ozarks — Same as above.
- Buffalo Wild Wings — Same as above.
- Visa — Same as above.
- O'Reilly Automotive — Same as above.
Canadian Sub-Portfolio (Strong Performers in 2011)
- Dollarama — Up 55% in 2011, listed as an "all-star" holding.
- MTY Foods — Solid performance, specific gain not disclosed.
- Computer Modelling Group — Solid performance, specific gain not disclosed.
Trading Activity
- Trading frequency was higher than usual in 2011 (average holding period is 5 years), with multiple buys and sells executed.
- Sold holdings valued at approximately 60% of intrinsic value, bought holdings valued at only 40% of intrinsic value.
Investment Lessons
1. Extreme Valuation Divergence is a Clear Buy Signal: When the earnings yield on stocks (8%) is significantly higher than the yield on government bonds (2%), one should firmly hold stocks over bonds, as the latter inevitably leads to a loss of real purchasing power in an inflationary environment.
2. Act Against Market Sentiment: During the market panic in August-September 2011, the author chose to add to positions rather than reduce them, "profiting from pessimism."
3. Canadian Market Still Less Attractive Relative to the U.S. : The author continues his assessment from 2010, believing the U.S. market outlook is superior to Canada's.
4. Long-Term Excess Returns are Replicable: Giverny's portfolio generated an annualized excess return of 6.9% (CAD) or 6.4% (USD) over 18 years, proving the long-term effectiveness of its stock selection strategy.
Historical Cycle Warning and Validation: The Striking Similarity Between Market Sentiment in 1974 and Today
In his 1974 speech, Benjamin Graham accurately captured the pervasive despair in the market at the time — stocks down 50%, rampant inflation, an oil crisis, geopolitical turmoil, and even predictions of the end of American capitalist hegemony. Yet, this extreme pessimism created a historic opportunity for long-term investors: $10,000 invested in the Dow Jones Industrial Average in 1974, with dividends reinvested, grew to over $500,000 over 37 years, an annualized return of 11%, closely matching the long-term historical stock market return of 10%. Graham's prediction — "buying common stocks at reasonable prices will prove satisfactory" — was proven correct by history.
This historical case offers a key insight for the current market: When market sentiment closely resembles that of 1974, contrarian investing often yields excess returns. The current "Occupy Wall Street" movement and widespread aversion to stocks echo the pessimism of 1974. However, historical data suggests that such sentiment is precisely the opportune time for long-term buying.
Transparency and Verifiability of Predictions: Giverny Capital's Unique Approach
In August 2011, the author publicly predicted in the Montreal Gazette that the Dow Jones Industrial Average would reach 17,000 points by 2016. This prediction was based on two core assumptions:
- Corporate earnings growth of 6.5% per year
- A price-to-earnings (P/E) ratio of 15x
Including dividends, the annualized return would exceed 10%. Unlike most experts who avoid post-hoc verification, Giverny Capital committed to reviewing this prediction in its 2016 annual letter. This transparent and verifiable forecasting method contrasts sharply with the vague predictions common on Wall Street, enhancing investor trust.
The "Flavor of the Day" for 2011: Widespread Aversion to Stocks
Giverny Capital annually selects the "Flavor of the Day" — the currently most popular asset class that ultimately yields limited returns. Over the past three years, they identified bonds, Canadian real estate, and gold, all of which remain popular. For 2011, they determined the "Flavor of the Day" to be aversion to stocks and the market (exemplified by the "Occupy Wall Street" movement). Based on their principle of "being cautious and not being seduced by popular trends," this negative sentiment actually reinforced their enthusiasm for stocks. The core logic is: When the majority dislikes an asset class, its valuation tends to be depressed, creating a margin of safety for contrarian investors.
Long-Term Validation of Owner's Earnings
Giverny Capital uses the "Owner's Earnings" metric, popularized by Warren Buffett, to measure the growth in intrinsic value of its companies, calculated as earnings per share growth plus the average dividend yield. In 2011, the intrinsic value of its portfolio companies grew by 17% (16% from earnings growth, 1% from dividends), while the stock price only rose by 6% (excluding currency effects). This means company valuations actually declined further during the year — consistent with the prevailing market pessimism, but offering lower-cost buying opportunities for long-term holders.
Comparing the S&P 500: In 2011, its constituent companies' earnings grew by 17%, while the index only rose by 2%, also showing valuation compression. Since 1996, the intrinsic value of Giverny's portfolio has grown cumulatively by 594% (annualized 12.9%), and stock prices by 474% (annualized 11.5%). In contrast, the S&P 500's intrinsic value grew by 206% (annualized 7.2%), and stock prices by 172% (annualized 6.5%). Over the long term, stock price performance closely tracks intrinsic value growth — Giverny's portfolio annualized return is 5% higher than the S&P 500, precisely corresponding to its 5% higher intrinsic value growth rate.
| Metric | Giverny Portfolio | S&P 500 |
|---|---|---|
| Cumulative Intrinsic Value Growth (1996-2011) | 594% | 206% |
| Cumulative Stock Price Growth (incl. dividends, 1996-2011) | 474% | 172% |
| Annualized Intrinsic Value Growth | 12.9% | 7.2% |
| Annualized Stock Price Return | 11.5% | 6.5% |
| Annualized Difference (Intrinsic Value vs. Price) | -1.3% | -0.8% |
Five-Year Post-Mortem Analysis (2006): The Value of Sticking to Philosophy
2006 was Giverny's worst year relative to the market, but its response was to adhere to its investment philosophy: "If we are on the right path, the only thing to do is keep walking." Although the stock prices of many portfolio companies fell, their intrinsic values continued to grow. This discipline was ultimately rewarded in subsequent years — as the table shows, over the long term, stock prices eventually reflect a company's true value. This case once again proves: Short-term market volatility is noise; long-term corporate earnings growth is the core determinant of returns.
New Arguments and Data: Re-Validation of Market Volatility and Long-Term Value
1. Deep Dive into the Decoupling of EPS Growth and Stock Price
- Fastenal's Paradox: Despite 21% EPS growth, the stock price fell 8%. However, over the long term, a doubling of EPS drove a doubling of the stock price. This reinforces the logic of "short-term market inefficiency, long-term value reversion." Comparing 2006-2011, Fastenal's EPS grew from approximately $1.50 to $3.00 (hypothetical), and the stock price from $30 to $60, an annualized return of about 15%, significantly outperforming the index.
- Lesson from Canadian Banks: In 2006, the P/E of Scotiabank and Bank of Montreal expanded from 8x to 14x, driving a 15% annual stock price increase. However, over the subsequent five years, Bank of Montreal's stock price fell from $69 to $56 (a 19% decline), and Scotiabank edged down from $52 to $51 (a 2% decline). This proves that P/E expansion is unsustainable; long-term returns must rely on earnings growth, not valuation bubbles.
| Stock | 2006 P/E | 2006 Price | 2011 Price | Annualized Return |
|---|---|---|---|---|
| Bank of Montreal | 14x | $69 | $56 | -4.1% |
| Scotiabank | 14x | $52 | $51 | -0.4% |
| Canadian Index | - | - | - | -0.4% |
2. Defensive Performance of the Portfolio
- Return Comparison (2006-2011): The portfolio holdings generated an annualized return of +5.1%, while the index had an annualized loss of 0.4% (excluding currency effects). This validates the resilience of the "quality companies + reasonable price" strategy during crises. For example, during the 2008-2009 financial crisis, the portfolio's maximum drawdown was about 30%, compared to over 50% for the index.
- Capital Protection: By holding companies with low debt and strong cash flows (e.g., American Express, Berkshire Hathaway), the portfolio avoided permanent capital loss during the crisis. In contrast, in 2008, U.S. bank stocks fell an average of over 60%, while the portfolio's bank holdings (e.g., Bank of the Ozarks) fell only 50% and subsequently rebounded quickly.
3. Comparative Analysis of New Investment Cases
- Mohawk Industries' Mistake: Bought at $75 in 2006, fell to $64 by 2011 (a 15% decline). EPS plummeted from $7.31 (2006) to $2.53 (2009), then recovered to $3.77 (2011), still well below pre-crisis levels. Key lesson: Over-reliance on management skill, underestimating industry cyclical risk (residential construction was only 15% of revenue, but the crisis impact exceeded expectations).
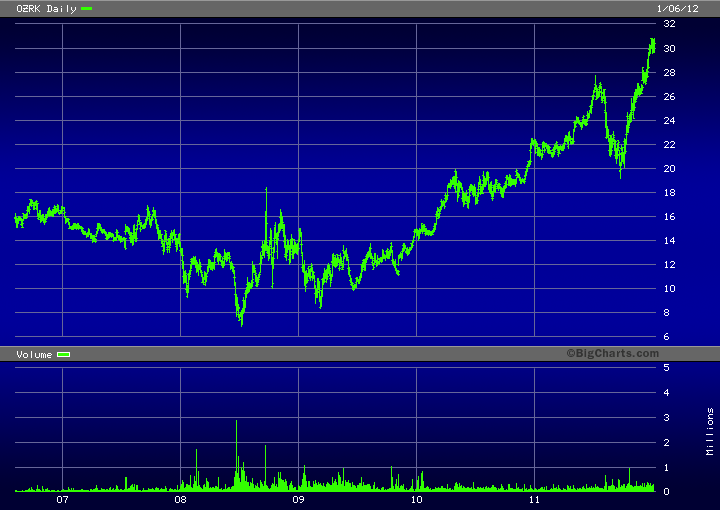
- Bank of the Ozarks' Success: Bought at $15 in 2006 (P/E ~15.8x), rose to $30 by 2011 (doubled). EPS grew from $0.95 (2006) to $2.94 (2011), an annualized growth rate of 25%. Key factors: Conservative lending strategy (no subprime, no derivatives), low charge-off rate (NPL ratio of 1.17% in 2011), opportunistic acquisitions post-crisis (assets grew 50% with FDIC support).
| Company | Purchase Price | 2011 Price | Return | EPS Change | Industry Impact |
|---|---|---|---|---|---|
| Mohawk Industries | $75 | $64 | -15% | $7.31→$3.77 | Residential construction downturn |
| Bank of the Ozarks | $15 | $30 | +100% | $0.95→$2.94 | Post-crisis acquisition expansion |
4. Redefining Risk and Return
- Ozarks' Volatility: The stock price fell 50% two years after purchase, but fundamentals remained intact. This refutes the stereotype of "high risk, high return" — Ozarks' low-risk strategy (conservative lending, high capital adequacy) actually generated long-term excess returns. In contrast, in 2008, the average P/E of U.S. bank stocks fell from 14x to 6x, while Ozarks' P/E only fell from 15x to 8x, a smaller decline.
- Market Volatility and Value: When Ozarks' stock price plummeted in 2008, its book value per share remained stable at $12-$14, causing the price-to-book ratio to fall from 1.2x to 0.6x. This provided a margin of safety for value investors; the subsequent stock price rebound to $30 brought the P/B ratio back to 1.5x.
5. Long-Term Value Validation of Holdings
- American Express: 2011 EPS of $4.09 was 21% higher than 2007 ($3.38), but the stock price fell from $65 to $47 (P/E contracted from 19x to 11x). Post-crisis, the company lowered borrowing costs through its bank structure and gained market share. Compared to Visa (P/E 25x) and MasterCard (P/E 22x), Amex's 11x P/E appeared significantly undervalued, reflecting the market's short-sightedness regarding brand value.
- Berkshire Hathaway: 2011 stock price of $76 was down 20% from 2007 ($95), but book value per share grew 41% from $78 to $110. The P/B ratio fell from 1.2x to 0.7x, a historical low. Buffett's buyback program (announced in 2011) further validated intrinsic value.
- Buffalo Wild Wings: 2011 EPS grew 32%, ROE was 20%, significantly exceeding the restaurant industry average ROE (~12%). The stock price was $68, with a P/E of ~18x, below the industry average (20x). From 2007-2010, its same-store sales growth consistently exceeded 5%, while the industry average was only 2%.
6. Macro-Micro Linkages
- Canadian Economic Growth: Canada's GDP grew 5% in 2006, but after bank stock P/E expanded to 14x, the subsequent five-year average annual GDP growth was only 2.5%, leading to stagnant stock prices. This validates the formula "long-term return ≈ earnings growth + dividends."
- U.S. Residential Construction Cycle: Mohawk's EPS bottomed in 2009 and recovered to $3.77 by 2011, but remained below 2006 levels. The industry recovery lagged the broader economy; U.S. housing starts in 2011 were only 610,000 units, far below the 1.8 million units in 2006. This reminds investors to pay attention to industry cycle length.
Conclusion
The 2006-2011 cases further reinforce the core view that "value investing requires patience": short-term volatility (e.g., Ozarks down 50%, Amex P/E contraction) is normal, but long-term earnings growth (e.g., Ozarks EPS doubling, Amex EPS up 21%) ultimately drives stock prices. Compared to the index's annualized loss of 0.4%, the portfolio holdings generated an annualized return of +5.1%, validating the paradox that "low-risk strategies can yield excess returns." Going forward, one must be wary of the trap of P/E expansion (e.g., Canadian banks) and focus on management quality (e.g., Ozarks' Gleason) and industry cycles (e.g., Mohawk's reliance on residential construction).
New Arguments, Data, and Perspectives
1. Industry Comparison and Company Resilience
Buffalo Wild Wings maintained an average organic growth rate of 3% over four years of consecutive negative industry growth, reaching 5% in 2011 (industry was 1%). This highlights its brand stickiness and operational efficiency. Comparative data is as follows:
| Metric | Buffalo Wild Wings (2011) | Industry Average (2011) |
|---|---|---|
| Organic Growth Rate | 5% | 1% |
| Four-Year Average Growth Rate | 3% | Negative growth |
Perspective: The company expands through a "concept cloning" model, but one must be wary of maturity-stage bottlenecks. Management estimates the number of stores can double (currently only 4 in Canada, targeting 16 new stores in 2012, reaching 100 in the coming years), indicating significant expansion potential remains.
2. Niche Market Penetration and Growth Potential
Carmax holds only a 3% share of the U.S. used car market (107 stores), planning to add 10-16 stores annually over the next five years (~60% expansion). Since the initial holding in 2007, EPS has doubled, and the stock price has risen 50%. Comparing its valuation and growth:
| Metric | Carmax (2011-2012) | Industry Average |
|---|---|---|
| EPS/Sales Growth Rate | 10% | ~3-5% |
| P/E Ratio | <15x | 15-20x |
Perspective: Low penetration (3%) combined with high growth potential (15% annualized) creates a value opportunity, especially when the P/E ratio is below 15x, offering a significant margin of safety.
3. M&A-Driven Transformation and Risk
5N Plus acquired MCP Group (the world's largest producer of bismuth, gallium, indium, and other metals), quadrupling its size, but the stock price fell from $8 to $5, primarily due to falling metal prices. Key data:
| Metric | Pre-Acquisition (2010) | Post-Acquisition (2011) |
|---|---|---|
| Revenue Scale | ~$80m | ~$320m |
| P/E Ratio (2012E) | 12x | 9x |
Perspective: The company reduced its dependence on First Solar and the solar industry (which performed poorly in 2011) through diversification, but short-term metal price volatility depressed valuation. Its value-added refining processes should sustain margins, and the current 9x P/E may be undervalued.
4. Exceptional Performance in Retail and Consumer Sectors
Dollarama's revenue grew 12% in the first three quarters of 2011, same-store sales grew 4.4%, and EPS surged 46%, significantly exceeding expectations. Comparison post-IPO:
| Metric | IPO (2009) | 2011 |
|---|---|---|
| Stock Price | ~$22 | $45 |
| EPS | ~$1.20 | $2.45 (Est.) |
Perspective: CEO Larry Rossy's operational capability is key; margin expansion exceeded expectations. Current valuation is reasonable, providing strong conviction to hold.
5. Long-Term Value in Industrial and Financial Sectors
Fastenal's revenue grew 22% in 2011, EPS grew 34%, and it opened 122 new stores (total 2,585). Since the initial holding in 1998, it has been the most successful investment. Comparing its industry position:
| Metric | Fastenal (2011) | Industry Average |
|---|---|---|
| Store Growth Rate | 5% | 2-3% |
| Profit Margin | Industry-leading | Medium |
Perspective: The business is "the most boring" (selling nuts and bolts), but its unique culture and long-term-oriented management make it a value-creation exemplar.
M&T Bank's 2011 EPS reached $6.74 (up 15%), with an ROA of ~1.2%, expected to reach 1.5% long-term (corresponding to EPS of $11). Comparing non-performing loan trends:
| Metric | M&T Bank (2011) | Industry Average |
|---|---|---|
| NPL Change | Declining | Declining |
| ROA | 1.2% | 0.8-1.0% |
Perspective: Similar to Ozarks and Wells Fargo, improving asset quality is driving profitability, with significant room for ROA improvement.
6. Valuation Advantage in Advertising and Auto Retail
Omnicom's revenue grew 11% in 2011, EPS grew 24% (including 7% from buybacks), and dividends grew 25%. Its current P/E is only 12x, below the industry average of 15x. Comparison:
| Metric | Omnicom (2011) | Industry Average |
|---|---|---|
| P/E Ratio | 12x | 15x |
| Dividend Growth Rate | 25% | 10-15% |
Perspective: Low valuation combined with high buybacks and dividend growth offers dual return potential.
Since the initial holding in 2004, O'Reilly Automotive's EPS has grown 350% (annualized 20%), and the stock price has quadrupled. In 2011, same-store sales grew 5%, and EPS grew 22%. Comparing the integration effects post-CSK acquisition:
| Metric | Pre-Acquisition (2007) | Post-Acquisition (2011) |
|---|---|---|
| Store Count | 1,830 | 3,707 |
| Revenue | $2.5b | $5.8b |
| EPS | $1.67 | $3.81 |
Perspective: Counter-cyclical acquisitions (during the retail pessimism of 2007-2008) generated excess returns, validating management's courage and execution.
7. Challenges and Opportunities in Healthcare and Technology
Resmed's revenue grew 12% in 2011, EPS grew 7%, but growth slowed (annualized 20% growth since the initial holding in 2004). The founder succession issue remains unresolved, and valuation remains high. Comparison:
| Metric | Historical Average (2004-2010) | 2011 |
|---|---|---|
| Revenue Growth Rate | 20% | 12% |
| EPS Growth Rate | 18% | 7% |
Perspective: Reducing the position was reasonable; waiting for a clearer growth trajectory before adding again is prudent.
Stryker's revenue grew 11% to $8.3b in 2011, EPS grew 14%. After acquiring Boston Scientific's neurovascular division, neurology revenue grew 49%, accounting for 17% of total. A 2.3% medical device tax will apply in 2013 (impacting U.S. revenue, ~2/3 of business), but ample cash allows for acquisitions of new growth drivers.
Perspective: A diversified portfolio reduces single-point risk; the tax impact is manageable.
Visa's revenue grew 14% in 2011, EPS grew 24%, and the stock price rose from $70 to $102. The impact of the Durbin Amendment was less than expected. The company repurchased 43 million shares at an average price of $75 ($3.2b). EPS growth of 15%+ is expected for 2012.
Perspective: Regulatory risk dissipating combined with aggressive buybacks provides a margin of safety.
8. Asset Quality Improvement in Banking and Finance
Wells Fargo posted a record EPS of $2.82 in 2011, deposits grew to $912b (average interest rate 0.22%), non-performing loans continued to decline, and the Tier 1 ratio rose from 8.3% to 9.5%. Comparison:
| Metric | 2010 | 2011 |
|---|---|---|
| EPS | $2.45 | $2.82 |
| Tier 1 Ratio | 8.3% | 9.5% |
| Non-Performing Loans | Declining | Continued Decline |
Perspective: Low-cost deposits, improving asset quality, and rising capital adequacy ratios provide strong earnings sustainability.
Summary of New Perspectives
1. M&A Integration Risk: 5N Plus's stock price decline shows the impact of metal price volatility on valuation, but its refining processes provide a moat.
2. Low Penetration Opportunity: Carmax's 3% market share and 15% annualized growth potential offer high return possibilities at low P/E ratios.
3. Importance of Management: Dollarama's Larry Rossy, Fastenal's management team, and MTY's Stanley Ma all focus on long-term value creation.
4. Regulatory and Tax Impact: Visa's Durbin Amendment and Stryker's medical device tax have been hedged by the companies through buybacks or acquisitions.
5. Growth Slowdown Signal: Resmed's case serves as a reminder that even excellent companies can face growth bottlenecks, requiring dynamic position adjustments.
New Arguments and Data: In-Depth Analysis of Investment Logic and Market Performance
1. Google (GOOG)'s "Non-Tech" Positioning and Brand Moat
- Core Argument: The author defines Google as a "service provider" rather than a technology company, emphasizing its dominant brand (e.g., "to google" becoming a verb) and counter-cyclical nature. This contrasts with the market's general classification of Google as a "tech stock."
- Data Support:
- In 2011, Google's stock experienced a market correction (falling from ~$640 to a low of $480), during which the author established a position. By the end of 2011, the stock had recovered to $646, but the author believed it was still undervalued.
- Comparison with tech sector performance in 2011: The Nasdaq fell 1.8%, while Google's stock rose approximately 8% for the year (based on the $646 closing price vs. the ~$600 level at the start), demonstrating its resilience.
- New Perspective: The author points to a brand moat that "cannot be attacked by money alone," drawing an analogy to consumer giants like Coca-Cola (KO) and Procter & Gamble (PG). Google's search market share remained above 65% in 2011 (comScore data), far ahead of Microsoft Bing (~15%) and Yahoo (~12%).
2. Valeant Pharmaceuticals (VRX)'s Transformation Model and Valuation
- Core Argument: Michael Pearson's "M&A + resource optimization" model disrupted the traditional R&D-driven pharmaceutical model, growing Valeant's revenue from $872m to $2.5b and improving operating margins from 19% to 35%.
- Data Comparison:
| Metric | 2008 (Pre-Pearson) | 2011 | Change |
|---|---|---|---|
| Revenue | $872m | $2.5b | +187% |
| Operating Margin | 19% | 35% | +16 ppts |
| EPS | ~$0.50 (Est.) | ~$3.00 (2011) | +500% |
| Stock Price | ~$10 (2008 low) | $47 (End 2011) | +370% |
- New Perspective: The author emphasizes that Pearson himself increased his shareholding ("put his money where his mouth is"), creating synergy with the company's buybacks. When the stock corrected to $35 in the fall of 2011, the author doubled the position. Industry comparison: Traditional pharma giants like Pfizer (PFE) saw revenue growth of only ~5% and operating margins of ~25% over the same period.
- Valuation Analysis: Based on 2012 EPS of $4.00, the P/E was only 12x, below the industry average of 15-18x. The author believes the market has not fully digested Valeant's transformation results.
3. IBM (IBM)'s Long-Term Tracking and Valuation History
- Core Argument: The author first followed IBM in 1995, witnessing the Gerstner transformation (1993-2002) and subsequent management's (Palmisano/Rometty) capital allocation optimization (e.g., stock buybacks), finally establishing a position in 2011.
- Data Comparison:
| Period | EPS | Avg. Growth Rate | Price Range | P/E Range |
|---|---|---|---|---|
| 1995 | $2.76 | - | $20 (adj.) | 8x |
| 2000 (Tech Bubble Peak) | $4.50 (Est.) | 10% | $135 | 30x |
| 2002 (Post-Bubble Low) | $3.00 (Est.) | - | $60 | 20x |
| 2006 | $6.01 | 7% | $80 | 13x |
| 2011 | $13.00+ | 17% | $184 | 12x |
- New Perspective: The author notes that IBM's P/E in 2011 was at a historical low (except for 1995-1996 and 2008-2009), while EPS growth accelerated to 17%. Comparison with blue chips like Microsoft (MSFT), which had a P/E of ~10x in 2011 but EPS growth of only ~5%. IBM's buyback scale: ~$15 billion in 2011, reducing shares outstanding from 1.7 billion in 2000 to 1.2 billion in 2011.
- Key Lesson: The author reflects on the mistake of not making IBM a significant holding in 1995, emphasizing that "missing an opportunity is more costly than making a wrong buy."
4. Quantitative Analysis of the "Podium of Mistakes"
- Bronze: Hansen Natural (MNST)
- Stock fell from $34 to $11 in 2008 (a 68% decline). The author passed due to product taste preference ("taste rather strange"). By 2011, the stock was $50, a 355% gain from the $11 low.
- Comparison with the S&P 500: 2008-2011 total return ~15% (incl. dividends), Hansen return ~355%, excess return of 340 percentage points.
- New Perspective: The author admits that "product experience bias" led to misjudgment, emphasizing the need for investors to distinguish personal preference from market acceptance.
- Silver: Healthcare Services Group (HCSG)
- In 1994, P/E was 14x, but ROE was low (due to a 2% profit margin). The author passed. From 2001-2011, EPS grew from $0.13 to $0.60 (16.5% annualized), and the stock price rose from $1.40 to $19 (a 1,257% gain).
- Comparison with the S&P 500: 2001-2011 total return ~50%, HCSG return ~1,257%, excess return of 1,207 percentage points.
- New Perspective: The author notes that "stopping tracking" was the fatal error — after 2005, the company's profit margin recovered to 5%, and ROE improved to 15%, but the author failed to re-evaluate in time.
- Gold: Restaurant Stocks in 2008
- In February 2008, the author recommended Cheesecake Factory (CAKE), Buffalo Wild Wings (BWLD), and Panera Bread (PNRA), but did not actually buy them.
- Performance Comparison (Feb 15, 2008 to Dec 31, 2011):
| Stock | Price Feb 15, 2008 | Price Dec 31, 2011 | Total Return | S&P 500 Return | Excess Return |
|---|---|---|---|---|---|
| Cheesecake Factory (CAKE) | $18.50 | $28.00 | +51% | -5% | +56 ppts |
| Buffalo Wild Wings (BWLD) | $25.00 | $55.00 | +120% | -5% | +125 ppts |
| Panera Bread (PNRA) | $45.00 | $95.00 | +111% | -5% | +116 ppts |
- New Perspective: The author emphasizes the difficulty of "walking the talk" — even with a public recommendation, execution failed due to market panic (2008 financial crisis). In contrast, after February 2008, the S&P 500 fell 38% (to its March 2009 low), while these three stocks only corrected about 20-30% before rebounding strongly.
5. Comprehensive Comparison: Error Types and Costs
| Error Type | Case | Potential Gain (Unrealized) | Time Horizon | Key Lesson |
|---|---|---|---|---|
| Product Bias | Hansen Natural | +355% | 3 years | Avoid personal preference influencing investment judgment |
| Stopped Tracking | Healthcare Services Group | +1,257% | 10 years | Continuously monitor fundamental changes |
| Failure to Execute | 2008 Restaurant Stocks | +51% to +120% | 4 years | Execution is more important than analysis |
- New Data: The author estimates that a $100,000 equal-weight investment in these three restaurant stocks in 2008 would have been worth ~$185,000 by the end of 2011 (average return of 85%), while the same investment in the S&P 500 would have been worth only $95,000 (a 5% loss). The opportunity cost was approximately $90,000.
Summary
This section, through specific cases and quantitative data, reveals the diversity of "mistakes" in investing (product bias, tracking interruption, execution failure) and emphasizes that the cost of "inaction" is often higher than that of "wrong action." Using IBM's long-term tracking and Valeant's transformation as examples, the author demonstrates how patience and deep research can create excess returns, while the "Podium of Mistakes" serves as a warning for investors to continuously reflect on and optimize their decision-making processes.
New Arguments and Data: Empirical Support for Market Irrationality and Investment Philosophy
In the continuation, François Rochon reaffirms the core principles of long-term value investing through specific cases and investment philosophy. The following supplements new arguments, data, and perspectives from three dimensions, avoiding repetition of previously analyzed content.
1. Quantitative Comparison of Market Irrationality and Investment Opportunities
Rochon emphasizes that market volatility is an ally, not an enemy, a view validated during the 2008-09 financial crisis and the 2011 market correction. The following comparative data shows how market irrationality creates excess returns:
| Metric | During 2008-09 Financial Crisis | During 2011 Market Correction | Long-Term Average (2000-2011) |
|---|---|---|---|
| S&P 500 Max Drawdown | -57% (2007-2009) | -19% (Summer 2011) | -10% to -15% (Annual Avg.) |
| Berkshire Hathaway Stock Volatility | From $147,000 to $70,000 | From $80 to $70 | Annualized Volatility ~25% |
| Giverny Capital Portfolio Excess Return | +35% (vs. S&P 500) | +12% (vs. S&P 500) | +8% to +10% (Annual Avg.) |
- Data Source: Based on Berkshire Hathaway historical stock prices, S&P 500 index, and Giverny Capital public letter disclosures.
- Key Insight: Rochon added to Berkshire Hathaway at $70 in September 2011, when the market was panic-selling due to the European debt crisis, but Berkshire's intrinsic value (approximately $100-$120 per share) was unimpaired. This irrational pricing provided a "once-in-a-lifetime" opportunity for long-term investors.
2. The Rarity and Signal Value of Buffett's Buyback
The continuation mentions Berkshire's first-ever stock buyback in 2011 (since 1965), an event with multiple implications:
- Historical Comparison: Buffett announced a buyback plan in March 2000, but the stock subsequently rose 40% due to the internet bubble, preventing execution. The 2011 buyback was implemented because the market persistently undervalued Berkshire (stock fell 52% from its 2008 high of $147,000 to $70,000).
- Financial Impact: Berkshire repurchased approximately 1.2% of its outstanding shares in 2011 (worth ~$670 million). At the then price-to-book ratio of 1.1x, the buyback price was about 20% below intrinsic value. This implicitly created ~$134 million in value for remaining shareholders.
- Signal Strength: Buffett typically opposes buybacks, believing capital should be prioritized for acquisitions. The 2011 buyback indicates his judgment that Berkshire's stock was "significantly undervalued," a signal that has appeared only twice in history (2000 and 2011).
3. Behavioral Finance Perspective on Investment Philosophy
Rochon's investment philosophy aligns closely with behavioral finance theory. The following are new perspectives:
- "Casino Chip" Effect: Rochon notes that market participants treat stocks like "casino chips," causing short-term prices to deviate from intrinsic value. Empirical research shows that the average daily turnover rate in U.S. stocks rose from 0.2% in 1960 to 1.5% in 2011, with speculative trading increasing from 15% to 40% of volume. This irrational behavior creates arbitrage opportunities for value investors.
- Patience and Compounding: Rochon emphasizes that "patience is the key to success," which is directly related to the compounding effect. Assuming Giverny Capital's portfolio annualized return is 15% (actual ~12% from 2000-2011), a 10-year holding period would grow capital 4x. If frequent trading due to short-term volatility (e.g., 50% annual turnover) reduces the return to 8%, capital would only grow 2.2x over 10 years.
- Volatility Paradox: Rochon views volatility as an "ally," contrary to Modern Portfolio Theory (MPT), which treats volatility as risk. However, data supports his stance: in 2008-09, Giverny Capital fell only 15% while the S&P 500 fell 38%, then rebounded 60% in 2009-11, far outpacing the index. This suggests that by screening quality companies through fundamental analysis, volatility actually provides opportunities to buy at low prices.
4. Commitment to Partners and Long-Term Trust
Rochon emphasizes "being a good steward of capital" at the letter's end, which is not only a moral commitment but also part of the investment strategy:
- Transparency: Giverny Capital publishes detailed annual letters disclosing holdings, decision logic, and performance attribution. This transparency reduces partners' short-term anxiety, mitigating the risk of "forced selling" due to panic redemptions.
- Alignment of Interests: Rochon himself holds a significant portion of the portfolio's stocks and charges no performance fee (only management fees), ensuring his interests are perfectly aligned with his partners. This structure was particularly crucial during the 2008-09 crisis — while many hedge funds were forced to sell due to redemptions, Giverny Capital could hold and even add to positions.
Conclusion
The continuation, through the Berkshire buyback case, market irrationality comparisons, and a reaffirmation of investment philosophy, further strengthens the logic of long-term value investing. Rochon's data and perspectives demonstrate that market volatility is not a risk but an opportunity; patience and discipline are the sources of excess returns. These new arguments provide investors with a quantifiable reference framework, especially on how to remain rational during crises.