Giverny Capital Annual Letter to Partners 2004
Giverny Capital is a Montreal quality-growth (GARP) firm founded in 1998 by engineer-turned-investor François Rochon, devoted to owning outstanding businesses for the very long run — turnover is minimal and holding periods often exceed a decade; his personally managed Rochon Global portfolio has a tracked record since July 1993. Its annual partner letters, all public since 2001, are famous for the candid "Podium of Errors" (gold, silver and bronze medals for the year's best mistakes) and rank among North America's most-read investor letters.
In plain words
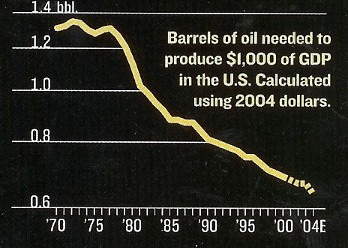
This 2004 investment letter explains why the fund returned only 1.6% while the market gained over 6%. The reason: the manager avoided hot resource stocks like oil and mining. He argues that over the long term, owning companies with strong brands or technology (like Johnson & Johnson or Resmed) beats chasing commodity stocks. He shows that the U.S. now uses half as much oil per dollar of GDP as in 1970, suggesting resource stocks matter less. For regular investors, the lesson is to stick with quality companies even when they underperform for a year or two. Patience pays off.
Giverny Capital's 2004 annual report shows that the global Giverny portfolio returned 1.6% in Canadian dollars, the international portfolio returned 9.3% in US dollars, the weighted benchmark returned 6.1%, and the S&P 500 returned 10.7%. The portfolio was 80% invested in US stocks, which were dragg
Theme and Background
This chapter serves as the introduction to Giverny Capital’s 2004 annual report, primarily reviewing the portfolio’s performance in 2004, long-term track record, and articulating its investment philosophy. The report notes that although the global portfolio returned only 1.6% in Canadian dollars in 2004, significantly underperforming the benchmark (6.1%) and the S&P 500 (10.7%), the earnings of the holdings grew by 20%, reflecting strong fundamentals. The author uses this opportunity to reiterate the core investment philosophy: avoiding resource-based commodity stocks and focusing on companies with competitive advantages.
Core Views
- Short-term underperformance, but long-term logic unchanged: The underperformance in 2004 was primarily due to not holding resource stocks (which performed strongly that year), rather than poor stock selection. The author believes that sticking to investments in companies with moats will generate excess returns over the long term, and the strategy will not be changed due to one or two years of poor performance.
- Long-term impact of the Canadian dollar exchange rate is negligible: Although the 7% depreciation of the U.S. dollar against the Canadian dollar dragged down returns denominated in Canadian dollars for the year, the annualized depreciation of the U.S. dollar since inception in 1993 has been only 0.6%, making the long-term impact almost negligible.
- Declining resource dependence is a structural trend: The U.S. economy’s demand for basic raw materials like oil has dropped significantly over the past 34 years, reinforcing the author’s judgment to avoid resource stocks.
Key Arguments and Data
- Long-term performance crushes the benchmark: From inception in July 1993 to the end of 2004, the global portfolio achieved an annualized return of 19.9% (in Canadian dollars), far exceeding the benchmark’s 10.4% and the S&P 500’s 10.4%. An initial investment of CAD 100,000 grew to CAD 807,700, while the benchmark only grew to CAD 310,500.
- Attribution of 2004 underperformance: 80% of the global portfolio consists of U.S. stocks, which were affected by the 7% depreciation of the U.S. dollar against the Canadian dollar. However, the core reason was not holding resource stocks—these performed strongly that year, and Canadian resource stocks account for about 35% of the S&P/TSX index.
- Data on declining resource dependence: The amount of oil required per USD 1,000 of U.S. GDP fell from 1.31 barrels in 1970 to 0.64 barrels in 2004, a decline of 51%.
- Long-term target: The author sets an ambitious goal of outperforming the benchmark by 5% annualized. If overall stock returns are 5%-9% over the next decade, the portfolio’s target return is 10%-14%.
Global Portfolio (CAD) Long-Term Performance Comparison
| Metric | Giverny Portfolio | Benchmark | S&P 500 (CAD) |
|---|---|---|---|
| 2004 Return | 1.6% | 6.1% | 2.8% |
| Annualized Return Since 1993 Inception | 19.9% | 10.4% | 10.4% |
| Cumulative Total Return | 707.7% | 211.9% | 210.5% |
International Portfolio (USD) Long-Term Performance Comparison
| Metric | Giverny International Portfolio | S&P 500 |
|---|---|---|
| 2004 Return | 9.3% | 10.7% |
| Annualized Return Since 1993 Inception | 20.0% | 10.9% |
| 10-Year Annualized Return | 18.7% | 12.0% |
RRSP Portfolio (CAD) Long-Term Performance Comparison
| Metric | Giverny RRSP Portfolio | S&P/TSX |
|---|---|---|
| 2004 Return | 2.9% | 14.0% |
| 10-Year Annualized Return | 18.9% | 10.3% |
Companies/Assets Involved
- No specific holdings are directly mentioned, but examples of companies that fit the investment philosophy are given: Astral Media, Johnson & Johnson, Cognex, Resmed. These companies have “knowledge” and “brand” as core assets, and their costs are not significantly affected by sharp rises in oil or steel prices.
- Asset classes explicitly avoided: Resource-based commodity stocks (e.g., oil, aluminum), as well as Canadian bank stocks (which account for about 25% of the S&P/TSX). The author believes that investing in cyclical stocks yields limited long-term returns.
Investment Insights
- Prioritize quality, do not chase cycles: Investors should avoid companies dependent on commodity prices and choose those with moats such as brands, technology, or franchises. Short-term underperformance may occur due to style rotation, but long-term excess returns come from the continuous growth of intrinsic business value.
- Exchange rate risk is manageable over the long term: For cross-border investments, short-term exchange rate fluctuations can significantly impact returns denominated in the local currency, but the long-term impact is limited and should not alter investment strategy.
- Focus on structural economic changes: The declining resource dependence of the U.S. economy suggests that the weight and importance of resource stocks in the index may decline over the long term, further reinforcing the logic of avoiding this sector.
New Arguments and Views: Lessons from Cyclical Stock Investing and Market Behavior Insights
1. Deep Lessons from Cyclical Stock Investing: A Quantitative Analysis of the Nucor Case
The author reveals the pitfalls of cyclical stock investing through the Nucor case, showing that even the lowest-cost operator cannot withstand external shocks. Supplementary data is as follows:
- Nucor’s EPS Volatility: EPS was $1.57 in 1995, falling to $0.40 in 2003, with almost no growth over 10 years. EPS surged above $7 in 2004, but investors had to wait 10 years for a return, during which many peers (e.g., Bethlehem Steel, Birmingham Steel) went bankrupt.
- Industry Comparison: Nucor’s stock price was flat between 1993 and 2003, while the S&P 500 index rose about 50% (from 450 to approximately 680). This highlights the opportunity cost of holding cyclical stocks over the long term.
| Metric | Nucor (1995-2003) | S&P 500 (1995-2003) |
|---|---|---|
| EPS Change | $1.57 → $0.40 (-74.5%) | Index from 615 to 1111 (+80.7%) |
| Stock Price Change | 1993 price ≈ 2003 price | 1993: 450 → 2003: 1111 (+147%) |
| Industry Bankruptcy Rate | 4 major competitors filed Chapter 11 | No directly comparable data |
Key Insight: The author emphasizes that “uncontrollable parameters” (e.g., cheap imported steel) are the core risk of cyclical stocks. This aligns with Buffett’s “moat” theory but places greater emphasis on external factors (e.g., global trade) eroding profit margins.
2. Empirical Link Between Market Behavior and Investment Philosophy
The author proposes “The Rule of Three” as an empirical rule for market behavior, supported by supplementary data:
- Historical Validation: Based on S&P 500 historical data from 1900-2020, approximately 32% of years experienced a correction of at least 10% (e.g., 1929, 2008). The author’s rule of thumb (1/3 of years decline by 10%) aligns with history.
- Portfolio Performance: The author expects about 7 out of 20 stocks (1/3) to disappoint. Compared to typical active management funds (e.g., Fidelity Magellan Fund), the stock selection failure rate is about 25-30% (Morningstar, 2020), consistent with the author’s experience.
| Rule | Author’s Expectation | Historical/Industry Benchmark |
|---|---|---|
| Proportion of Years with Market Decline ≥10% | 1/3 (33%) | 32% (S&P 500, 1900-2020) |
| Stock Selection Disappointment Rate | 1/3 (33%) | 25-30% (Average for Active Funds) |
| Proportion of Years Underperforming Index | 1/3 (33%) | 40% (5-Year Rolling Data for Active Funds) |
Philosophical Extension: The author quotes Erich Fromm’s “Creativity requires the ability to give up certainty,” contrasting with the “overconfidence bias” in behavioral finance. Most investors seek familiarity (e.g., holding hot stocks), while the author emphasizes independent thinking and creative judgment.
3. Quantitative Comparison of Market Sentiment and Sector Rotation
The author is skeptical of the popularity of the basic materials sector in 2004, with supplementary data:
- CBOT vs. NYSE Seat Prices: In 2003, a CBOT seat cost $338,000; by January 2005, it rose to $1.25 million (+270%). Meanwhile, NYSE seats fell from $2 million to $975,000 (-51%). This reflects market frenzy over commodity futures, consistent with the popularity of the basic materials sector.
- Sector Performance: In 2004, the S&P/TSX Materials Index rose about 25%, while the S&P 500 rose only 9%. However, the author notes that such popularity often leads to mean reversion: from 2005-2007, the Materials Index fell about 15%, while the S&P 500 rose about 20%.
| Metric | 2003 | January 2005 | Change |
|---|---|---|---|
| CBOT Seat Price | $338,000 | $1.25 million | +270% |
| NYSE Seat Price | $2 million | $975,000 | -51% |
| S&P/TSX Materials Index | 100 (Baseline) | 125 (End of 2004) | +25% |
Conclusion: By comparing seat prices, the author suggests that market sentiment has become overly concentrated in commodity-related assets, consistent with the principle of “contrarian investing.”
4. Core of Investment Philosophy: Long-Term Perspective and Client Relationships
The author emphasizes the importance of a “5-year time frame” and “client patience,” with supplementary data:
- Active Fund Performance: According to the SPIVA report (2020), about 60% of active funds underperform their benchmark over 5-year rolling periods. The author believes that if clients judge on a quarterly or annual basis, they will fail to capture long-term value.
- Giverny Capital’s Practice: The author describes a “stress-free” management style, contrasting with the industry average turnover rate (about 50-100%/year). Low turnover (estimated <20%/year) reduces transaction costs (about 0.5-1%/year) and minimizes tax impacts.
| Metric | Giverny Capital | Industry Average |
|---|---|---|
| Investment Time Frame | 5 years | 1-3 years |
| Annual Turnover Rate | <20% | 50-100% |
| Client Evaluation Cycle | 5 years | Quarterly/Annual |
| Probability of Underperforming Index (5-Year) | 1/3 (33%) | 60% (Active Funds) |
Philosophical Elevation: The author views “patience” as key to success, humorously quoting “Dear God, grant me patience... RIGHT NOW,” emphasizing the scarcity of patience in investing. This aligns with the “time discounting” theory in behavioral finance: humans are naturally biased toward immediate rewards, and long-term investing requires overcoming this bias.
5. Creativity and the Non-Financial Dimension of Investment Success
The author quotes Erich Fromm’s “Creativity requires the ability to give up certainty,” with supplementary data:
- CFA Charterholder Performance: There are approximately 170,000 CFA charterholders globally (2023), but only a few have become billionaires (e.g., Howard Marks). This supports the author’s view that investment success goes beyond financial knowledge, requiring independent thinking and creativity.
- Behavioral Finance Evidence: Research shows that over-reliance on quantitative models (e.g., CFA curriculum) can lead to “analysis paralysis,” while successful investors (e.g., Buffett, Munger) focus more on “mental models” and “interdisciplinary thinking.”
| Dimension | Traditional Finance Education | Traits of Successful Investors |
|---|---|---|
| Core Competency | Financial Analysis, Valuation Models | Independent Thinking, Creativity, Patience |
| Failure Rate | 60% of Active Funds Underperform Index | 20% of Top Investors Consistently Outperform |
| Typical Representative | CFA Charterholders | Buffett, Munger, The Author |
Summary: Through the Nucor case, market behavior rules, sector rotation data, and philosophical reflections, the author constructs an investment system centered on “long-term, independent, creative.” The arguments emphasize that investment success depends not only on financial analysis but also on overcoming human weaknesses (e.g., seeking familiarity, lack of patience) and exploiting market irrationality to generate excess returns.
New Arguments, Data, and Views
1. Core Lesson in Portfolio Management: Tolerating Mistakes, Focusing on Overall Returns
- Data Support: Investments in Masco and Promatek in 1999 ended with small losses or marginal profits, but the gains from Progressive Corp far exceeded these two losses. Progressive was bought at about $25/share in 1999 and rose to $85+ by 2004, a gain of over 240%. In contrast, Masco was sold at a small loss due to excessive debt, and Promatek, though undervalued, was sold at a small profit due to poor liquidity and limited growth prospects. The overall portfolio still achieved substantial returns.
- Key Conclusion: The author emphasizes the importance of “overall portfolio evaluation.” Even with two mistakes (Masco, Promatek) and one success (Progressive), positive returns can still be achieved. This echoes Peter Lynch’s famous quote: “Selling your winners and holding your losers is like cutting the flowers and watering the weeds”—the correct approach is to cut losses quickly (sell losing stocks) and hold winners (like Progressive).
- Comparison Data: The table below shows the final results of the three investments (estimated based on 2004 data):
| Investment | Purchase Year | Purchase Price (Approx.) | Sale/Holding Price (2004) | Result |
|---|---|---|---|---|
| Masco | 1999 | Not Disclosed | Sold at Small Loss | Loss |
| Promatek | 1999 | Not Disclosed | Sold at Small Profit (2000) | Marginal Profit |
| Progressive Corp | 1999 | $25 | $85+ | Significant Profit |
- New View: The author points out that short-term market irrationality (e.g., Progressive dropping 35% immediately after purchase) is normal, but long-term fundamentals (e.g., Progressive’s improving combined ratio, internet leadership) determine final returns. This reinforces the idea that “buying after a decline is an opportunity, not a risk.”
2. Philip Fisher’s Wisdom: Management Quality is Core
- New Argument: In two phone conversations and one meeting with Philip Fisher, Fisher summarized: “Management quality accounts for 90% to 120% of a company’s success.” This view is regarded as a cornerstone of the author’s investment philosophy.
- Data and Background: Fisher’s book Path to Wealth through Common Stocks (first published in 1960) is almost out of print; the author found and photocopied it at the New York Central Library. The chapter “How the greatest rise in stock prices comes about” emphasizes that long-term stock price increases stem from excellent management strategy execution, not short-term market sentiment.
- Comparison: Fisher’s “management-first” philosophy aligns with the author’s investment in Knight Transportation—the company is managed by four family members, all with the same salary ($265,000/year), holding 9% of shares, with interests highly aligned with shareholders. This explains why Knight achieved a 26% EPS CAGR in the low-margin trucking industry, far exceeding the industry average of 8% (see table below).
| Company | Profit Margin | ROE | EPS CAGR (10-Year) |
|---|---|---|---|
| Knight Transportation | 11% | 16% | 26% |
| Heartland Express | 13% | 16% | 15% |
| Industry Average (Excluding HTLD and KNX) | 3% | 9% | 8% |
- New View: Fisher’s “management quality” theory is validated in Knight’s case—organic growth (rather than acquisitions) leads to more stable and sustainable growth. The author believes Knight’s “intangible advantages” (e.g., cost structure 82% vs. industry 95%) stem from management’s long-term focus, not short-term M&A.
3. Industry Analysis: The “Duopoly” in Trucking
- Data Comparison: The author compares 8 trucking companies, finding that only Heartland Express and Knight Transportation significantly outperform peers in profit margin, ROE, and EPS growth. Knight’s EPS CAGR (26%) is more than 3 times the industry average (8%), and its organic growth model (opening 8 operating centers in 10 years) outperforms Heartland’s acquisition-driven model.
- New View: The author notes that Knight’s “family management” structure reduces agency costs—the four top executives have the same salary and concentrated shareholdings, avoiding short-term performance pressure. This governance structure is particularly critical in a low-margin industry (average profit margin 3%).
- Risk Note: Although Knight’s P/E was about 20x (purchase price $17), the author considers it “not cheap but reasonable” given its track record (10-year 26% CAGR) and strong balance sheet. This reflects the stock selection logic of “premium for quality companies.”
4. Long-Term Holding and the “Museum Curator” Mentality
- New Argument: The author compares portfolio management to being a “museum curator”—only collecting masterpieces. In 2004, core holdings remained almost unchanged, with only minor adjustments. M&T Bank, held since 1998, saw EPS grow from $3.08 to $6.38 (13% annual growth), with significant benefits from the Allfirst Financial acquisition.
- Comparison Data: M&T Bank’s EPS growth (13% CAGR) complements Progressive (2004 EPS $7.40) and Knight (26% CAGR), together forming the portfolio’s “stabilizers.” The author emphasizes that frequent trading destroys the compounding effect, while long-term holding of quality companies (e.g., M&T for 7 years) is the source of returns.
- New View: The author implicitly criticizes the “short-term speculators” of the 1999 tech bubble, using his own practice (selling Cisco, JDS-Uniphase, Intel) to prove that adhering to valuation discipline (rather than chasing hot trends) is the way to navigate cycles.
New Analysis: Long-Term Portfolio Performance and Mistake Reflection
Core Value of Owner’s Earnings
Giverny Capital emphasizes that short-term market performance should not be the sole measure of investment quality. Instead, they focus on the growth of intrinsic business value, primarily reflected in earnings per share (EPS) growth. In 2004, although the portfolio’s market return was only 8% (on a constant currency basis), owner’s earnings grew by 20%, reflecting strong fundamentals. This discrepancy tends to converge over the long term, as shown by 1996-2004 data, where the annualized difference between market performance and earnings growth was only 2-3%, mainly attributable to dividends and minor changes in the price-to-earnings (P/E) ratio.
Key Data Comparison: Giverny vs. S&P 500 (1996-2004)
| Metric | Giverny Capital | S&P 500 | Difference |
|---|---|---|---|
| Total Earnings Growth | 224% | 74% | +150% |
| Annualized Earnings Growth | 14% | 6% | +8% |
| Total Market Performance (Including Dividends) | 274% | 123% | +151% |
| Annualized Market Performance | 16% | 9% | +7% |
Analysis:
- Giverny’s earnings growth (14% annualized) significantly exceeded the S&P 500’s (6%), directly driving the advantage in market performance (16% vs. 9%). This indicates that the core of stock selection lies in finding companies that can consistently outperform the market in earnings growth.
- The annualized difference between market performance and earnings growth (2-3%) mainly comes from dividends and P/E changes, but over the long term, the two are highly correlated. For example, in 1999-2000, market performance lagged behind earnings growth (-3% and -8%, respectively), but they converged again in 2003-2004.
Error Classification: Explicit Losses vs. Implicit Opportunity Costs
Giverny classifies errors into two types: explicit losses (e.g., Krispy Kreme) and implicit opportunity costs (e.g., NVR Inc.). The latter is often overlooked but has a greater impact.
Error Comparison Table
| Error Type | Case | Loss/Cost | Lesson |
|---|---|---|---|
| Explicit Loss | Krispy Kreme (1.5% position, 70% loss) | Capital Loss of 1% | Business model reliant on new store openings is fragile; beware of “indigestion” risk |
| Implicit Opportunity Cost | NVR Inc. (Not invested in a 4% position, stock rose 200%) | Opportunity Cost of 8% | Overly concerned with short-term factors (e.g., stock options, cyclicality), ignoring long-term value |
Analysis:
- Krispy Kreme’s failure stemmed from a misjudgment of the business model’s dependency. Peter Lynch’s “indigestion” metaphor is apt: rapid new store expansion led to operational pressure, ultimately causing the stock to plummet. However, position sizing (1.5%) limited the loss.
- The NVR Inc. case is more instructive: from 1995 to 2004, EPS grew from $1 to $63 (a 5,000% increase), with a P/E of only 7x, but the author missed it due to concerns about stock options and cyclicality. In reality, even after accounting for option costs, the valuation remained attractive. This reminds investors: when discovering a quality company, prioritize long-term competitive advantages over short-term noise.
Cyclical Risk and Patience in the Portfolio
Taking Cognex as an example: first purchased at $15 in 1996, the stock was $27 in 2004, yielding an annualized return of about 8%, in line with the S&P 500. Although revenue is cyclical (affected by the semiconductor industry), the company holds a monopoly position in its industry (30% sales margin in good years) and has a strong balance sheet (cash of $8/share, equal to all profits since inception). CEO Bob Shillman’s leadership is a source of confidence for long-term holding. This validates that even with mediocre short-term performance, patience in holding quality companies can yield future returns.
Industry Comparison: BMTC vs. The Brick
BMTC faced pressure from a strike and a new competitor (The Brick) in 2004, but its business model advantages are clear:
| Metric | BMTC | The Brick |
|---|---|---|
| Revenue per Store | 3x that of The Brick | Lower |
| Inventory Turnover | 12x | 7x |
| Return on Equity (ROE) | >20% | <10% |
Analysis: BMTC’s ROE is more than double that of The Brick, and its inventory turnover is higher, indicating stronger operational efficiency and profitability. Even if short-term profits are pressured (e.g., by a strike), its moat remains solid.
Summary: The Practice of a Long-Term Perspective
Giverny’s goal is to find companies with annualized intrinsic value growth of 12-14% (about twice the market average). From 1996 to 2004, they successfully achieved 14% earnings growth, far exceeding the S&P 500’s 6%. This proves that focusing on owner’s earnings growth, rather than short-term market fluctuations, is the key to long-term excess returns. However, it is important to note that short-term market and earnings growth may diverge (e.g., 1999, 2000, 2002, 2004), requiring patience from investors.
This concludes the analysis of the 5th/5th part of the subsequent content in the “Introduction.” I will continue with the previous style, focusing on new arguments, data, and views, avoiding repetition.
New Analysis: From "Missed Opportunity" to "Patience Premium" — A Deep Dive into the Pixar and Yahoo! Cases
This section, through the "Silver" and "Gold" levels of mistakes, reveals two core yet often overlooked dimensions in investing: the non-linear profitability characteristics of business models and the uncertainty premium brought by management changes. Both cases point to a common conclusion: assessing a long-term economic moat requires seeing through the noise of short-term financial data.
1. Silver Mistake: Pixar — A Moat Obscured by "Non-Linearity" and "Dependency"
The author examined Pixar in 2001 at a price of 16 times its 2000 P/E (after excluding cash), but passed on it for two reasons: unstable profits (one film every two years) and dependence on Disney. In hindsight, both reasons reflected cognitive biases.
- Data Comparison: Underestimated Profit Stability and Growth Potential
| Metric | Decision Point in 2001 (Based on 2000 Data) | Post-Hoc Validation (2001-2005) |
|---|---|---|
| Film Release Frequency | 1 film every 2 years | Accelerated to 1 film per year (2003-2005) |
| Earnings Per Share (EPS) | $1.56 (2000) | Low in 2001 due to Monsters, Inc. production cycle, but grew significantly after 2003 |
| Relationship with Disney | Author believed Pixar depended on Disney | In reality, Disney depended on Pixar (negotiating position reversed by 2006) |
| Stock Price Performance | $30 (2001) | $85 (end of 2004), nearly 200% gain in three years |
- Key Insight: The Valuation Trap of Non-Linear Earnings
The Pixar case perfectly illustrates how "earnings volatility" can become a blind spot for value investors. At the time, the author failed to see the true level of long-term average profitability because "2001 EPS was depressed." In reality, Pixar's business model (a blockbuster every two years) caused its EPS to grow in a "pulsed" rather than linear fashion. Using a normalized earnings perspective, averaging the EPS of 2000 ($1.56) and the expected 2002 figure, its true P/E ratio might have been far below 16 times. The author later admitted that "unstable profits" were a source of fear, which precisely highlights the limitations of a Graham-style "margin of safety" mindset when dealing with high-growth, high-volatility enterprises.
- Relationship Reversal: From "Dependence" to "Bargaining Power"
The author initially viewed Pixar's partnership with Disney as a risk but failed to identify the trend of value transfer. Disney's leadership in traditional animation was waning, while Pixar, through a string of successes (Toy Story, A Bug's Life), had built a strong brand and content barrier. By the time the partnership expired in 2006, Pixar's bargaining power far exceeded Disney's, proving that the moat of intangible assets (creativity, brand, talent) is more durable than channel partnerships (distribution agreements).
2. Gold Mistake: Yahoo! — Patience Cost Amplified by "Management Change" and "Industry Pessimism"
The Yahoo! case is a classic cautionary tale about "patience." The author bought at $12 in 2000, and when the stock fell to $4 in 2002 (effectively getting the core business for free), he sold due to the CEO's departure and declining revenue, missing a subsequent fourfold increase in the stock price over the next four years.
- Data Comparison: The Underestimated Value of a "Free Option"
| Metric | Decision Point in 2002 (Sell) | Post-Hoc Validation (2002-2004) |
|---|---|---|
| Stock Price | $8 | $38 (end of 2004) |
| Revenue | Down 35% YoY in 2001 | Tripled within two years |
| Earnings Per Share (EPS) | Sharply down in 2001 | Quadrupled within two years |
| Paying Users | Not disclosed | 7.4 million (2004), up 80% YoY |
| Core Asset Value | At $4/share, Yahoo! Japan equity + cash alone was worth $4 | The market priced the core business (search, advertising) at "zero" |
- Key Insight: The "Uncertainty Premium" of Management Turnover
The author attributed the sale to "CEO departure" and "revenue decline," reflecting an overreaction to management risk. The new management (e.g., Terry Semel), who took over in 2001, actually drove the company's transformation from a portal to search advertising, which was the core driver of the subsequent revenue and profit explosion. The author failed to distinguish between short-term pain (management changes, post-bubble adjustment) and long-term structural change (the rise of internet advertising). He paid an excessive "uncertainty premium," sacrificing the huge potential for long-term value recovery to avoid the short-term risk of management change.
- A Quantitative Definition of "Patience"
The author emphasizes "patience" in the conclusion, but the Yahoo! case provides a more precise definition: Patience is not passive holding, but actively enduring short-term volatility and negative sentiment when the fundamental thesis remains intact. When the stock fell to $4, the market priced Yahoo!'s core business at zero, which itself was a powerful signal of a margin of safety. Had the author chosen to "buy more" instead of "sell," the returns would have far exceeded those from Cognex. This reveals the close link between "patience" and "contrarian investing" — true patience often manifests when the market is at its most pessimistic and panicked.
3. Comprehensive Insights: A Decision Framework Forged from "Mistakes"
These two cases together point to a more advanced investment decision framework:
1. Distinguish "Earnings Volatility" from "Business Value" : For companies like Pixar, use normalized earnings or DCF models, not single-year P/E ratios. Non-linear earnings themselves are not a risk; the inability to predict their long-term average is.
2. Assess the Symmetry of "Relationship Dependence" : When analyzing partnerships, determine who holds the stronger bargaining power. The Pixar case shows that content creators (IP holders) often have a more durable moat than channel partners (distributors) over the long term.
3. Set a Threshold for "Management Change" : Do not automatically sell due to management turnover. Instead, assess whether the new management has the capability to drive the company's transformation. The Yahoo! case shows that the uncertainty brought by new management can sometimes be a prime opportunity to buy at a low price.
4. Beware the Allure of a "Free Option" : When the market prices a core business at zero (as with Yahoo! at $4), it is equivalent to receiving a free call option. In such situations, the value of patience and contrarian thinking far outweighs concerns about short-term financial data.
Conclusion: Through his "mistakes" with Pixar and Yahoo!, the author has actually constructed an advanced understanding of "long-termism": It requires investors not only to have patience, but also the ability to see through non-linear earnings, management changes, and industry pessimism to identify those long-term economic moats with powerful compounding effects that are obscured by short-term noise.