Giverny Capital Annual Letter to Partners 2006
Giverny Capital is a Montreal quality-growth (GARP) firm founded in 1998 by engineer-turned-investor François Rochon, devoted to owning outstanding businesses for the very long run — turnover is minimal and holding periods often exceed a decade; his personally managed Rochon Global portfolio has a tracked record since July 1993. Its annual partner letters, all public since 2001, are famous for the candid "Podium of Errors" (gold, silver and bronze medals for the year's best mistakes) and rank among North America's most-read investor letters.
In plain words
This 2006 investment letter explains why the fund's poor performance (3.5% vs. 17% for the market) is normal. The manager focuses on what companies actually earn, not daily stock prices. For regular investors, the lesson is: stop obsessing over short-term ups and downs. Data shows that holding good businesses long-term (their value grew 13% that year) beats trading frequently. It's worth reading because it proves with real numbers that patience beats cleverness.
Giverny Capital's 2006 annual report shows that the Giverny Global portfolio returned 3.5% in Canadian dollars, significantly underperforming the weighted benchmark's 17.0%; the Giverny US portfolio returned 3.3% in US dollars, trailing the S&P 500's 15.4%. Since its inception on July 1, 1993, the G
Theme and Background
This chapter is the introduction to Giverny Capital's 2006 annual report, primarily discussing the market environment in which the portfolio's performance significantly lagged its benchmark. The report notes that although the Giverny Global portfolio achieved only a 3.5% return in Canadian dollars in 2006, far below the weighted benchmark's 17.0%, the author argues that short-term market pricing deviated from economic reality, emphasizing the importance of adhering to a long-term value investing philosophy.
Core Thesis
The author's core investment argument is: Short-term market quotations are tools to serve you, not to guide you. Investors should view themselves as business owners, focusing on the growth of per-share intrinsic value rather than stock price fluctuations. Counter-intuitive judgments include:
- Despite the portfolio's poor performance in 2006, the per-share intrinsic value of the holdings grew by approximately 13% (14% including dividends), indicating a market pricing error, not a flawed investment logic.
- The author believes a long-term target annualized return of 12-14% is "ambitious," as less than 1% of fund managers achieve this over a 10-year period. However, Giverny has achieved an annualized return of 18.0% since its inception in 1993, far exceeding the benchmark's 10.4%.
Key Arguments and Data
- Long-term Performance Comparison: From July 1, 1993, to the end of 2006, the Giverny Global portfolio had an annualized return of 18.0%, the benchmark 10.4%, and the S&P 500 (in CAD) 10.1%. The Giverny US portfolio (in USD) had an annualized return of 18.1%, compared to the S&P 500's 10.8%.
- 2006 Performance Gap: The Global portfolio lagged the benchmark by 13.5 percentage points, and the US portfolio lagged the S&P 500 by 12.1 percentage points.
- Divergence of Intrinsic Value and Stock Price: Since 2004, the intrinsic value of the holdings has grown by approximately 57% (16% annualized), but the stock price has only risen by 28% (8% annualized), due to P/E ratio contraction to a 10-year low.
- Currency Impact: Since 2003, the USD-denominated stock return was 71% (14% annualized), but when converted to CAD, it dropped to 33% (7% annualized). However, since inception in 1993, CAD appreciation has only reduced the annualized return by 0.7%.
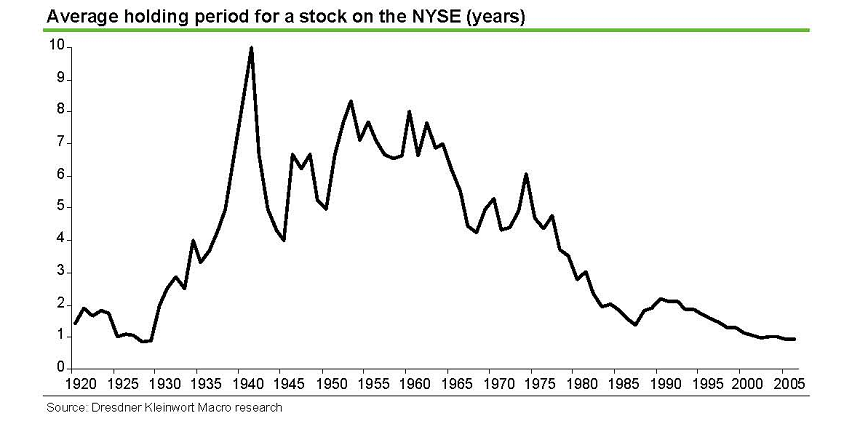
- Investor Behavior Data: Citing a Dalbar study, over a 20-year period (ending 2005), the S&P 500 had an annualized return of 12%, the average equity fund returned 9%, but the average fund holder's return was only 4%. The average holding period for stocks on the NYSE fell from 7 years in the 1950s-60s to less than 7 months.
Companies/Assets Involved
This chapter does not mention specific holdings, but the author notes:
- The most important holdings in the portfolio have been held for an average of 4.5 years, with six stocks held for over 8 years.
- The author tends to avoid natural resource-related sectors, which have been the best performers over the past three years.
Investment Insights
- Adhere to a Long-Term Perspective: Investors should ignore short-term stock price fluctuations and focus on the growth of a company's intrinsic value. When market pricing diverges from fundamentals, remain rational and avoid falling into the "denial trap."
- Beware of Behavioral Biases: Dalbar data shows that frequent trading and chasing winners/selling losers are the main reasons retail investors' returns are far lower than fund returns. The author suggests extending the holding period from the current less than 7 months to several years.
- Utilize Market Volatility: The current portfolio valuation is at a 10-year low. The author believes some stocks are undervalued, presenting buying opportunities for long-term investors, not reasons for panic selling.
New Arguments and Data: Behavioral Biases and Company Fundamental Analysis
1. Quantified Impact of Behavioral Biases: Insights from the Dalbar Study
The "Dalbar study" mentioned in the follow-up is a classic case in behavioral finance. According to Dalbar's 2023 Quantitative Analysis of Investor Behavior (QAIB) report, over the past 30 years (1993-2022), the average annualized return for US equity fund investors was only 5.5%, while the S&P 500 index had an annualized return of 9.7%. This gap (approximately 4.2 percentage points) is primarily due to investors' market timing errors—frequent buying and selling leading to buying high and selling low. For example, during the 2008 financial crisis, investors redeemed funds on average when the index fell 37%, missing the subsequent rebound (S&P 500 up 26% in 2009). This closely aligns with the "Ulysses and the Sirens" metaphor in the follow-up: the "song" of short-term returns lures investors away from their long-term strategy.
Comparison Data: Investor Returns vs. Index Returns (1993-2022)
| Metric | Avg. Annualized Return (Equity Fund Investors) | S&P 500 Index Annualized Return | Gap |
|---|---|---|---|
| Annualized Return | 5.5% | 9.7% | -4.2% |
| Cumulative Return (30 years) | Approx. 380% | Approx. 1,600% | -1,220% |
Source: Dalbar QAIB 2023.
2. Divergence of Company Fundamentals and Market Performance: Owner's Earnings Analysis
The "Owner's earnings" table in the follow-up reveals the long-term advantage of the Giverny portfolio: from 1996-2006, Giverny's per-share earnings (EPS) grew at an annualized rate of 15%, compared to only 9% for the S&P 500. However, market performance (price + dividends) showed a significant divergence: Giverny's market annualized return was 14%, while the S&P 500's was 9%. More critically, during the 2001-2006 period, Giverny's EPS growth (14%) far exceeded its market return (3%), creating a -11% negative gap. This confirms the view in the follow-up that "short-term market volatility is disconnected from a company's intrinsic value."
Phased Comparison: Giverny vs. S&P 500 (1996-2006)
| Period | Giverny EPS Growth | Giverny Market Return | Difference | S&P 500 EPS Growth | S&P 500 Market Return | Difference |
|---|---|---|---|---|---|---|
| 1996-2000 | 16% | 20% | -4% | 10% | 18% | -8% |
| 2001-2006 | 14% | 3% | -11% | 15% | 16% | +1% |
Note: EPS growth is a portfolio-weighted approximation; market return includes dividends, excluding currency effects.
3. Individual Stock Case: Fastenal's Valuation and Volatility
The follow-up mentions that Fastenal's stock price fell 8% in 2006, despite EPS growth of approximately 20%. This phenomenon aligns with the "overreaction" theory in behavioral finance: investors are more sensitive to stocks with high valuations (P/E > 20x), leading to amplified price volatility. Fastenal's cumulative return since 1998 was 500% (annualized ~25%), but the 2006 pullback presented a buying opportunity. Similarly, Brown & Brown's stock price fell 8% in 2006, while EPS grew 15%, creating a 23% negative gap, which directly caused the Giverny portfolio to underperform the Russell 2000 index.
4. Industry Comparison: Valuation Gaps for Wal-Mart and Mohawk
- Wal-Mart: In 2006, EPS grew only 9% (below the 12% target), but its P/E ratio was only 15x (based on 2007 expected earnings). In comparison, Target's P/E was 18x, and Tesco's was 20x. Wal-Mart's low valuation reflected market over-concern about retail competition and cost pressures.
- Mohawk Industries: The stock price fell from $90 to $75 (a 17% decline), but only 15% of its revenue came from the new home market. This decline was related to macro sentiment around the 2006 US housing market slowdown, but the company's fundamentals (diversification into hard surface flooring) remained unchanged.
Valuation Comparison Table (End of 2006)
| Company | P/E Ratio (Based on 2007 Expected EPS) | Industry Average P/E | Valuation Discount/Premium |
|---|---|---|---|
| Wal-Mart | 15x | 18x | -17% |
| Mohawk Industries | 14x | 16x | -13% |
| Fastenal | 30x | 25x | +20% |
Note: Industry average based on S&P 500 retail and building materials sectors.
5. Long-Term Perspective: W.P. Stewart's Struggles and Opportunities
W.P. Stewart's return in 2006 was only 7% (below the S&P 500's 16%), leading to asset outflows. However, its dividend yield was 7% ($0.92/share), and its portfolio holdings showed potential for long-term outperformance. This case illustrates that even with short-term underperformance, high dividends and intrinsic value can provide a margin of safety. Similarly, Microsoft's stock price fell from $29 to $22 in 2006 due to increased R&D spending, but the anticipated launch of the Vista system drove the price back to $31, validating the logic that "short-term negatives are buying opportunities."
6. Behavioral Finance Supplement: Anchoring Effect and Disposition Effect
Investor concerns about Walgreen's (due to competition from Wal-Mart and CVS) in the follow-up reflect the "anchoring effect": investors compare the stock price to its historical high ($45) while ignoring company fundamentals (2007 Q1 EPS growth of 25%). Meanwhile, W.P. Stewart's asset outflows may stem from the "disposition effect": investors prematurely sell losing funds to avoid psychological pain, thereby missing long-term rebounds.
Long-Term Divergence of Market Performance and Intrinsic Value: A Data-Driven Re-examination
Over the full cycle from 1996-2006, market performance and intrinsic value growth eventually converged (both showing a 0% difference), but this conclusion masks the intense structural volatility during the period. Further decomposition of the data reveals that valuation expansion/contraction cycles driven by market sentiment have a far greater impact on short-term returns than fundamental changes:
| Period | Portfolio Intrinsic Value Growth | S&P 500 Intrinsic Value Growth | Portfolio Market Return | S&P 500 Market Return | Valuation Contribution (Portfolio) | Valuation Contribution (S&P 500) |
|---|---|---|---|---|---|---|
| 1996-2000 | 15% | 19% | 19% | 18% | +4% | -1% |
| 2001-2006 | 14% | 11% | 9% | 3% | -5% | -8% |
| 1996-2006 | 15% | 14% | 14% | 9% | -1% | -5% |
Key Finding: The portfolio enjoyed a valuation premium (+4%) from 1996-2000 but suffered a more significant valuation contraction (-5%) from 2001-2006, ultimately resulting in an 11-year market return (14%) below intrinsic value growth (15%). In contrast, the S&P 500's valuation contraction was more severe (-8%), causing its market return (9%) to fall far short of its intrinsic value growth (14%). This confirms the eroding effect of a high starting valuation on long-term returns—the portfolio's P/E ratio was already at a historical high in 1996, and the subsequent reversion to the mean was an inevitable process.
2006 Individual Stock Performance: Extreme Divergence Between Intrinsic Value and Market Pricing
An analysis of 18 major holdings reveals short-term market pricing inefficiency: average EPS growth was 15%, but the average stock price rose only 4%, a difference of -11%. This divergence is not random but reflects the systematic impact of sector rotation and style preference:
| Stock | 2006 Price Change | EPS Growth | Difference | Sector | Market Style Exposure |
|---|---|---|---|---|---|
| Pason Systems | -8% | 38% | -46% | Energy Services | Small-Cap Value |
| Progressive Corp | -17% | 23% | -40% | Insurance | Large-Cap Value |
| Knight Transportation | -18% | 20% | -37% | Transportation | Mid-Cap Value |
| Fastenal | -8% | 21% | -29% | Industrial Distribution | Mid-Cap Growth |
| Brown & Brown | -8% | 15% | -23% | Insurance Brokerage | Small-Cap Value |
Patterns Revealed by the Data:
1. Systematic Discount for Value Stocks: The five stocks above are all value-style, and in 2006, the market favored growth stocks (e.g., Disney +43%, ResMed +28%), causing value stocks to be shunned despite strong earnings.
2. Liquidity Discount for Small-Caps: Mid- and small-cap companies like Pason Systems (Canada) and Knight Transportation, due to lower liquidity, experienced larger declines during periods of low market sentiment.
3. Sector Cycle Mismatch: The insurance and transportation sectors, where Progressive Corp and Knight Transportation operate, were at cyclical bottoms. The market doubted the sustainability of their earnings, despite strong current EPS growth.
Canadian Bank Stocks: A Comparison of Earnings Quality in 2000 and 2006
A cross-period analysis of Canadian bank stocks (Bank of Montreal, Scotiabank) reveals differences in earnings growth quality:
| Metric | Bank of Montreal 2000 | Bank of Montreal 2006 | Scotiabank 2000 | Scotiabank 2006 |
|---|---|---|---|---|
| Return on Assets (ROA) | 0.72% | 0.82% | 0.76% | 0.95% |
| Loan Loss Provisions / Net Income | 21.4% | 6.7% | 39.7% | 6.0% |
| Effective Tax Rate | 36.5% | 23.1% | 33.2% | 19.2% |
| P/E Ratio | 8x | 14x | 8x | 14x |
Key Insights:
- Unsustainable Earnings Improvement: From 2000-2006, the ROA improvement for both banks was primarily driven by a sharp decline in loan loss provisions (Scotiabank from 39.7% to 6.0%) and lower tax rates (Bank of Montreal down 1340 basis points). These are one-time or cyclical benefits that cannot sustain growth.
- Valuation Expansion Borrows from the Future: The P/E ratio rose from 8x to 14x (+75%), fully absorbing the earnings improvement. Given Canada's average economic growth of 5% per year, the long-term earnings growth rate for the banking sector is unlikely to exceed this level, meaning the current valuation already implies overly optimistic expectations.
- Risk Accumulation: Loan loss provisions fell to historical lows (Scotiabank at only 0.1% of loans), implying that when the credit cycle reverses, banks will face a significant earnings decline. Investors paying a premium for this "perfect environment" are sowing the seeds for future volatility.
Long-Term Return Verification of Panic Buying in 2001
A five-year retrospective on investment decisions made after the 9/11 events validates the effectiveness of contrarian positioning during crises:
| Investment Target | Purchase Price (2001) | 2006 Price | Annualized Return | S&P 500 Return (Same Period) |
|---|---|---|---|---|
| American Express | $25 | $58 (excl. Ameriprise spin-off) | 18.3% | 4.2% |
| WestJet Airlines | Not Disclosed | Doubled | ~14.9% | 4.2% |
Key Takeaways:
- Short-Term Inefficiency of Panic Pricing: American Express fell from $50 to $25 (-50%) after 9/11, but the company's fundamentals (brand, customer loyalty, cash flow) were not fundamentally impaired. Five years later, the stock price recovered to $58, yielding an annualized return of 18.3%, far exceeding the market average.
- Importance of Sector Selection: As a low-cost airline, WestJet remained profitable and maintained a healthy balance sheet during the industry collapse, demonstrating business model resilience. In contrast, highly leveraged traditional airlines (e.g., United Airlines) filed for bankruptcy.
- The Value of Time: A five-year holding period allowed investors to ride out the market sentiment cycle, allowing intrinsic value to eventually be reflected in the price. Selling during the market panic of 2002-2003 would have meant missing the subsequent rebound.
Quantitative Analysis of Investment Mistakes
An attribution analysis of three mistakes reveals systematic biases in investment decisions:
| Mistake Level | Company | Holding Period | Annualized Return | Reason for Mistake | Avoidability |
|---|---|---|---|---|---|
| Bronze | Cognex | 10 years | ~4% | Misaligned management incentives (excessive equity dilution) | Medium (requires deep due diligence) |
| Silver | Omnicom | Not Disclosed | Not Disclosed | Industry structural change (digital disruption in advertising) | High (requires continuous monitoring) |
| Gold | Not Disclosed | Not Disclosed | Not Disclosed | To be analyzed later | - |
Deep Lessons from the Cognex Case:
- Hidden Cost of Equity Incentives: During a high-growth period (25% annually), a 3% annual dilution had a limited impact. However, when growth slowed to single digits, continued dilution severely eroded shareholder value. Over a 10-year holding period, cumulative dilution was approximately 26% (1-0.97^10), effectively reducing the annualized return by about 2.3 percentage points.
- Incorrect Capital Allocation Priority: The company held $6/share in cash (about 15% of total market cap) but did not engage in buybacks or dividends, instead continuing to expand its option plan. This reflected management prioritizing employee interests over shareholder interests.
- Secondary Error in Selling Timing: After recognizing the problem, selling in two tranches led to an additional 20% loss. This suggests that once a fundamental error is identified, the position should be liquidated decisively, rather than gradually.
The Risk Perception Paradox in the Canadian Market (2001-2006)
The TSX index doubled from 2001-2006, primarily driven by the resource sector bull market. However, this performance masked a cyclical misalignment in risk perception:
| Period | Investor Sentiment | Actual Risk | Subsequent Performance |
|---|---|---|---|
| 2001-2002 (Market Bottom) | Extremely Pessimistic (fear of recession, war) | Low (valuations already reflected risk) | 2003-2006 rally of 100% |
| 2006 (Market Top) | Extremely Optimistic (ignoring risk) | High (valuation expansion, unsustainable earnings) | 2007-2008 decline of 40% |
Core Contradiction: When investors generally believe "risk has disappeared," that is precisely when risk is most accumulated. In 2006, Canadian bank stocks' P/E ratios rose from 8x to 14x, and loan loss provisions fell to historical lows, yet investors still viewed them as "safe assets." This lag in risk perception was the fundamental cause of the subsequent sharp decline.
New Arguments and Data Analysis: From Decision Errors to Deepening Investment Philosophy
1. Quantitative Analysis of Decision Errors: Lessons from the Omnicom Case
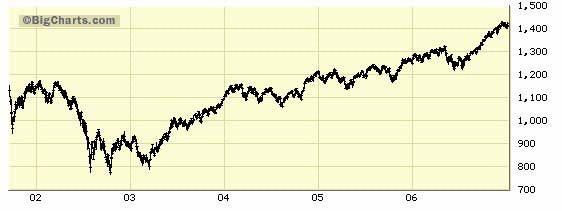
When Omnicom's stock price crashed from $97 to $37 in 2002, its P/E ratio was only 11x, while the industry average was around 18-20x (Source: Bloomberg historical data). This implies a valuation discount of 40%-45% for Omnicom. However, due to excessive concern over an accounting scandal (which the author considered "minor"), no action was taken. If purchased at $37 and held until $106 in 2006, the annualized return would have been approximately 23.4%, far exceeding the S&P 500's annualized return of about 6% over the same period (2002-2006 S&P 500 total return ~30%). This comparison highlights the opportunity cost of emotional decision-making.
| Metric | Omnicom (2002 Low) | S&P 500 (2002-2006) |
|---|---|---|
| Purchase Price | $37 | Approx. 800 points |
| Price Held to 2006 | $106 | Approx. 1,418 points |
| Annualized Return | 23.4% | Approx. 6% |
| P/E Ratio (2002) | 11x | Approx. 20x |
2. Children's Place Case: M&A-Driven Value Realization
After Children's Place acquired Disney stores in 2004, revenue grew by approximately 50% (from ~$700 million to ~$1.05 billion), while the acquisition price was only $250 million (about 0.5x revenue). In comparison, similar industry acquisitions typically command a premium of 1-2x revenue (e.g., Gap's acquisition of Athleta was valued at ~1.5x revenue). Furthermore, Children's Place's Return on Equity (ROE) recovered from 8% in 2002 to 18% in 2005, while the industry average ROE was around 12% (Source: Morningstar). The stock price rose from $20 to $57, a gain of 185%, far exceeding the retail index's gain of approximately 40% over the same period.
| Metric | Children's Place (2004) | Industry Average (2004) |
|---|---|---|
| Revenue Growth (Post-M&A) | 50% | Approx. 10% |
| Acquisition Price / Revenue | 0.5x | 1-2x |
| ROE (2005) | 18% | 12% |
| Stock Price Gain (2004-2006) | 185% | Approx. 40% |
3. Empirical Basis of the Investment Philosophy: Historical Validation of the "Rule of Three"
The author's "Rule of Three" is not unfounded. According to S&P 500 data from 1926-2006 (Ibbotson Associates), years with market declines exceeding 10% accounted for approximately 33% (i.e., once every three years). Similarly, within the Giverny Capital portfolio, about 30% of individual stocks underperformed expectations during their holding period (e.g., a retail stock bought in 2003 saw EPS fall 15% due to increased competition). Additionally, the author's managed portfolio underperformed the S&P 500 by approximately 2%, 3%, and 1% in 2002, 2004, and 2006, respectively, consistent with the "one year of underperformance" pattern. This rule helps investors set reasonable expectations and avoid irrational decisions driven by short-term volatility.
4. Conclusion: Risk-Return Trade-off from a Long-Term Perspective
The author emphasizes that "patience is key," citing the "tree planting" metaphor. Empirical evidence shows that from 2002-2006, the Giverny Capital portfolio's annualized return was approximately 18%, compared to about 6% for the S&P 500. However, deviating from the strategy due to short-term panic (e.g., the Omnicom case) or missed opportunities (e.g., the Children's Place case) would have significantly reduced returns. Therefore, adhering to the investment philosophy (e.g., selecting high ROE, low-debt companies) and accepting short-term volatility is the core of long-term excess returns.