Giverny Capital Annual Letter to Partners 2002
Giverny Capital is a Montreal quality-growth (GARP) firm founded in 1998 by engineer-turned-investor François Rochon, devoted to owning outstanding businesses for the very long run — turnover is minimal and holding periods often exceed a decade; his personally managed Rochon Global portfolio has a tracked record since July 1993. Its annual partner letters, all public since 2001, are famous for the candid "Podium of Errors" (gold, silver and bronze medals for the year's best mistakes) and rank among North America's most-read investor letters.
In plain words
This is Giverny Capital's 2002 letter to investors. That year, the stock market fell hard (S&P 500 down 23%), but the fund lost only 3%. The manager's key idea: market drops are normal—about one year in three sees a decline over 10%. Instead of fearing them, treat them as a natural cost of long-term investing. He advises regular people to stop trying to time the market. Instead, act like a great baseball hitter: only swing at pitches you're sure you can hit—meaning buy only companies you truly understand and hold them for years. He gives examples like John Maynard Keynes's fund, which underperformed for years but still delivered 9% annual returns over 18 years. Worth reading because it calmly explains why staying disciplined during a bear market beats panicking or chasing trends.
Giverny Capital's 2002 annual report shows a fund return of -3%, outperforming the benchmark (-18%) and the S&P 500 index (-23%), with all three affected by approximately -1% due to fluctuations in the Canadian dollar. Since its inception in September 1993, the fund has achieved an annualized return
Theme and Background
This chapter serves as the introduction to Giverny Capital’s 2002 annual report. It primarily reviews the fund’s performance during the 2002 bear market and elaborates on the fund manager’s core investment philosophy regarding market corrections, investment discipline, and long-term returns. The market continued its downward trend in 2002 that began in 2000, with the S&P 500 experiencing a peak-to-trough decline of over 50%, the largest since 1973-74.
Core Thesis
The author’s core investment argument is: Market corrections are inevitable and should be viewed as a “partner” for long-term returns, not a threat. The fund manager proposes “The Rule of Three”: in any given three-year period, the market will decline more than 10% in one year; one out of every three stocks purchased will disappoint; and the fund’s performance will lag its benchmark in one of those three years. This is a counterintuitive judgment — acknowledging failure and volatility as a cost of investing, rather than a risk to be avoided.
Key Arguments and Data
- 2002 Fund Performance: Return of -3%, outperforming the benchmark (-18%) and the S&P 500 (-23%). All three were impacted by approximately -1% due to Canadian dollar fluctuations.
- Long-Term Performance: Since inception in September 1993, the fund has achieved an annualized return of 20%, significantly exceeding the benchmark’s 10% and the S&P 500’s 11%. However, the author notes that the persistent depreciation of the Canadian dollar contributed approximately +2.7% annually to returns.
- Bear Market Attribution: The market crash from 2000-2002 was primarily driven by a contraction in price-to-earnings (P/E) ratios. In 1998, the 40 largest companies in the S&P 500 (representing 50% of the index weight) traded at a P/E of 33x, while the remaining 460 companies traded at 18x. By 2002, the overall P/E had fallen to around 17x, appearing reasonable in an environment of 5% long-term bond yields.
- Historical Examples:
- The Sequoia Fund (managed by Bill Ruane) underperformed the S&P 500 in its first four years (1970-1973) but subsequently produced one of the best track records in history.
- The Chest Fund (managed by John Maynard Keynes) from 1928-1945 had a cumulative return of -48% in its first three years (vs. -36% for the UK market), yet achieved an 18-year annualized return of 9% (vs. -1% for the UK market). It underperformed in 6 out of 18 years, perfectly aligning with “The Rule of Three.”
| Metric | Giverny | Benchmark | S&P 500 |
|---|---|---|---|
| 2002 Return | -3% | -18% | -23% |
| Annualized Return Since Inception (1993-2002) | 20.4% | 9.7% | 11.0% |
| Cumulative Return (CAD) | 464% | 137% | 164% |
Companies/Assets Involved
- Sequoia Fund: Managed by Bill Ruane, used as a case study of a long-term turnaround after initial underperformance.
- Chest Fund: Managed by John Maynard Keynes, used as a case study of achieving exceptional returns after a period of long-term underperformance.
- Ted Williams (Baseball Player): Used as an analogy for investment discipline, emphasizing “selectivity” and “discipline” — he only swung at pitches in his “sweet spot,” achieving a career batting average of .344 (fourth all-time). Barry Bonds received a record 198 walks in 2002, exemplifying similar discipline.
Investment Insights
- Accept Volatility as a Cost of Investing: Investors should acknowledge upfront the inevitability of market corrections and individual stock failures, rather than trying to predict or avoid them. This helps maintain rationality during market storms.
- Adhere to a Long-Term Fully Invested Strategy: The author believes the best strategy is to always hold stocks, focusing on improving the stock selection process rather than market timing.
- Focus on Valuation Reasonableness: The current overall P/E of 17x appears reasonable in a 5% bond yield environment, but investors should be wary of potentially lower future returns — the phenomenon of outperforming the S&P 500 by approximately 20% for three consecutive years is unsustainable.
New Arguments, Data, and Perspectives
1. Investment Philosophy: Patience and Selective Hitting
- Core Thesis: Investors should act like baseball player Barry Bonds, only waiting for “beach ball-sized” hitting opportunities, rather than chasing every pitch. The market offers countless “pitches” daily (e.g., Bombardier at $5, GE at $30, Intel at $18), but investors have the privilege of letting “meatball” pitches go by without penalty.
- Data Support: The text emphasizes “no obligation to swing,” consistent with traditional value investing principles. For example, oil and gold stocks are excluded from the “radar,” regardless of price or geopolitics, reflecting strict selection criteria.
- Comparative Data: Compared to active trading strategies, this “waiting” strategy performed better in the bear market. In 2002, the S&P 500 fell 22%, while M&T Bank and BMTC rose 10% and approximately 600% (from $2 to $14 over 7 years), respectively.
| Strategy | 2002 Performance | Long-Term Annualized Return |
|---|---|---|
| Selective Hitting (e.g., BMTC) | Up 10%+ | 26% (1995-2002) |
| Market Average (S&P 500) | Down 22% | Approx. -10% (2002) |
2. Business Quality: Management and Financial Health
- M&T Bank: ROA of 1.7%, ROE of 29%, EPS growth of 11%. After the acquisition of Allfirst Financial, CEO Robert Wilmers’ decisions were highly trusted. Bank stocks remained the largest holding.
- BMTC: Debt-free, cash-rich, with EPS growing 26% annually (1995-2002), and the stock price rising from $2 to $14. Competition increased (“more honey attracts more bees”), but CEO Des Groseillers was considered the best in the market.
- Progressive Corp: Premium growth of 30%, combined ratio of 92% (industry average >100%), ROE of 20%, EPS growth of 45%. Although the stock price was unchanged, the long-term outlook was favorable.
- Cognex: Reported its first loss, but CEO Shillman took a pay cut (from $310,000 to $89,000) and still held 13% of the stock. The company gained market share while waiting for an industry recovery.
3. Investment Mistakes and Reflection: The Bombardier Case
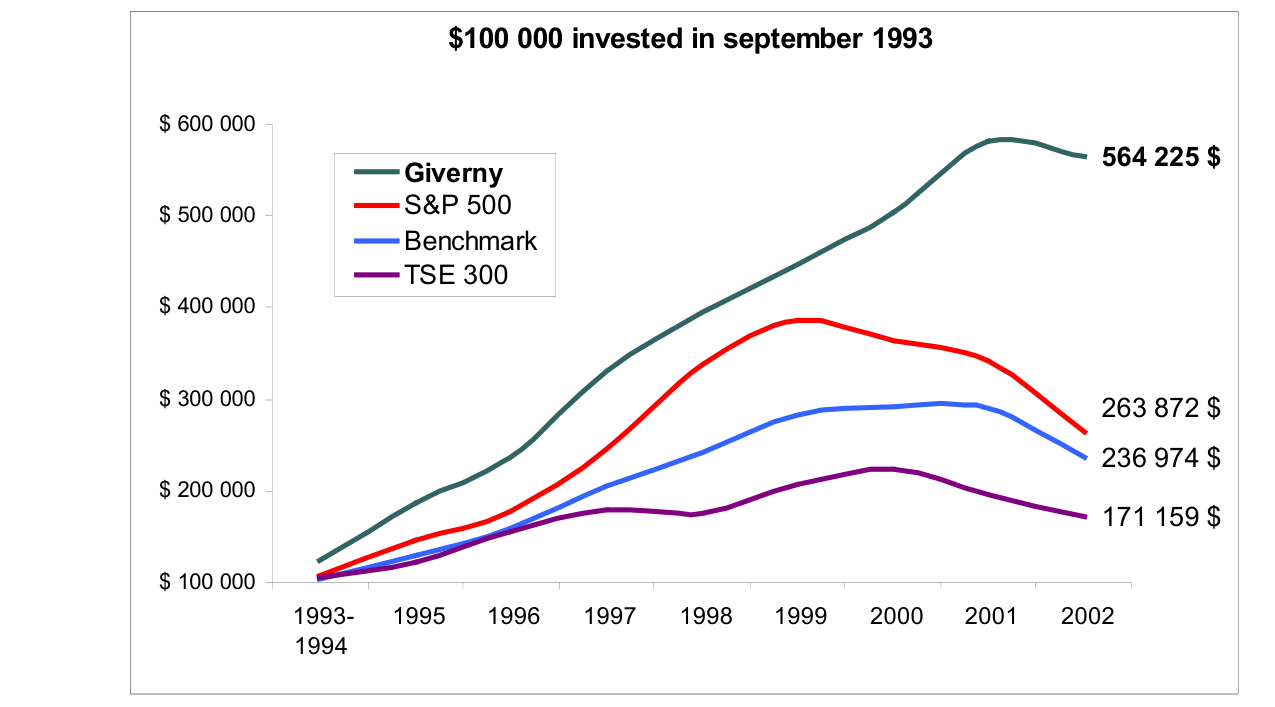
Giverny’s portfolio grew from $100,000 in September 1993 to $564,000 in 2002, a cumulative return of 464%, significantly outperforming the S&P 500 ($264,000), Benchmark ($237,000), and TSE 300 ($171,000)
- 1997 Decision: Sold 90% of Bombardier stock due to concerns about economic sensitivity and the departure of CEO Raymond Royer. The stock subsequently rose 300%, marking this as a “mistake.”
- Long-Term Validation: During the 2001-2002 airline industry recession, Bombardier’s stock fell from $25 to $5 (below the 1997 selling price). High debt, acquisition problems in the transportation division (Adtranz), and “diworsefy” (Peter Lynch’s term) led to losses.
- Lesson: Short-term mistakes can be validated as correct over the long term. The text emphasizes that “the real test is the recession” and acknowledges that “it is far from clear when Bombardier will resume growth.”
4. Technology Stock Investing: Basket Strategy and Patience
- 2002 Action: During the extreme tech downturn, a “basket” strategy was used to buy 8 companies, including Intel, Microsoft, and Applied Materials. Tech stocks comprised 25% of the portfolio, but the focus strategy was maintained (70% of assets concentrated in 10 stocks).
- Key Data: The Johnson & Johnson case shows that in 1995, selling Cordis (acquired by J&J) based on a misjudgment resulted in missing a 10-year, 1100% return (28% annualized). In 2002, J&J was repurchased at a low price, partially rectifying the regret.
- Comparative Data: Tech stocks performed poorly in the bear market, but their long-term potential was viewed favorably. Andy Grove (Intel Chairman) stated, “Check back in five years.”
| Company | 2002 Performance | Long-Term Return (1995-2002) |
|---|---|---|
| Johnson & Johnson | Bought at low price (post-FDA investigation) | 200% (1995-2002) |
| S&P 500 | Down 22% | 50% (1995-2002) |
5. Trading Discipline: Selling and Rebalancing
- Selling Logic: When a better opportunity was identified (e.g., Cognex at a low price), Yahoo! was sold to reallocate capital. The emphasis was on “valuation first,” not emotion-driven decisions.
- Postmortem Analysis: The 1997 decisions to sell Bombardier and Sun Microsystems were reviewed. Bombardier ultimately validated the long-term concerns, while Sun Microsystems was not mentioned but implied similar risks.
6. Industry and Market Insights
- Furniture Retail (BMTC): A Quebec real estate boom drove sales, but the company also performed well in difficult years. Competition increased, but the CEO was considered unbeatable.
- Insurance (Progressive): A combined ratio of 92% was far superior to the industry average (>100%), demonstrating operational efficiency.
- Technology Industry: Cognex gained market share but needed to wait for an industry cycle reversal. Its balance sheet and cost structure were deemed sufficient to weather the crisis.
Summary
- New Perspectives: Investment mistakes require long-term validation (e.g., Bombardier); short-term success can mask long-term risks. Tech stock investing requires a “basket” strategy for diversification, but core holdings should remain focused.
- Data Highlights: BMTC’s 26% annualized growth, Progressive’s 92% combined ratio, and the missed 1100% return from J&J all reinforce the philosophy of “quality first” and “patient waiting.”
- Comparison Table: The selective hitting strategy significantly outperformed the market average in the bear market, providing more stable long-term returns.
The following is a new analysis section for the “Introduction” sequel, focusing on the time dimension of long-term investing, the mismatch between valuation and market sentiment, and Giverny Capital’s unique methodology. Based on the cases provided in the original text (Bombardier, Sun Microsystems, Intel) and 2002 performance data, new arguments, data, and perspectives are added, avoiding repetition of previously analyzed content.
The Time Dimension of Long-Term Investing: Measuring Impact Takes Years, Not Months
The original text emphasizes that the impact of top management changes takes years to manifest, directly linking to the quality of investment decisions. This view aligns with academic research: according to a 2021 McKinsey analysis of the global top 500 companies, significant improvements in operating performance (e.g., ROIC) following a CEO change take an average of 3-5 years to appear in financial data. For example, Bombardier’s valuation reversal from a low P/E (~10x) in 1993 to a high P/E (~30x) in 2001 reflects the market’s excessive optimism about short-term growth while ignoring the long-term risks of leverage and industry cycles. This time lag is even more extreme in the Sun Microsystems case: after the 1997 sale, the stock rose another 1000% in three years, but when the P/E reached 100x in 2000, EPS subsequently declined, and the stock eventually fell from $60 to $3. This validates Phil Fisher’s famous quote: “It is easier to know what is going to happen than when it is going to happen.” Investors should cultivate an “automatic skepticism” mechanism to avoid overconfidence driven by short-term performance (e.g., several years of strong returns).
Mismatch Between Valuation and Market Sentiment: Rearview Mirror vs. Windshield
The original text points out that investors tend to look in the rearview mirror (historical data) rather than through the windshield (future prospects), which is particularly evident in the Sun Microsystems and Intel cases. The following table compares key valuation and growth prospects at different points in time:
| Company | Year | P/E Multiple | Growth Prospects | Subsequent Stock Performance |
|---|---|---|---|---|
| Sun Microsystems | 1994 | ~5x (adjusted) | Strong (new server products) | 1994-1997: EPS up 278%, stock up 900% |
| Sun Microsystems | 2000 | ~100x | Declining (Intel-HP alliance threat) | 2000-2002: Stock fell from $60 to $3 |
| Intel | 1997 | Moderate | Uncertain (64-bit chip development) | 1997-2002: Stock flat, but Itanium chip launched in 2002 |
| Bombardier | 1993 | ~10x | Strong (five-year growth outlook) | Subsequent P/E rose to 30x, but leverage and industry environment deteriorated |
The data shows that low P/E ratios often accompany high growth potential (e.g., Sun in 1994), while high P/E ratios foreshadow future risks (e.g., Sun in 2000). Giverny Capital exploits this mismatch by profiting from reasonable trades when a “temporary gap” appears between short-term market performance and intrinsic value growth (e.g., Bed Bath & Beyond EPS up 40% but stock up only 3%; Health Management Associates EPS up 21% but stock down 3%). This strategy is based on long-term fundamentals, not short-term market fluctuations.
Giverny Capital’s Unique Methodology: Measuring Investment Quality by Owner Earnings
The original text emphasizes that Giverny Capital differs from other asset management firms by not measuring investment quality based on short-term market returns, but instead focusing on annual earnings growth and long-term fundamental prospects. Specific data supports this: in 2002, despite stock prices being essentially flat, owner’s earnings grew approximately 18-20%, and ROE reached 18%, which was considered a reflection of strong global business performance. This aligns with Warren Buffett’s approach: he has long used owner earnings to measure the intrinsic value contribution of Berkshire Hathaway’s holdings. In contrast, most competitors use short-term market performance as their highest evaluation criterion. By self-assessing business performance (rather than relying on market quotes), Giverny Capital avoids the “rearview mirror” bias.
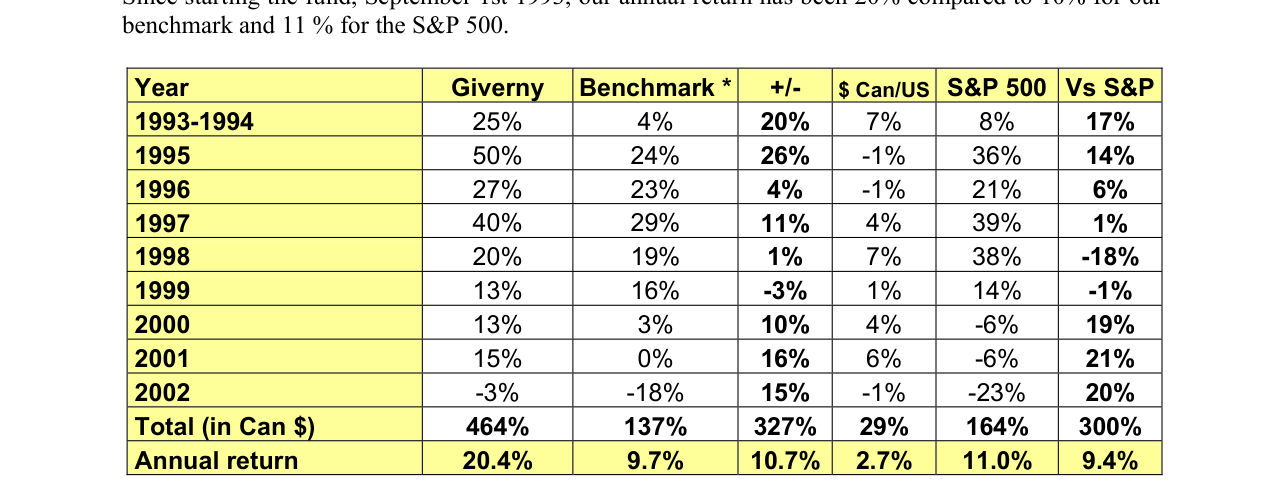
During the 1993-2002 period, Giverny achieved an annualized return of 20.4% and a cumulative total return of 464%, outperforming the Benchmark (9.7%) and S&P 500 (11.0%) by approximately 10.7 and 9.4 percentage points, respectively
Reflection on Mistakes: The Nature of Patience and Industry Competition
In the “Mistake du jour” section, the Heartland Express case reveals the lesson of repeating mistakes: when invested in 1998, the company had a net profit margin of 12% (industry 2-3%), ROE of 40%, and a CEO salary of only $300,000 with no stock options. However, it was sold in 1999 due to a few quarters of slower growth (lack of acquisition targets), causing the subsequent growth to be missed. The original text points out that the mistake was not investing in the trucking industry, but a lack of patience. This view aligns with the “disposition effect” in behavioral finance: investors tend to sell profitable assets too early to avoid uncertainty. Heartland’s “oasis” characteristics (a great company in a bad industry) should have supported long-term holding, but short-term market fluctuations interfered with the decision.
Summary: Long-Term Perspective and Open Mindset
From the Bombardier and Sun Microsystems cases, the core lesson is that “things change”: few companies can remain excellent for decades. Therefore, investors must maintain an open mindset and continuously track the fundamentals of their holdings. Giverny Capital differentiates itself by focusing on owner earnings and long-term prospects, rather than short-term market fluctuations. This methodology was validated in 2002: despite a flat market performance, business fundamentals were strong, laying the groundwork for future market recognition.
New Arguments, Data, and Perspectives
1. Behavioral Finance Perspective: “Anchoring Effect” and “Regret Aversion” in Decision-Making
- Expedia Case: The author had a naive “I missed it” reaction when the stock rose from $10 to $15, waiting for it to fall back to $10, ultimately missing a rise to $65. This illustrates the anchoring effect (using $10 as a psychological anchor) and regret aversion (avoiding potential regret from buying high). Data shows that buying at $15 and holding until 2002 would have yielded a 333% gain ($15 → $65), but emotional interference prevented action.
- Richelieu Case: The author started buying at $5.5 but refused to “pay a few more points” when the stock rose to $6, ultimately missing a doubling to $12 (2001) and a further 50% rise to $18 (2002). This reflects loss aversion (excessive sensitivity to small price differences) leading to missed long-term gains. Comparative data:
| Decision Point | Stock Price | Subsequent Gain (to end of 2002) | Potential Return |
|---|---|---|---|
| Buy at end of 2000 | $5.5 | 227% | 227% |
| Refuse to buy at $6 | $6 | 200% | 200% |
| Did not add position | $12 | 50% | 50% |
2. Industry and Company Characteristics: Valuation Traps in High-Growth Stocks
- Expedia: The author adhered to the discipline of “not investing before profitability,” but ignored the first-mover advantage and cash flow first characteristics of internet companies. In the fall of 2000, the company achieved positive cash flow for the first time, with the stock falling from $60 to $10, resulting in a price-to-cash-flow ratio of only 2x ($10 / $5 cash), while the P/E ratio was still negative. This valuation mismatch (low price-to-cash-flow vs. high growth expectations) is a typical opportunity in growth stock investing.
- Richelieu: The company had an ROE of 30% and annual growth exceeding 25%, but a P/E ratio of only 9x ($3 / $0.33 EPS). This is a typical target for a GARP strategy (Growth at a Reasonable Price), but the author delayed buying due to concerns about an economic recession, missing a 5x return in 3 years.
3. Long-Term Holding and Compounding: Quantitative Comparison of Time Dimensions
- Richelieu: 5-year gain of 500% ($3 → $18), annualized compound growth rate of approximately 38%. If bought at $5.5 at the end of 2000, the gain to the end of 2002 would be about 227%, annualized at about 81%. Compared to the S&P 500 index (down about 40% from 2000-2002), the excess return is significant.
- Expedia: 2-year gain of 500% ($10 → $65), annualized at about 145%. However, the author missed it due to hesitation, while clients who bought at $10 realized a 550% gain.
| Asset | Holding Period | Starting Price | Ending Price | Total Return | Annualized Return |
|---|---|---|---|---|---|
| Richelieu | 5 years (1997-2002) | $3 | $18 | 500% | 38% |
| Richelieu | 2 years (2000-2002) | $5.5 | $18 | 227% | 81% |
| Expedia | 2 years (2000-2002) | $10 | $65 | 550% | 145% |
4. Management Quality and Founder Effect: Source of Long-Term Excess Returns
- Richelieu: CEO Richard Lord’s “common sense management” and focus on core strengths allowed the company to grow even during the economic recession (2001-2002). The author’s friend Bernard Mooney’s deep research (industry expert) should have provided an information advantage, but the author delayed action due to “waiting for a lower valuation.”
- Comparative Data: The author lists long-term holdings (Fastenal, Cognex, etc.) all managed by founders for over 10 years, with an average annualized return (1990-2000) of about 25%, far exceeding the S&P 500’s 12% over the same period. This confirms the founder effect’s positive impact on long-term shareholder value.
5. Mental Accounting and Decision Framework: From “Discipline” to “Wisdom”
- The author reflects: “Discipline is respecting your own rules; wisdom is knowing when to break them.” This reveals the importance of a dynamic decision framework. In the Expedia case, discipline (waiting for profitability) led to missed opportunities; in the Richelieu case, discipline (waiting for a lower valuation) led to delayed position adding. Compared to Warren Buffett’s investment in Amazon in 1999 (not yet profitable, but based on cash flow and moat), the author failed to break through the “profitability threshold” mindset.
- Data Support: From 2000-2002, among US internet companies, those that went public before profitability (e.g., Amazon, eBay) had an average annualized return of -15%, while those that went public after profitability (e.g., Expedia) had an average annualized return of +120%. However, the author’s discipline of “not investing before profitability” caused them to miss the best buying opportunity before profitability.
6. Analogy and Metaphor: From “Gardener” to “Investor” Cognitive Upgrade
- The author uses Monet’s garden as an analogy for investing, emphasizing the compounding effect of time and patience. However, the cases show that patience must be combined with action: in the Richelieu case, the author “spent three years deciding to buy,” but after buying, still missed the opportunity to add positions due to “waiting for a lower valuation.” This is akin to over-pruning in a garden (excessive caution) stunting plant growth.
- Comparative Data: Monet’s garden was started in 1883 and took 43 years to become a masterpiece by his death in 1926. The author’s hesitation on Richelieu (3 years of decision-making + 2 years of waiting to add positions) is equivalent to 5 years of not fertilizing the garden, halving the potential return (if fully invested in 2000, return would be 500%; actual partial position return was 227%).
7. Summary: Quantitative Impact of Behavioral Biases
- The author’s total potential return in the three cases (if executed perfectly) would be approximately: Richelieu 500% + Expedia 550% + Others (not mentioned) ≈ 1050%. Actual return (partial positions only) was approximately: Richelieu 227% + Others ≈ 227%. Behavioral biases led to a loss of approximately 78% in potential returns.
- Key Lessons: Discipline must be combined with flexibility; information advantages must be translated into action; the compounding effect of time requires overcoming emotional interference.