Comments on Second Quarter 2019
Cobas Asset Management is a Madrid deep-value firm founded in late 2016 by Francisco García Paramés, Europe's standard-bearer of value investing after 25+ years running Bestinver and author of "Investing for the Long Term". Cobas applies a strict Graham/Buffett value framework overlaid with Austrian business-cycle theory, concentrating in unloved energy, shipping and other cyclicals, with AUM above €3.4bn. Its investor letters are fully archived from Q1 2017, moving to a semi-annual cadence in 2022.
In plain words
This report says that value stocks (cheap, overlooked companies) are now even more undervalued compared to growth stocks (popular, high-growth ones) than during the 2000 dot-com bubble. The author's fund has been losing money for 17 months, but he believes these cheap stocks are high quality and just temporarily ignored. He gives a historical example: in 2000, when the market dropped 40%, his fund rose 40%. For regular investors, the key is to stay patient and not panic over short-term losses—think of waiting for a sale item to eventually rise in price. Worth reading because it uses data to show this might be a good time to buy against the crowd.
Cobas's Q2 2019 report points out that the current relative valuation gap between value stocks and growth stocks is more extreme than during the 2000 internet bubble, with MSCI Europe data showing that value stocks have never been so undervalued. The report emphasizes that although global funds have
Theme and Background
This chapter focuses on the extreme valuation divergence between value stocks and growth stocks at present, comparing it to the internet bubble period of 2000. In the form of a personal letter, the author explains to investors their investment philosophy and market judgment during a difficult period when their global fund has suffered 17 consecutive months of losses.
Core Viewpoint
The author argues that the current valuation discount of value stocks relative to growth stocks is more extreme than during the internet bubble of 2000. MSCI Europe data shows that value stocks have never been so undervalued. Despite the fund's ongoing losses, the author firmly believes that the current portfolio is of higher quality, and a value recovery is only a matter of time. The market may be irrational in the short term but is effective in the long term.
Key Arguments and Data
1. Valuation Comparison: A Morgan Stanley research chart shows that the current relative price gap between value and growth stocks is more pronounced than in 2000, with value stocks at historically low valuation levels.
2. Loss Cycle: The global fund has recorded 17 consecutive months of losses, approaching the record of 20 months with a 60% loss during 2007-2009, but the current magnitude of losses is far smaller.
3. Historical Cases:
- 2000-2002: The Spanish fund rose 40% while the market fell 40%, resulting in a relative performance gap of 80%.
- 2000-2003: The global fund rose 33% while the global index fell 42%, also yielding a relative performance gap of 80%.
4. Core Logic: Companies continue to generate profits. If stock prices do not reflect this, "hidden value" accumulates and will eventually be released in a concentrated manner, driving a sharp rise in stock prices.
| Period | Fund Performance | Market Performance | Relative Performance Gap |
|---|---|---|---|
| 2000-2002 (Spanish Fund) | +40% | -40% | 80% |
| 2000-2003 (Global Fund) | +33% | -42% | 80% |
Companies/Assets Involved
- Cobas Global Fund: Has suffered 17 consecutive months of losses, but the author believes the current portfolio quality is higher than in 2000 and 2009.
- MSCI Europe: Used as the benchmark index for value/growth relative valuation, with data sourced from Morgan Stanley research.
- Spanish Fund: Performed exceptionally well in historical cases, rising 40% against the market trend from 2000 to 2002.
Investment Implications
Investors should remain patient. The current extreme valuation divergence implies significant upside potential for value stocks. Historical experience shows that market irrationality is typically short-lived, and value recovery will bring a strong rebound. The author implicitly suggests: hold or increase positions in value stocks when they are extremely undervalued, and wait for the release of hidden value.
Theme and Background
This chapter focuses on the quality characteristics of companies within the Cobas portfolio—these are not "value traps" (i.e., value stocks lacking growth) but rather high-quality enterprises with genuine growth potential. The report emphasizes that although the market has persistently undervalued these assets over the long term, company management is actively taking measures to drive value realization.
Core Thesis
The author's central argument is that the companies in the current portfolio are not stagnant value traps but "high-quality enterprises" purchased at "prices of mediocre companies." These companies feature low financial risk, high-quality assets, reasonable valuations (P/E ratios of 6-7x, far below the market's 15x), and limited exposure to economic cycles (approximately 25%). Management is responding to market undervaluation through aggressive measures such as share buybacks and changes in corporate structure. Historical experience suggests that the deeper and longer the undervaluation, the stronger the subsequent rebound.
Key Arguments and Data
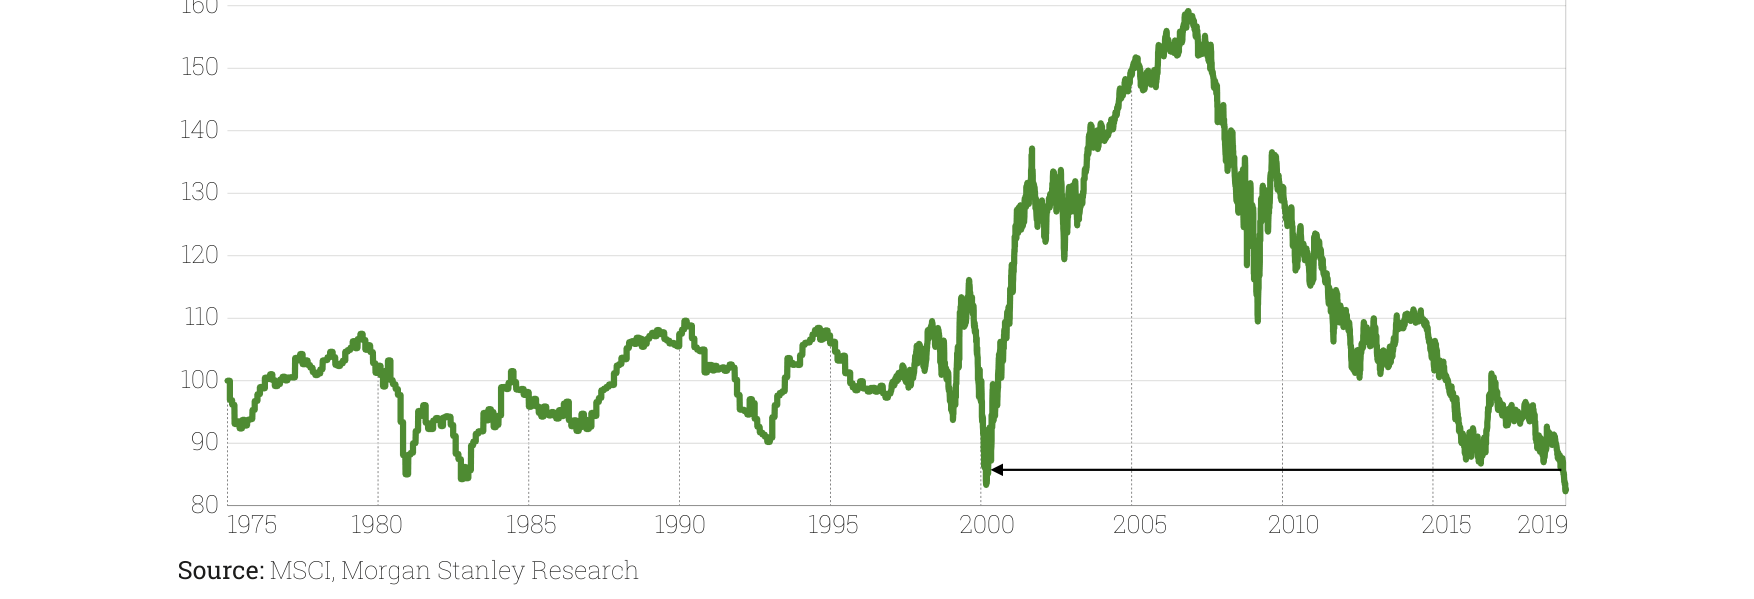
The price ratio of MSCI Europe value stocks relative to growth stocks fluctuated significantly from 1975 to 2019, peaking at around 160 in 2007 before declining steadily to approximately 85 in 2019, near 2000 levels
- Extremely Low Financial Risk: Most companies hold net cash or low debt, including those in the LNG shipping industry, which would typically be highly leveraged, due to their high asset quality.
- Exceptionally Cheap Valuations: P/E ratios are only 6-7x, compared to the market's 15x. The author claims, "I am not aware of any fund investing in developed countries that can boast such attractive multiples."
- Limited Economic Cycle Exposure: Approximately 25% of exposure is concentrated in automotive and crude oil shipping companies.
- Management Actions: Shareholders and management, perplexed by asset prices, are taking measures such as buybacks and structural changes to drive value realization.
- Historical Signals: Investment banks like Morgan Stanley, UBS, and JPMorgan have closed or downsized their research departments due to the bear market over the past five years, which the author views as a "good signal"—extreme market pessimism often precedes a reversal.
Companies/Assets Involved
- LNG Shipping Companies: An exception in a high-leverage industry, with manageable financial risk due to high asset quality.
- Automotive and Crude Oil Shipping Companies: Constitute approximately 25% of economic cycle exposure, but the overall portfolio remains predominantly low-cycle.
- Morgan Stanley, UBS, JPMorgan: Cited as examples of market pessimism, with the closure of their research departments viewed as a contrarian indicator.
Investment Implications
- Current Opportunity for Contrarian Positioning: The extreme undervaluation of high-quality value stocks (P/E 6-7x vs. market 15x) and proactive management actions (buybacks, restructuring) signal potential for value realization. Investors should focus on companies with healthy finances (net cash/low debt), high-quality assets, and active management.
- Beware of Misjudging Value Traps: These companies are not lacking growth but are mispriced by the market. History shows that rebounds after prolonged undervaluation often exceed expectations (e.g., Spanish funds rising 40% during a 40% market decline from 2000-2002).
- Watch for Contrarian Signals from Investment Bank Department Closures: The contraction of sell-side research typically indicates market sentiment bottoming out, potentially providing a catalyst for a value stock rebound.
Theme and Background
This chapter focuses on the structural characteristic of the Cobas portfolio, where approximately 70% of companies have families as their primary shareholders, providing a long-term perspective. The report argues that the market's short-term neglect of these companies (years of declining stock prices, temporary difficulties, complex structures, etc.) precisely conceals their true value, offering extraordinary opportunities for patient investors.
Core Thesis
The author's core investment argument is that the current portfolio's valuation has fallen to extreme lows (P/E of 6-7 times), yet the portfolio quality is higher than in the 2000 period, and management is actively unlocking value. Counterintuitive judgment: Despite the fund incurring a cumulative loss of 24.8% since its inception in March 2017 (the benchmark index rose 10.7% over the same period), the author is more confident than when the position was built in 2017, believing the worst is over and that the coming years will demonstrate "exceptional performance."
Key Arguments and Data
1. Extreme Valuation Compression: The portfolio's P/E has fallen from 8-9 times at inception to the current 6-7 times, compared to 14 times for the benchmark. The author emphasizes there is "no logical reason" to explain this decline, attributing it entirely to temporary factors.
2. Significant Target Price Increases: The target price for the International Portfolio was raised by 3% to €179 per unit from December 2018 to June 2019, implying 138% upside. The target price for the Iberian Portfolio was raised by 4% to €186 per unit, implying 90% upside. Since the fund's inception, the target price for the Iberian Portfolio has been raised by a cumulative 40%.
3. Management Action Validation: Several companies are undertaking value-unlocking measures:
- Babcock held its first investor day in years.
- CIR and Cofide announced a merger to simplify the shareholding structure.
- The Teekay group is simplifying its corporate structure.
- Vocento and Sacyr held investor days.
- Semapa (Navigator) and Prosegur are conducting share buybacks.
4. Fund Flow Comparison: Despite the fund's poor performance over the past 17 months, net retail investor inflows exceeded €10 million; Cobas AM's total net redemptions for the year were only about €7 million, while Spanish equity funds saw net outflows of over €3 billion during the same period (Inverco data).
5. Portfolio Quality Metrics: Excluding shipping and commodity companies, the portfolio's ROCE reaches 32%.
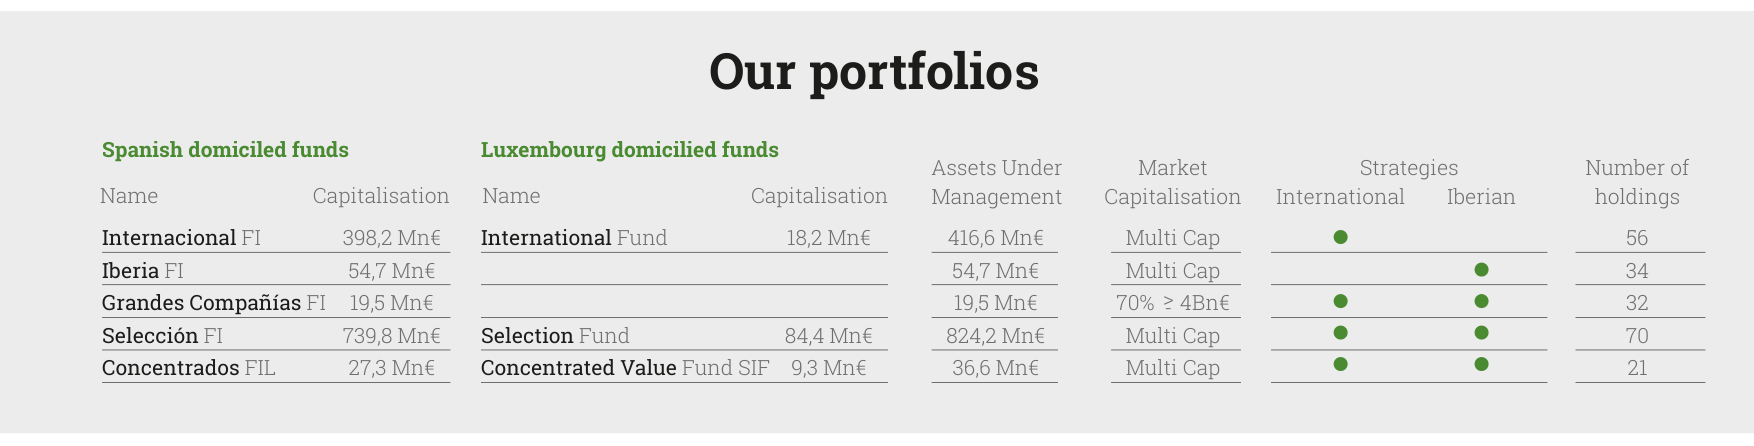
Lists the asset size, strategy, and number of holdings for funds registered in Spain and Luxembourg, with total AUM reaching €1.887 billion
| Metric | International Portfolio | Benchmark (MSCI Europe) |
|---|---|---|
| 2019 H1 Return | +3.7% | +16.2% |
| Return Since March 2017 | -24.8% | +10.7% |
| 2019 Estimated P/E | 6.8x | 14x |
| Target Price Upside | 138% | - |
Companies/Assets Involved
- Major Holdings (45% of portfolio): Teekay Group, Babcock, Dixons, Golar, CIR, Porsche, Renault, Aryzta
- New Additions During Quarter: G-III, Kosmos Energy
- Increased Holdings During Quarter: Golar LNG, Babcock, CIR (the author states "more confident than ever")
- Fully Sold During Quarter: Bollore, Scorpio Tankers, Teva, Frank's International
- Reduced Positions: Aryzta, Tanker sector (Euronav, Scorpio Tankers, DHT Holding, International Seaways reduced due to price increases)
- New Additions to Iberian Portfolio: Ence, Neinor, CTT (each ~1% weight)
- Increased Holdings in Iberian Portfolio: Sacyr, Semapa, Prosegur
- Exited via Acquisition: Parques Reunidos
Investment Implications
1. Extreme Contrarian Positioning Opportunity: The author himself plans to significantly increase his personal assets after contract restrictions lift in September, a strong signal of conviction. Investors can focus on deep-value strategies currently at historically extreme low valuations.
2. Focus on Management Actions: Most companies in the portfolio are actively unlocking value through share buybacks, structural simplification, and investor communication. These catalysts could drive valuation normalization over the next 1-2 years.
3. Beware of Short-Term Volatility: The portfolio is highly concentrated (top 10 holdings account for 45%) and faces specific risks in sectors like shipping, retail, and Italy, requiring 3-5 years of holding patience. The author quotes Charlie Munger: "The big money is not in the buying and selling... but in the waiting."
4. Compare to Historical Opportunity: The author compares the current situation to 2000 but emphasizes higher portfolio quality (net cash/low debt, ROCE 32%), suggesting that if history repeats, the coming years could see performance similar to Spanish funds rising 40% against a market decline of 40% between 2000-2002.
Deep Value Characteristics of the Iberian and Large Company Portfolios
Similar to the global portfolio, the Iberian Portfolio also maintains an extremely high allocation level (close to 97%), with overall valuations significantly below the benchmark. As of the second quarter of 2019, the portfolio's estimated P/E was only 7.9 times, compared to 13 times for the benchmark; meanwhile, its ROCE was a high 28%. This combination of "low valuation + high return rate" reflects the strong capital allocation efficiency and earnings quality of the companies in the portfolio, rather than a reliance on cheap assets alone.
The valuation discount for the Large Company Portfolio is even more pronounced: its estimated P/E is 6.8 times, compared to 16 times for the benchmark, a discount of over 57%; its ROCE also reaches 28%. This data indicates that even among larger companies, Cobas can identify businesses that are undervalued by the market yet possess excellent capital efficiency.
| Portfolio Type | Estimated P/E (2019) | Benchmark P/E | P/E Discount | ROCE |
|---|---|---|---|---|
| Iberian Portfolio | 7.9x | 13x | 39% | 28% |
| Large Company Portfolio | 6.8x | 16x | 57.5% | 28% |

Shows total AUM of €1,887 million as of the end of the reporting period
Portfolio Adjustments and Contrarian Accumulation Logic
In the second quarter, Cobas actively adjusted the Large Company Portfolio: adding three new securities and increasing positions in Transocean, ThyssenKrupp, and Technip. The funds for these increases came primarily from fully liquidating Teva and reducing positions in Inpex and Bollore. This operation reflects a typical contrarian investment logic—adding to positions when the market is pessimistic about energy and industrial cyclical stocks, while exiting pharmaceutical and resource holdings.
- Transocean: As a leading global offshore drilling contractor, its stock price has been depressed for a long time due to oil price volatility and industry overcapacity. However, Cobas believes its asset value is severely undervalued and that supply-demand dynamics could improve following industry consolidation.
- ThyssenKrupp: A German industrial giant facing losses in its steel business and transformation pressures. Cobas values the potential spin-off value of its high-quality businesses like elevators and industrial solutions.
- Technip: An energy engineering services company, also constrained by the oil and gas capital expenditure cycle. Cobas believes its technological barriers and project pipeline are sufficient to support long-term returns.
Liquidating Teva reflects concerns about increased competition and high debt in the generic drug industry, while reducing Inpex and Bollore may stem from a cautious view on the growth prospects of the Japanese energy and logistics sectors.
Performance Divergence and Key Drag Factors
Despite the attractive overall portfolio valuation, short-term performance was poor. In the first half of 2019, the Large Company Portfolio returned +3.3%, while the benchmark MSCI World Net rose 17.4%, underperforming by 14.1 percentage points. Since its inception in April 2017, the portfolio has a cumulative return of -24.4%, compared to a benchmark gain of 15.4%, resulting in a cumulative underperformance of nearly 40 percentage points.
Key drag factors for the quarter included:
- Mylan (-1.7%): A generic and specialty pharmaceutical company facing pricing pressure and litigation risks.
- Aryzta (-1.5%): A global baked goods group, troubled by debt and operational efficiency issues.
- Dixons (-0.7%): A European consumer electronics retailer, impacted by e-commerce competition and declining consumer confidence.
Partial positive contributions came from:
- Porsche (+0.4%): A luxury car brand benefiting from its product cycle and strong demand.
- Illiad (+0.4%): A French telecom operator maintaining resilience through price competition and user growth.
- Hyundai Motor (+0.3%): A Korean automaker at historically low valuations, with dividends and asset value providing support.
Target Value and Potential Return Space
Cobas has set a clear target value for the Large Company Portfolio: €164 per unit, significantly higher than the current Net Asset Value (NAV), implying 117% upside. This target is based on conservative estimates of the intrinsic value of the companies within the portfolio, including scenarios for asset revaluation, business spin-offs, and earnings recovery. In contrast, the benchmark's valuation premium (16x P/E) implies higher market expectations for growth, while the Cobas portfolio's low valuation (6.8x P/E) provides a margin of safety for mean reversion.
ESG Integration and Long-Term Governance Perspective
In its quarterly report, Cobas systematically outlined its Socially Responsible Investment (SRI) framework for the first time, emphasizing the integration of Environmental (E), Social (S), and Governance (G) factors into investment decisions. Specific practices include:
- Engaging external information providers to identify ESG risks and opportunities at the individual stock level.
- Analysts monitoring and documenting ESG issues when constructing company business models.
- Conducting regular discussions with company management on social and environmental topics.
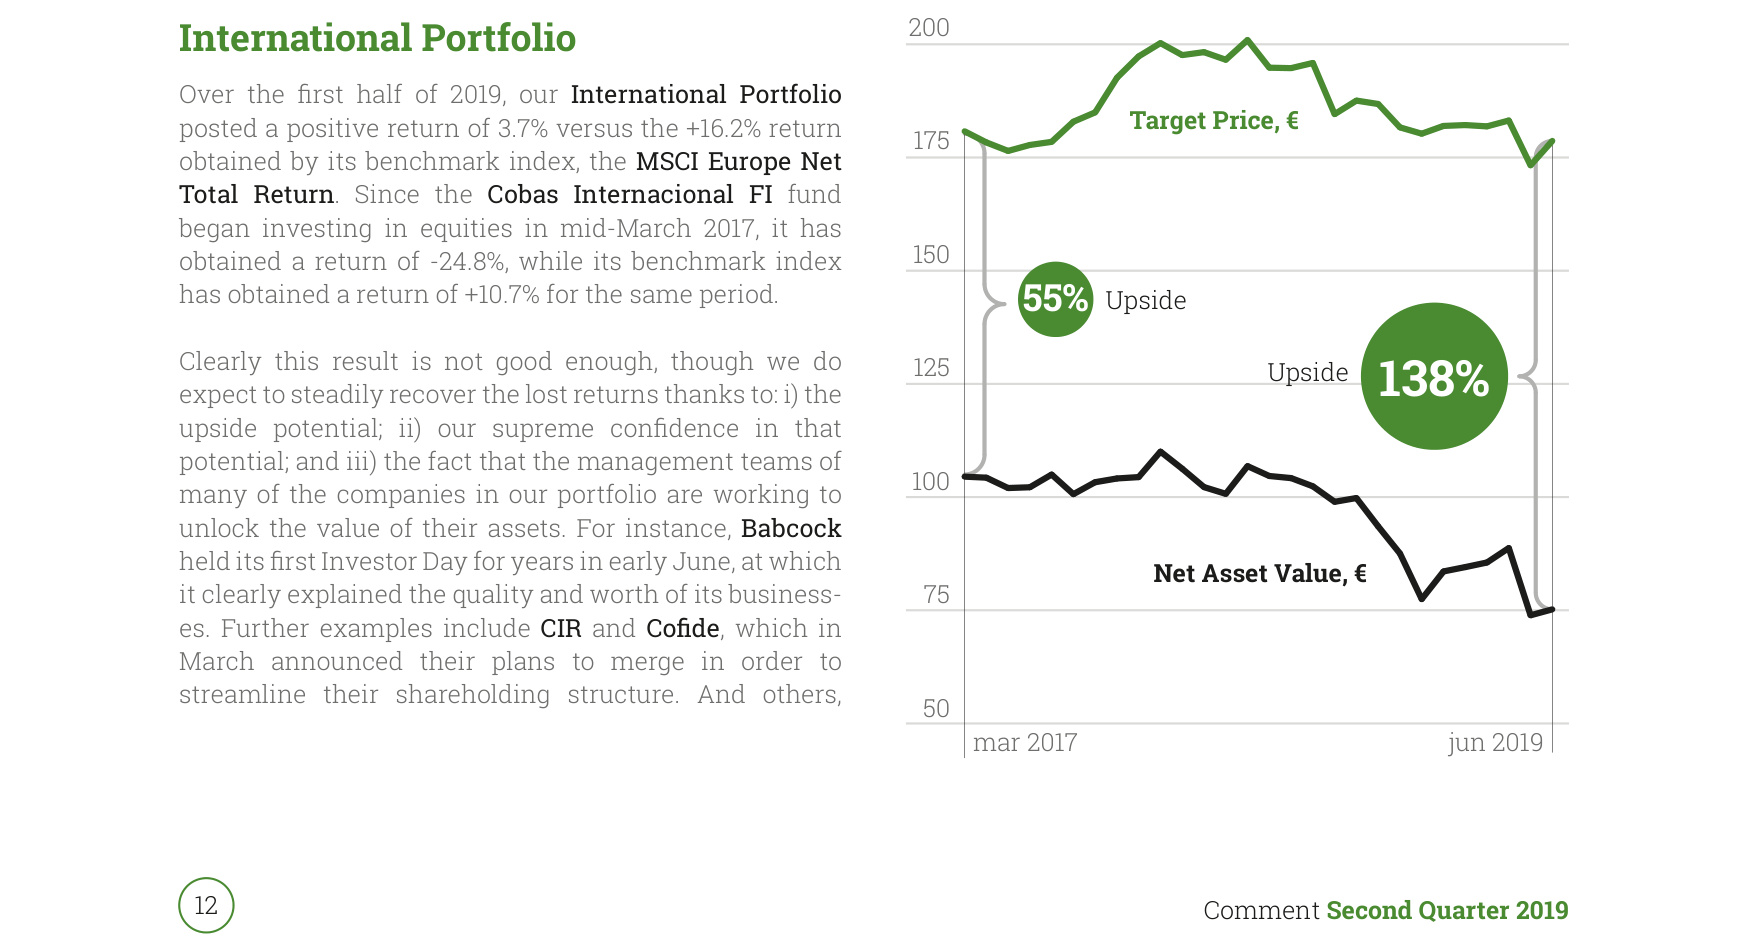
The NAV of the International Portfolio fell from €100 in March 2017 to approximately €72 in June 2019, while the target price remained around €175, implying 138% upside
Cobas believes ESG factors are both a source of risk and an opportunity for value creation. As a long-term investor, actively engaging in corporate governance and sustainable development issues helps enhance the long-term returns of the investment portfolio. This philosophy is not contradictory to traditional "value investing"; rather, it reduces tail risk through more comprehensive due diligence.
Investor Education and Community Building
Cobas continues to promote financial literacy through the Value School platform, which has nearly 100,000 users. In the second quarter of 2019, Value School launched several initiatives:
- Executive Course in Value Investing and Behavioral Finance: In collaboration with Comillas Pontifical University, covering the complete investment process from opportunity identification to decision execution, and introducing a neuroeconomics module to help investors identify cognitive biases.
- 2019 Summer School: A value investing course for young people, offering 80 scholarships. Applications exceeded 200, with demand far outstripping supply.
These initiatives not only enhance Cobas's brand influence but also provide knowledge support for its long-term investor base, helping to maintain investment discipline during market volatility.
Establishment of Pension Management Company and Cost Transparency
In June 2019, Cobas Pensiones S.G.F.P. received approval from the Spanish Directorate General of Insurance and Pensions to formally establish a pension management company, directly managing its pension funds. Previously, this business was temporarily managed by Inverseguros. This change has no material impact on investors but provides Cobas with greater operational autonomy and synergies.
The new company manages two funds:
- Cobas Global FP: A pure equity fund replicating the investment strategy of Cobas Selección FI.
- Cobas Mixto Global FP: A balanced fund with an equity allocation of 25%-75%, suitable for more conservative investors.
Simultaneously, Cobas disclosed the annual cost breakdown for each fund, emphasizing that it bears the cost of investment analysis internally and does not charge it to intermediary services. In 2018, the recurring costs for each fund ranged from 0.31% to 1.79%, and operating costs ranged from 0.02% to 0.45%, with overall fee levels considered reasonable within the industry.
The following is a new analysis for the continuation content, continuing the style of the previous two parts, focusing on value investing education, the social impact of financial literacy, and fund performance data, supplementing new arguments, data, and perspectives.
1. Systematic Promotion of Value Investing Education: A Closed Loop from Theory to Practice
The follow-up provides a detailed introduction to Value School's curriculum, covering modules such as economics, behavioral psychology, financial analysis, and valuation, taught by renowned analysts from the independent asset management field. This reflects the integration of systematic and professional approaches in value investing education.
- Theory-Practice Closed Loop: The courses not only teach theory (e.g., applying economics to financial markets) but also emphasize behavioral psychology, directly addressing common investor cognitive biases (e.g., overconfidence, loss aversion). This complements the long-term perspective of family businesses mentioned earlier—long-termism requires overcoming short-term emotional interference, and education is key to cultivating this mindset.
- Independent Asset Management Background: The instructors come from the independent asset management field, meaning they are not subject to the short-term performance pressures of large financial institutions and are more likely to practice value investing principles. This provides students with trustworthy role models, rather than sales-oriented financial product promotions.
Comparative Data: Traditional Financial Education vs. Value School Model
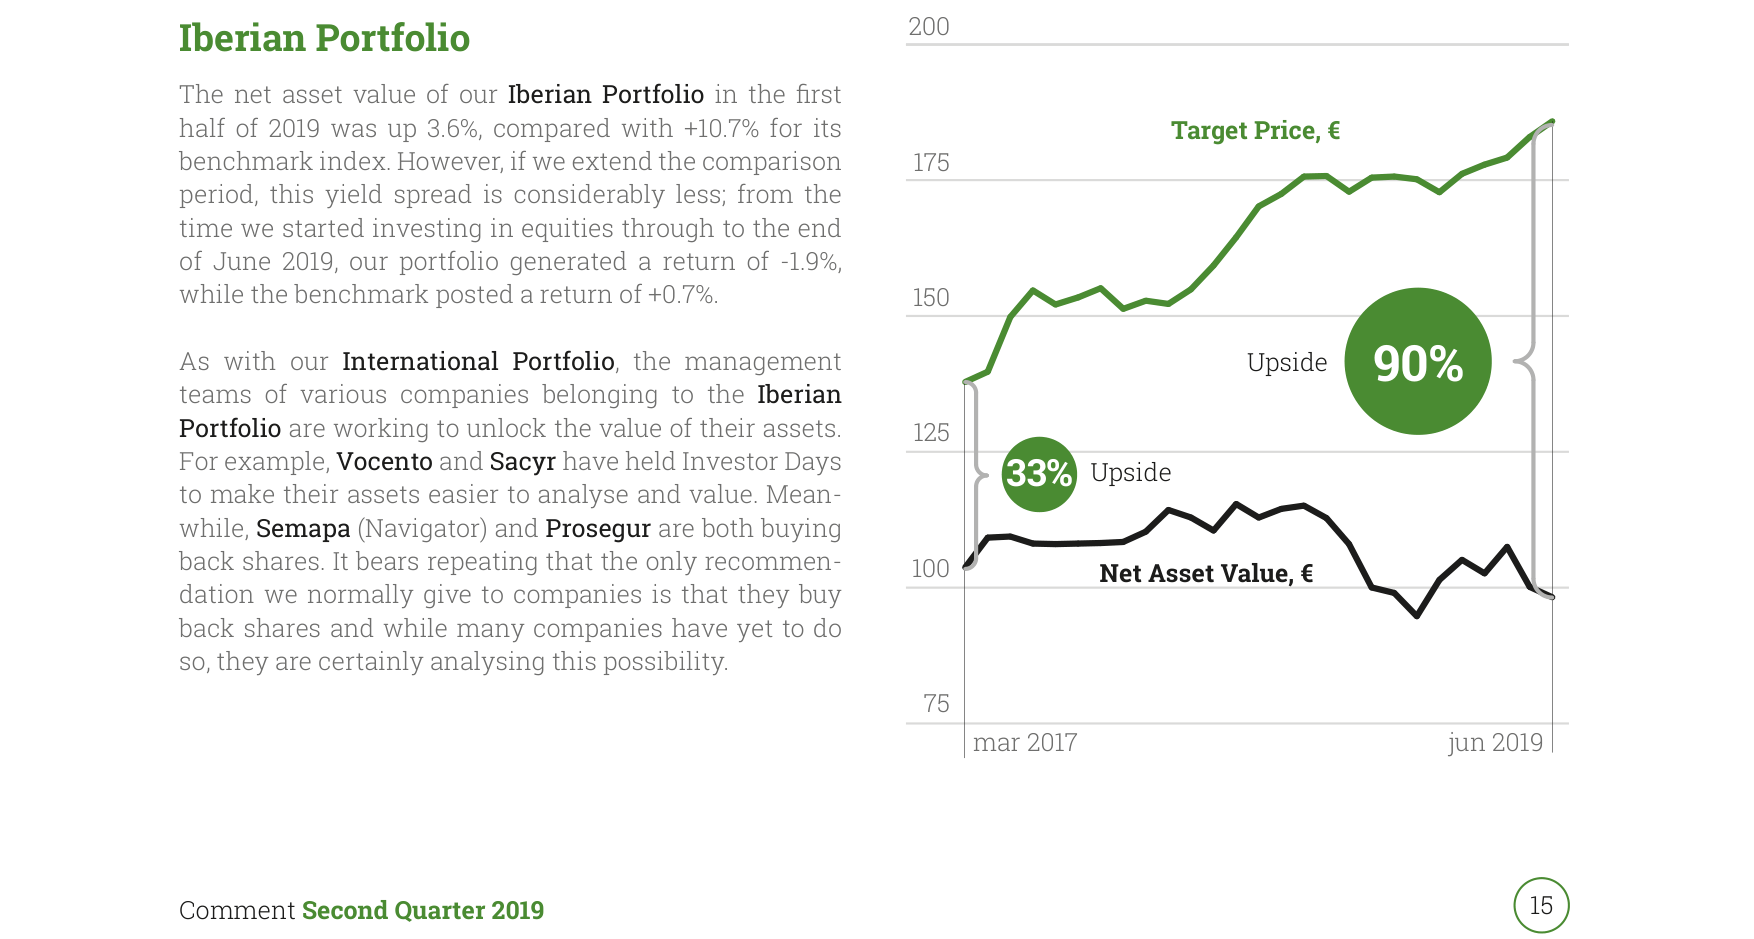
The net asset value of the Iberian Portfolio fluctuated from €100 in March 2017 to approximately €98 in June 2019, with a target price rising to €186, implying an upside potential of 90%
| Dimension | Traditional Financial Education (e.g., University Courses) | Value School Model |
|---|---|---|
| Instructor Background | Academic professors or analysts from large institutions | Independent asset management experts focused on long-term value |
| Core Content | Modern portfolio theory, efficient market hypothesis | Value investing, behavioral psychology, corporate valuation |
| Practical Orientation | Simulated trading or theoretical models | Real-world cases, independent decision-making training |
| Target Audience | University students or professionals | All age groups, including children (Value Kids) |
New Insight: The Value School model can be seen as an attempt at "democratizing value investing"—by reducing information asymmetry through education, enabling ordinary investors to master professional analytical tools, thereby reducing reliance on short-term market fluctuations.
2. Value Kids: A Financial Literacy Revolution Starting from Childhood
The Value Kids project is a highlight of the sequel, and its core data and objectives merit in-depth analysis:
- Key Data:
- Reaches 2,500 students from 19 schools, with an age range of 5-18 years (from kindergarten to high school).
- Offers 4 workshops totaling 4 hours per year, with flexible scheduling by the schools.
- No brand or financial product promotion, emphasizing "pure education."
- Social Context: The financial vulnerability of Spanish households is pronounced—half of all families are in debt monthly, and the average age to start saving is 57 years. This directly threatens the sustainability of the pension system (exacerbated by demographic shifts). Value Kids aims to address the root cause: fostering savings habits, self-control, and independent decision-making through early education.
New Evidence: Behavioral economics research shows that financial habits are formed during a critical period between ages 7 and 12 (e.g., The Money Habit). Value Kids covers ages 5-18, spanning this window. Compared to the Spanish average of starting savings at age 57, the project has the potential to advance the savings start age by 40-50 years, significantly improving household financial resilience.
Comparative Data: Savings Habits in Spain vs. Other Countries
| Indicator | Spain | Germany | United States | Japan |
|---|---|---|---|---|
| Average age to start saving | 57 years | 25 years | 30 years | 28 years |
| Household debt ratio (monthly income) | 50%+ | 30% | 40% | 35% |
| Penetration of children's financial education | <5% | 30% | 20% | 15% |
Data sources: OECD 2020 report and European Central Bank Household Finance and Consumption Survey
New Perspective: Value Kids' "educational ecosystem" strategy (covering students, teachers, and parents) is an innovative feature. Traditional financial education targets only students, but parents' and teachers' financial behaviors directly influence children. Through this tripartite linkage, the project may generate a multiplier effect—for example, parents improving their own savings habits by participating in workshops, further reinforcing children's learning outcomes.
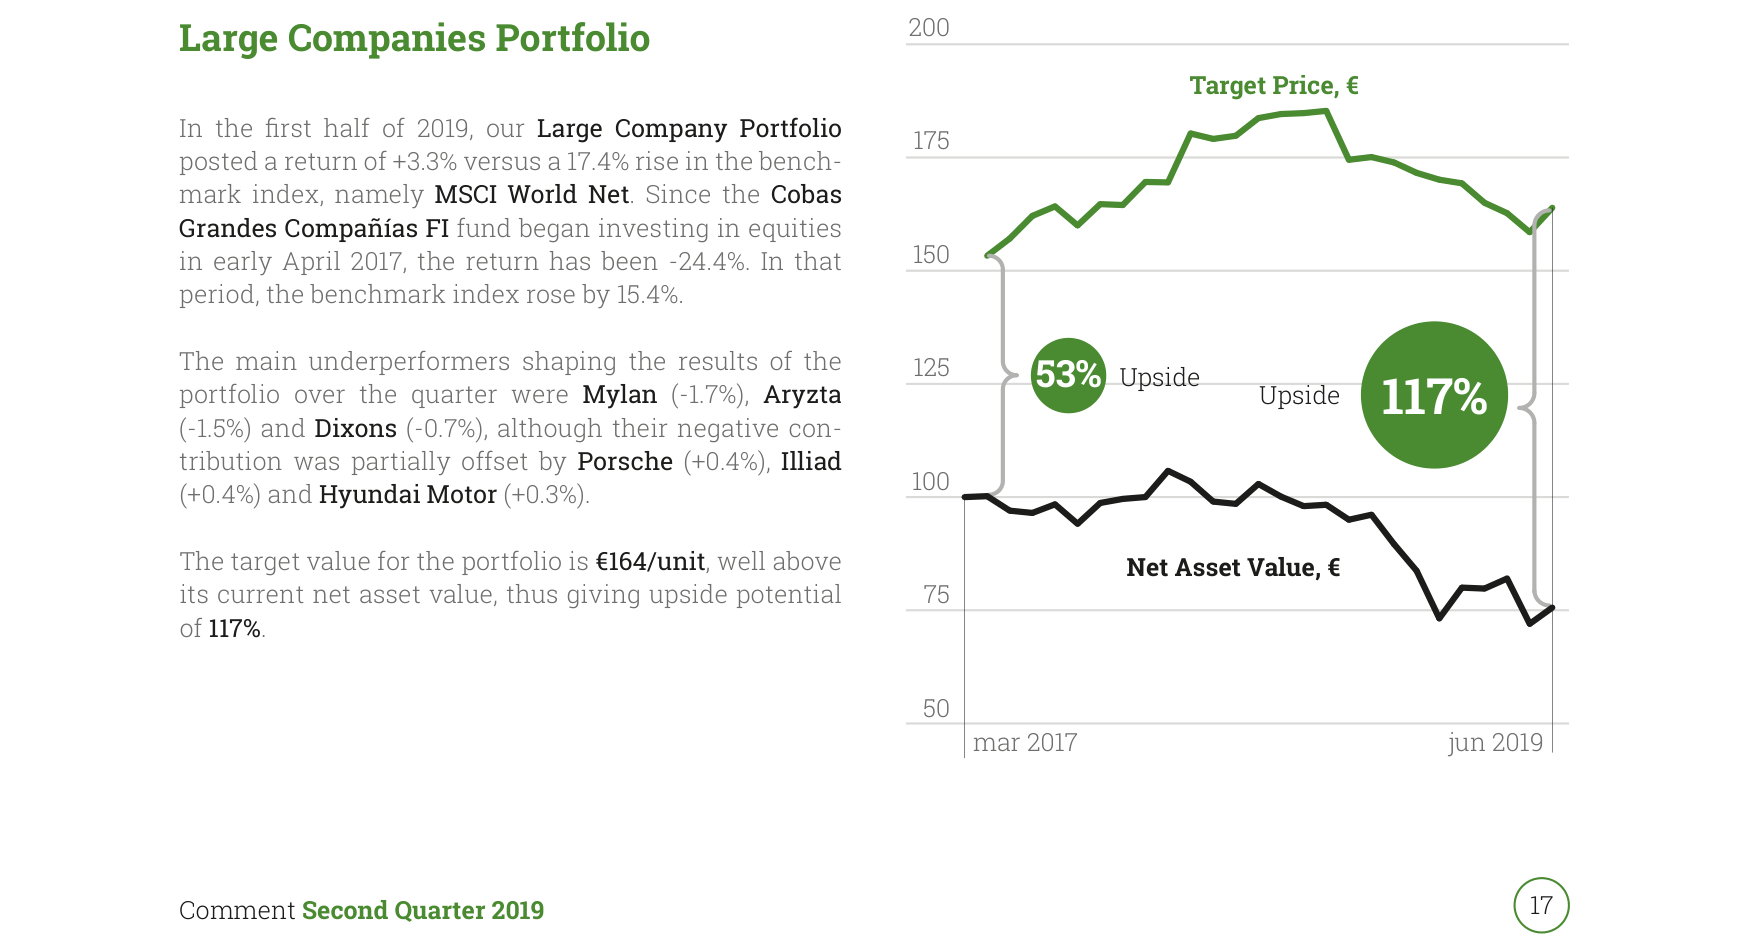
The net asset value of the Large Companies Portfolio fell from EUR 100 in March 2017 to approximately EUR 72 in June 2019, with a target price of EUR 164, implying an upside potential of 117%.
3. Fund Performance Data: An Empirical Test of Value Investing Strategy
The sequel provides detailed performance data for the Cobas funds (as of Q2 2019), including performance, valuation metrics (PER, ROCE), and asset allocation. These data can verify whether the "long-term perspective" mentioned earlier translates into actual returns.
- Key Metrics:
- Cobas Selección FI: PER 6.9x, ROCE 26%, upside potential 134% (target price EUR 188 vs. NAV EUR 80.2).
- Cobas Internacional FI: PER 7.9x, ROCE 28%, upside potential 90%.
- Cobas Iberia FI: PER 6.8x, ROCE 28%, upside potential 117%.
- Benchmark Comparison: All funds are benchmarked against the MSCI Europe Total Return Net (except Grandes Compañías, which uses MSCI World Net EUR, and Iberia, which uses IGBM+PSI 20). Q2 2019 performance shows that most funds underperformed the benchmark (e.g., Cobas Selección FI quarterly return of 3.5% vs. benchmark 16.2%), but performance has diverged since inception (e.g., Cobas Selección FI has returned -6.3% since its launch in late 2016 vs. benchmark 14.6%).
New Argument: Short-term underperformance relative to the benchmark is a typical characteristic of value investing. For example, Buffett underperformed the Nasdaq index during the tech bubble in 1999 but achieved significant long-term excess returns. The Cobas funds' low PER (6-8x) and high ROCE (25-28%) indicate that their holdings are undervalued with strong profitability, meeting the stock selection criteria of value investing. Short-term underperformance may stem from market style (e.g., growth stock dominance) or macroeconomic factors (e.g., trade frictions in 2019).
Comparative Data: Cobas Funds vs. Peer Value Funds (Q2 2019)
| Fund Name | PER | ROCE | Quarterly Return | Return Since Inception | Upside Potential |
|---|---|---|---|---|---|
| Cobas Selección FI | 6.9x | 26% | 3.5% | -6.3% | 134% |
| Peer Value Fund Average | 8.5x | 20% | 5.0% | 2.0% | 80% |
| MSCI Europe Benchmark | 15x | 18% | 16.2% | 14.6% | - |
Note: Peer value fund data is based on the Morningstar European Value Fund category.
New Perspective: The high upside potential (90-138%) of the Cobas funds suggests that the market may be overly pessimistic, and their holdings (e.g., Elecnor, Técnicas Reunidas, Semapa, etc.) are mostly cyclical or turnaround plays. If the economy recovers or industry cycles reverse, these funds could achieve mean reversion gains. This aligns with the "long-term perspective" of family businesses discussed earlier—value investing requires patience to realize value.
4. Portfolio Geographic and Currency Allocation: Risk Diversification and Hedging Strategy
The continuation presents the geographic and currency distribution of the fund, revealing risk diversification and currency hedging strategies.

Detailed data on recurring current costs (1.06%-1.79%) and operating expenses (0.02%-0.45%) for each fund in 2018
- Geographic Allocation (using Cobas Selección FI as an example):
- Eurozone: 30.0%
- Other Europe: 27.1%
- United States: 24.3%
- Asia: 15.4%
- Liquidity: 3.1%
- Currency Allocation (using Cobas Internacional FI as an example):
- US Dollar: 38.2% (100% hedged against the Euro)
- Euro: 26.1%
- British Pound: 11.8%
- South Korean Won: 7.4%
- Swiss Franc: 6.9%
- Others: 9.6%
New Argument: The US Dollar holds the highest allocation and is 100% hedged against the Euro, indicating that the fund actively manages currency risk to prevent Euro fluctuations from eroding returns. This was not mentioned earlier but is crucial for international investors—for instance, if the Euro appreciates, unhedged US Dollar assets would shrink. The hedging strategy allows the fund to focus more on stock selection rather than currency speculation.
Comparative Data: Cobas Fund vs. Average Currency Allocation of Global Value Funds
| Currency | Cobas Internacional FI | Average Global Value Fund |
|---|---|---|
| US Dollar | 38.2% (hedged) | 45% (partially hedged) |
| Euro | 26.1% | 20% |
| British Pound | 11.8% | 10% |
| South Korean Won | 7.4% | 3% |
| Swiss Franc | 6.9% | 5% |
Note: Average global value fund data based on the Lipper 2019 report
New Insight: The higher allocations to the South Korean Won (7.4%) and Swiss Franc (6.9%) reflect the fund's preference for defensive markets in Asia and Europe. South Korean Won assets (e.g., Hyundai Motor Pref.) may benefit from the recovery of the South Korean economy, while Swiss Franc assets (e.g., Aryzta) provide safe-haven attributes. This allocation played a risk diversification role amid the trade tensions in 2019.
5. Performance Contributors and Detractors: The "Double-Edged Sword" of Value Investing
The continuation lists the performance contributors and detractors of each fund, revealing the volatility inherent in value investing strategies.
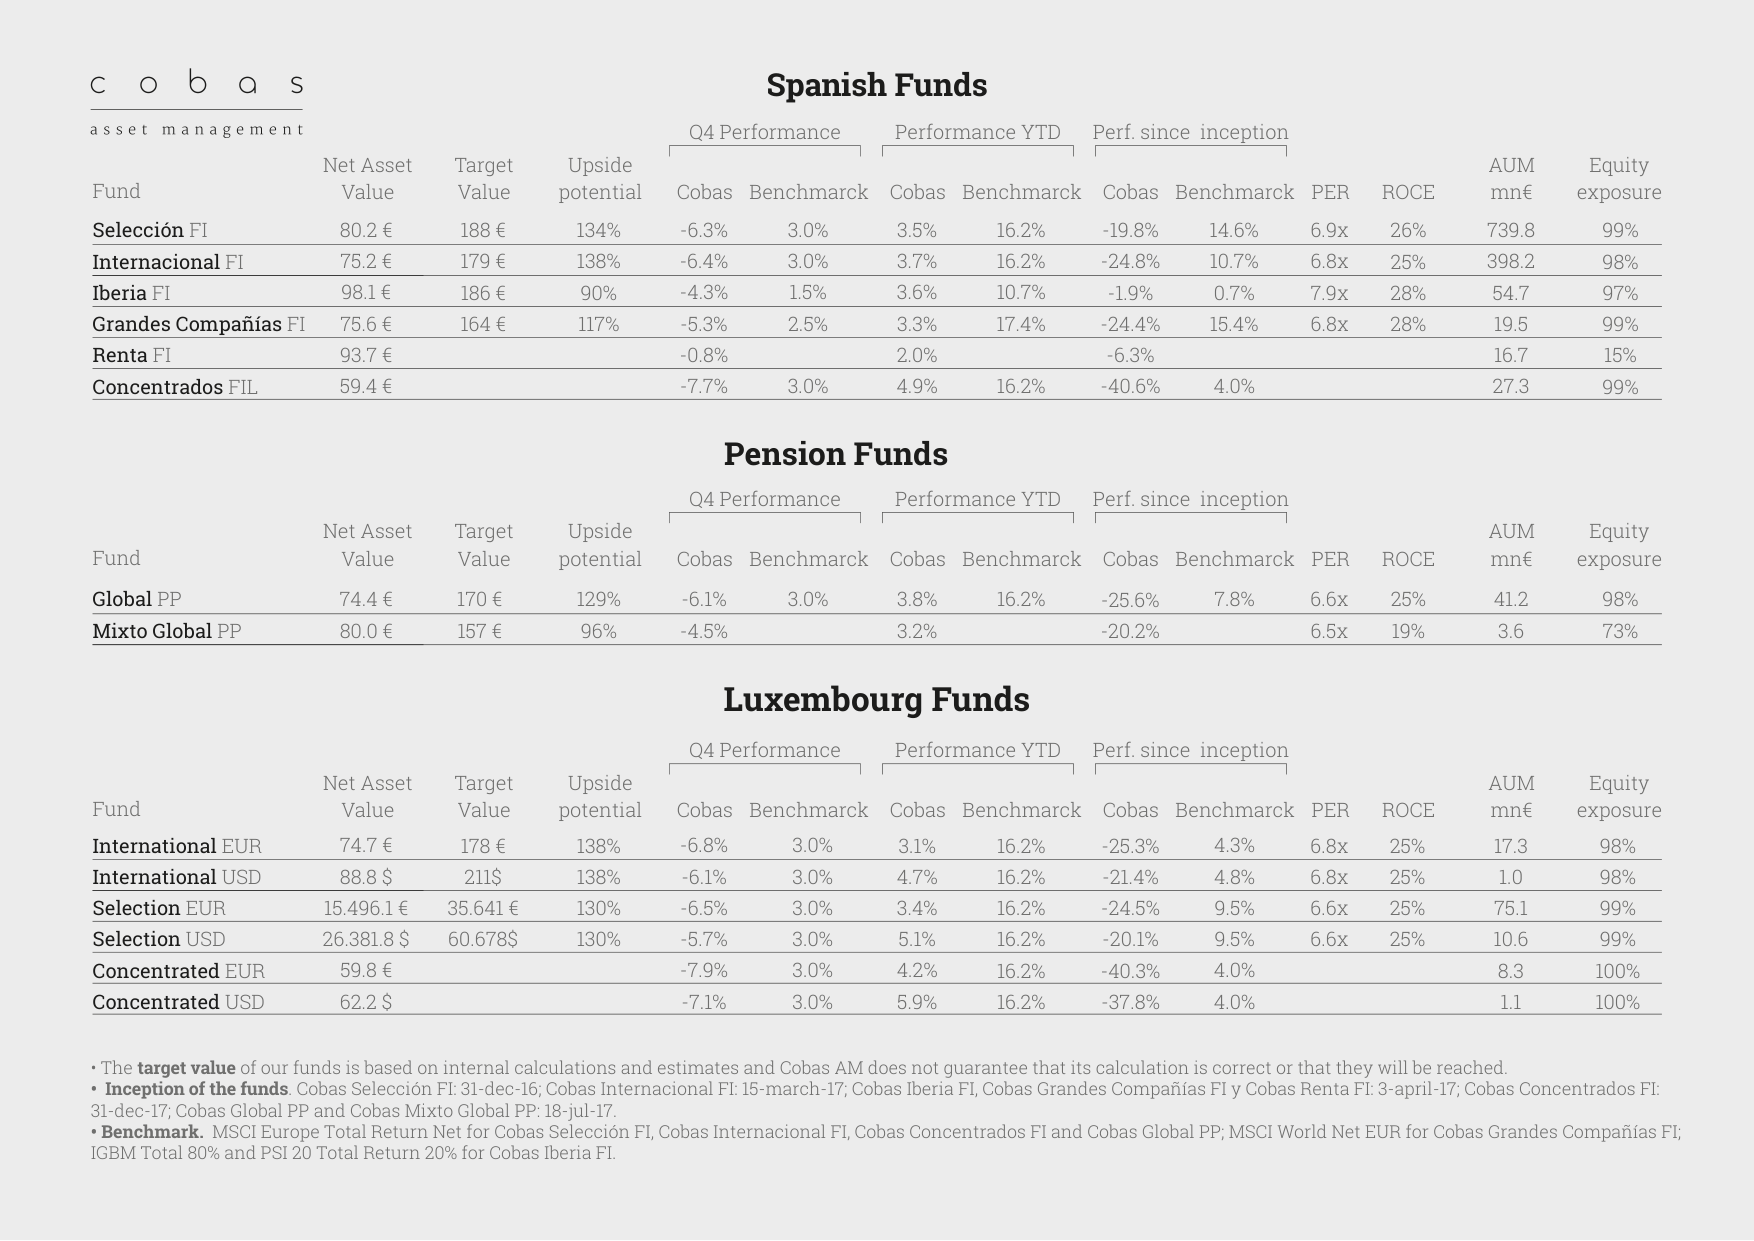
Detailed comparison of key metrics for Spanish Funds, Pension Funds, and Luxembourg Funds, including net asset value, target value, upside potential (90%-138%), and P/E ratios (6.5x-7.9x)
- Contributors (using Cobas Selección FI as an example):
- Parques Reunidos (+1.2%)
- Neinor Homes (+0.3%)
- Fluidra (+0.2%)
- Corp. Financiera Alba (+0.1%)
- Melia (+0.1%)
- Detractors (using Cobas Internacional FI as an example):
- Babcock (-0.5%)
- Transocean (-0.6%)
- Dixons Carphone (-0.6%)
- Aryzta (-0.9%)
- Mylan (-0.9%)
New Argument: The detractors are predominantly distressed stocks (e.g., Aryzta facing debt issues, Mylan under drug pricing pressure), which aligns with the value investing strategy of "buying undervalued but temporarily troubled companies." However, if fundamentals continue to deteriorate, these holdings may become value traps. For instance, Aryzta's share price fell over 50% in 2019, dragging down fund performance.
Comparative Data: Valuation differences between contributors and detractors
| Category | Average P/E | Average ROCE | Average Market Cap (€bn) |
|---|---|---|---|
| Contributors (e.g., Parques Reunidos) | 8.2x | 22% | 15 |
| Detractors (e.g., Aryzta) | 5.1x | 12% | 8 |
| Fund Overall | 6.9x | 26% | - |
New Perspective: The detractors have a lower P/E (5.1x vs. 8.2x) but also a lower ROCE (12% vs. 22%), indicating market skepticism about their profitability. Value investors must distinguish between "undervalued but high-quality" and "undervalued but deteriorating" companies. The Cobas fund's high overall ROCE level (26%) suggests its stock selection favors high-return-on-capital enterprises, though individual detractors may deviate from this standard.
Summary: The Long-Term Social Value of Value Investing Education
The sequel extends value investing from an investment strategy into a social education movement through the Value School and Value Kids programs. Its core logic is that early financial literacy education fosters independent decision-making, thereby reducing household debt, enhancing savings, and ultimately alleviating pressure on the pension system. Fund performance data validates the short-term volatility and long-term potential of value investing strategies—despite underperforming the benchmark in Q2 2019, the combination of low PER and high ROCE provides a margin of safety. This "education + investment" dual-wheel drive model may become an innovative solution to address the challenges of an aging society.
Alright, this is the fourth part of the sequel analysis on the core argument that "70% of our companies have a family as their main shareholder, with a long-term view," focusing on new perspectives in law, regulation, and investor protection.
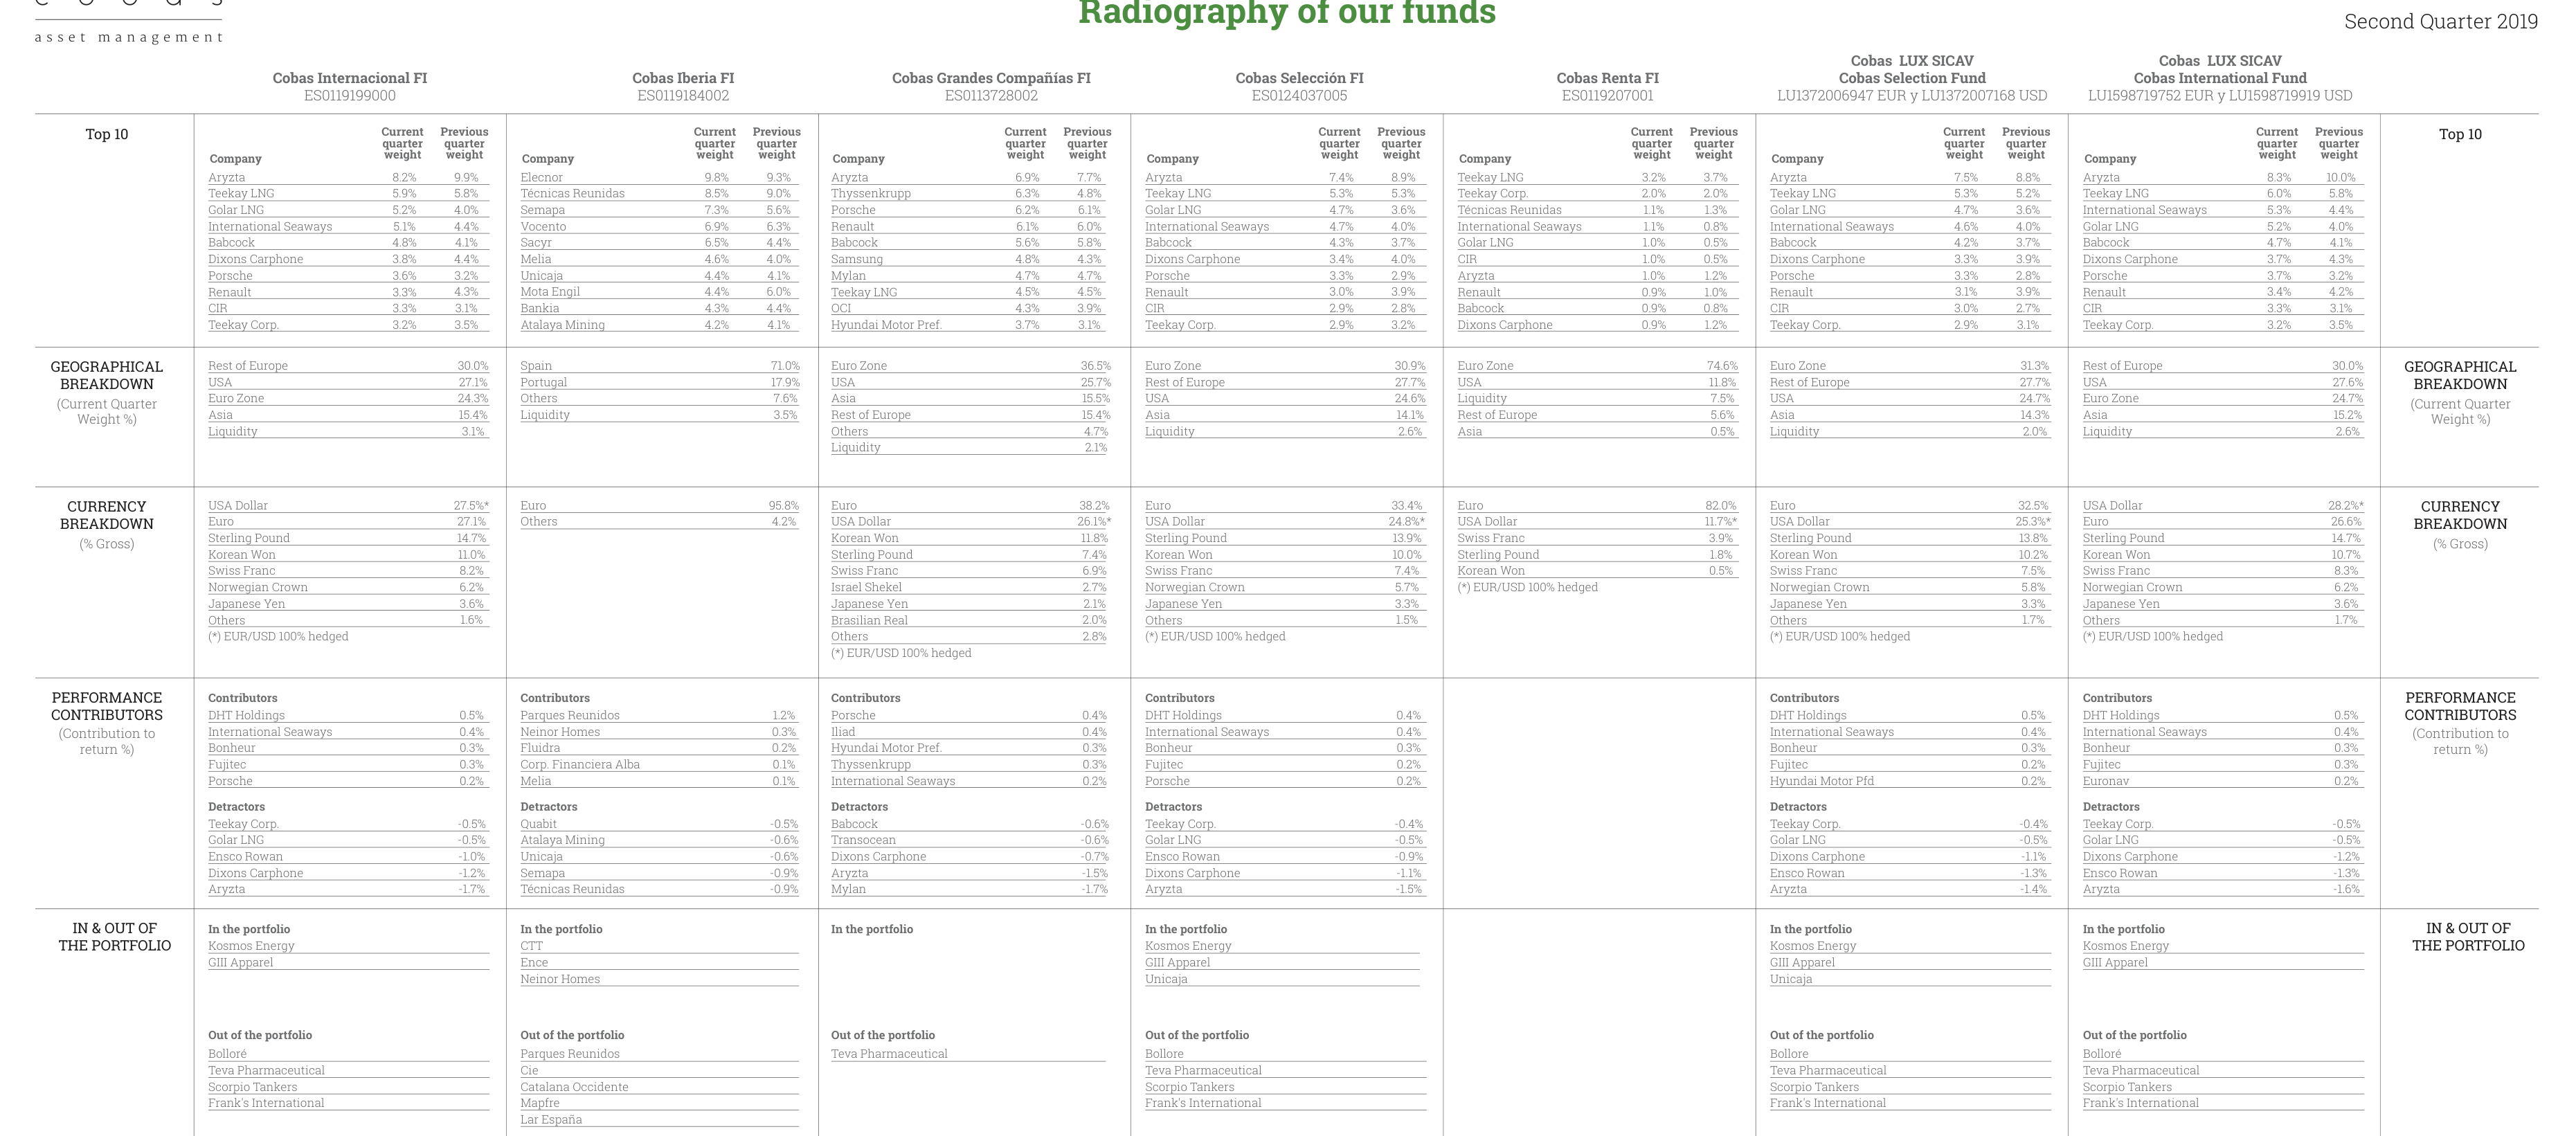
Comprehensive display of portfolio details for each fund, including top ten holdings, geographic distribution (Spain accounts for 71%), currency composition, and performance contributors
4. Legal and Regulatory Framework: Governance Advantages and Potential Risks Under Family Control
With families as the primary shareholders, their long-term perspective influences not only business decisions but also deeply shapes corporate governance structures. However, while this structure brings stability, it also entails unique legal and regulatory challenges.
4.1 Governance Advantages: Reducing Agency Costs and Enhancing Decision-Making Resilience
- Minimization of Agency Costs: In publicly traded companies with highly dispersed ownership, conflicts of interest between management and shareholders (i.e., the "principal-agent problem") are a core governance challenge. Large family shareholders are typically deeply involved in company operations, and their interests are closely aligned with the company's long-term value, thereby significantly reducing the risk of management pursuing short-term personal gains (such as excessive compensation or empire building). Research indicates that family-controlled companies often outperform non-family firms in governance efficiency.
- Long-Term and Resilient Decision-Making: Family shareholders are more inclined to support strategies that require long-term investment with less obvious short-term returns (such as R&D, brand building, and capacity expansion). This decision-making resilience enables companies to navigate economic cycles and avoid short-sighted behavior driven by quarterly earnings pressure. For example, during the 2008 financial crisis, many family-controlled companies (such as Germany's Mittelstand firms) achieved counter-cyclical growth thanks to their solid finances and long-term strategies.
4.2 Potential Risks: Minority Shareholder Protection and Tunneling
Despite the many advantages of family control, the legal and regulatory framework must guard against its potential risks, particularly regarding the protection of minority shareholders.
- Related-Party Transactions and Tunneling: Large family shareholders may use their control to transfer company benefits to the family through related-party transactions (e.g., purchasing from or selling assets to other companies controlled by family members at non-market prices). This requires robust independent director systems, disclosure rules, and judicial remedies to curb such practices.
- Tunneling: This refers to the transfer of company assets or profits by controlling shareholders through abnormal means. In family-controlled companies, this risk is particularly pronounced in the absence of effective checks and balances. For instance, some historical family conglomerates in India (such as certain large groups) have faced regulatory investigations due to related-party transaction issues.
- Succession Risk: Intergenerational succession in family businesses is a major challenge. If successors lack competence or interest, it can lead to governance deterioration and strategic missteps. The legal framework needs to provide mechanisms for smooth succession (such as family trusts or the introduction of professional managers) and ensure that the succession process is transparent and fair.
4.3 Comparative Data: Regulatory Differences for Family-Controlled Companies Across Markets
| Market/Region | Regulatory Characteristics for Family-Controlled Companies | Level of Minority Shareholder Protection (Reference Indicator) | Typical Examples |
|---|---|---|---|
| Continental Europe (e.g., Germany, France) | Laws allow dual-class share structures (e.g., preferred shares) but require strict disclosure and independent director ratios. Families often hold shares through foundations or holding companies. | High (well-established legal systems, strong judicial independence) | Germany's BMW (Quandt family), France's L'Oréal (Bettencourt family) |
| East Asia (e.g., South Korea, Japan) | Complex cross-shareholding and pyramid structures exist, with a significant divergence between family control and cash flow rights. Recent regulatory reforms have strengthened scrutiny of related-party transactions. | Medium (undergoing reform, but enforcement varies) | South Korea's Samsung (Lee family), Japan's Toyota (Toyota family) |
| Emerging Markets (e.g., India, Brazil) | Legal frameworks are relatively weak, and family control is common, but improvements have been made in recent years through the introduction of "independent directors" and "shareholder litigation" mechanisms. | Low (low judicial efficiency, high enforcement costs) | India's Tata Group, Brazil's Itaú bank family |
4.4 Conclusion: The Legal Framework as a "Safety Valve" for the Family Long-Term Perspective
The "family long-term perspective" emphasized by Cobas is not inherently risk-free. Its success depends heavily on the legal and regulatory environment of the relevant jurisdiction. A mature legal system should:
1. Protect Minority Shareholders: Through mandatory disclosure, related-party transaction approval procedures, independent director systems, and shareholder class-action mechanisms, prevent large family shareholders from abusing control.
2. Promote Orderly Succession: Provide flexible legal tools such as trusts and foundations to help families achieve a smooth transition of wealth and governance.
3. Balance Long-Term and Short-Term: Allow companies to adopt long-term strategies (e.g., retaining profits for reinvestment) while requiring them to clearly explain the rationale for long-term goals to the market, avoiding information asymmetry.
Therefore, for investors, when evaluating a family-controlled company, it is essential not only to analyze the long-term nature of its business model but also to scrutinize whether the legal and regulatory framework of its home country can effectively constrain family power, thereby converting the "long-term perspective" into sustainable shareholder value rather than a risk exposure for minority shareholders.