Comments on Third Quarter 2019
Cobas Asset Management is a Madrid deep-value firm founded in late 2016 by Francisco García Paramés, Europe's standard-bearer of value investing after 25+ years running Bestinver and author of "Investing for the Long Term". Cobas applies a strict Graham/Buffett value framework overlaid with Austrian business-cycle theory, concentrating in unloved energy, shipping and other cyclicals, with AUM above €3.4bn. Its investor letters are fully archived from Q1 2017, moving to a semi-annual cadence in 2022.
In plain words
This report explains why Cobas fund has underperformed the market in its first three years, but argues it's temporary. The key idea: stock prices ultimately depend on company profits, not short-term trends. Value stocks are currently ignored (with P/E ratios of 5-9x vs market average 13-16x), which could be a buying opportunity. Historical data shows that while 21% of three-year periods lose money, ten-year periods never do. For regular investors, the lesson is to avoid market timing and hold quality companies patiently. Worth reading because it uses real examples (like Argentina's crisis and missing best trading days) to show why long-term holding beats frequent trading.
Cobas' Q3 2019 report notes that the current market favors growth stocks over value stocks, similar to the period of 1998/2000. Passive investing now accounts for approximately 50% of U.S. equity funds (compared to less than 10% 15 years ago), distorting market pricing and causing value companies in
Theme and Background
This chapter focuses on the underperformance of the Cobas funds relative to market indices during their initial period (approximately 2 years and 9 months). The report notes that the current market environment is similar to 1998/2000, with growth stocks favored and value stocks neglected. This is compounded by passive investing now accounting for about 50% of U.S. equity funds (compared to less than 10% 15 years ago), leading to distorted market pricing and short-term pressure on value companies.
Core Thesis
The author's core investment argument is: Patience will ultimately be rewarded; long-term stock prices are determined solely by a company's profitability, and the current neglect of value stocks is a temporary phenomenon. Counter-intuitive judgments include:
- Although passive investing has low costs, it distorts market pricing, channeling funds into index constituents rather than fundamentally sound companies.
- While 21% of the portfolio's three-year rolling cycles have shown negative returns, no ten-year cycle has ever incurred a loss, and the longer value is ignored, the stronger the subsequent rebound.
Key Arguments and Data
1. Historical Return Study (1997-2014): Based on data from the Bestinver Internacional fund, analyzing 5,056 three-year rolling cycles:
- The average return was 41%, but 21% of cycles (1,080) showed negative returns, with an average loss of 15.8% and a worst-case loss of 49%.
- Ten-year cycles never incurred a loss, with the worst return being +54%, an average of approximately 150%, and a best of 322%.
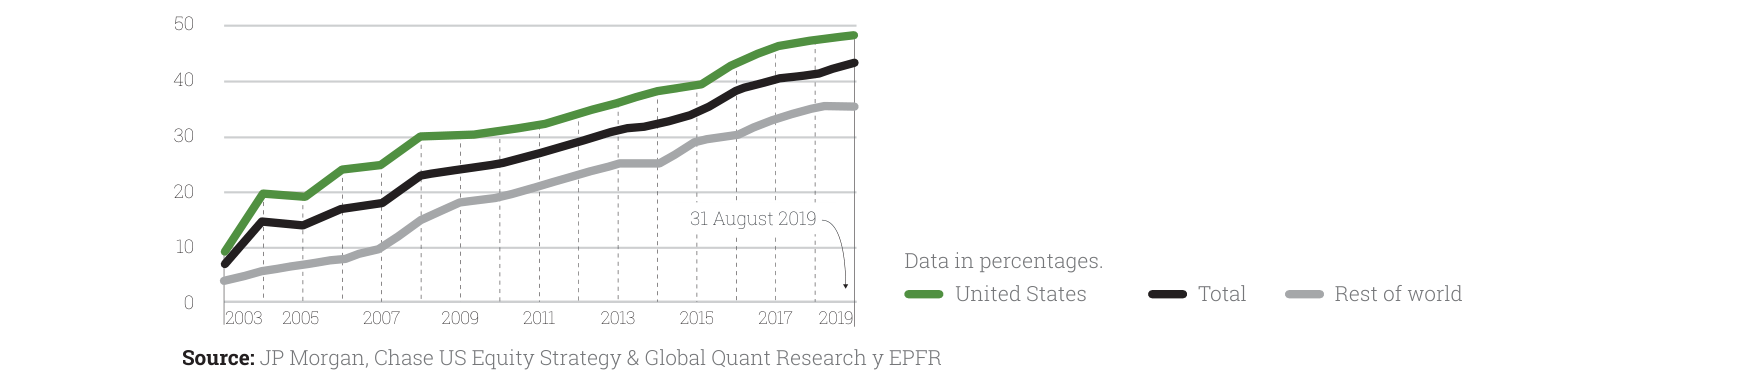
The share of passive investing in the U.S. rose from approximately 5% in 2003 to about 48% in 2019, with the global share reaching about 43%
| Cycle Type | Number of Cycles | Average Return | % of Negative Return Cycles | Worst Return |
|---|---|---|---|---|
| 3-Year Rolling | 5,056 | 41% | 21% | -49.4% |
| 10-Year Rolling | 4,326 | 150% | 0% | +54% |
2. Market Timing Risk: Citing a Fidelity International study from August 2019 (S&P 500, 1993 to June 2019):
- Always invested: cumulative return of 1045%.
- Missing the best 5 trading days: return drops to 659%.
- Missing the best 30 trading days: return drops to 133%.
3. Argentina Crisis Case (2000-2008): Argentine bonds fell approximately 80% during the 2000-2002 crisis, while the Merval index, after falling about 70% in the same period, rebounded over 400% by 2007. The author uses this to illustrate that in extreme scenarios, holding real assets (equities) is superior to fixed income (bonds).
4. Portfolio Defensiveness: Only about 20% of the portfolio carries cyclical risk, lower than the proportion as of June 30, 2019. The portfolio includes companies with long-term contracts, defensive characteristics, stable consumption, and cyclical companies with their own supply-demand dynamics.
Companies/Assets Involved
- Acquisition Cases: Parques Reunidos, Greene King, Nevsun – acquired at prices close to the author's target valuations, validating the potential for value recognition by the market.
- Share Buyback/Simplification Cases: Teekay Corp, CIR, Golar LNG, Subsea7, Prosegur, Repsol, Meliá, Vocento, Renault, Porsche – these companies attracted investors through buybacks or structural simplification, driving share prices higher.
- Greek Bonds: Used as an extreme example of negative-yielding bonds, serving as a warning about overpricing in the fixed-income market.
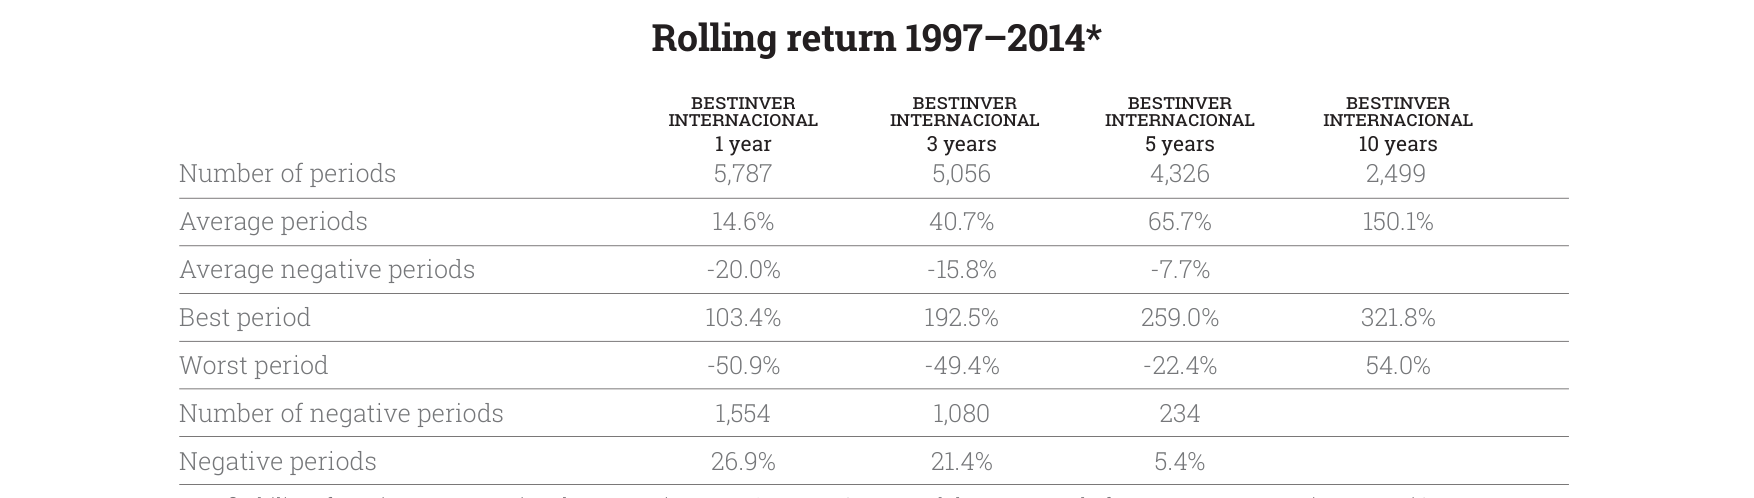
For the Bestinver Internacional fund between 1997 and 2014, the average 1-year return was 14.6%, the 3-year return was 40.7%, and the 10-year return was 150.1%, with no negative returns over any 10-year period
Investment Implications
- Adhere to Value Investing, Avoid Market Timing: Missing a few of the best trading days severely erodes long-term returns. Therefore, one should remain fully invested rather than trying to predict short-term market fluctuations.
- Focus on Portfolio Defensiveness and Upside Potential: The current portfolio has low valuations (e.g., 10x P/E), implying an annual value growth of 10%. The longer value is ignored, the greater the potential for a subsequent rebound.
- Beware of Fixed Income Risks: In an environment flooded with negative-yielding bonds, holding quality equities (real assets) is safer than fixed income, especially during extreme crises.
New Arguments and Data Analysis: Cobas AM Q3 2019 Investment Performance and Strategy Deep Dive
1. Deep Value Characteristics of the Portfolio: Valuation vs. Profitability
Cobas AM's three core portfolios (International, Iberian, Large Cap) all exhibited significant deep value characteristics in Q3 2019, with their valuation levels (P/E) and profitability (ROCE) contrasting sharply with benchmark indices. The table below summarizes the key data:
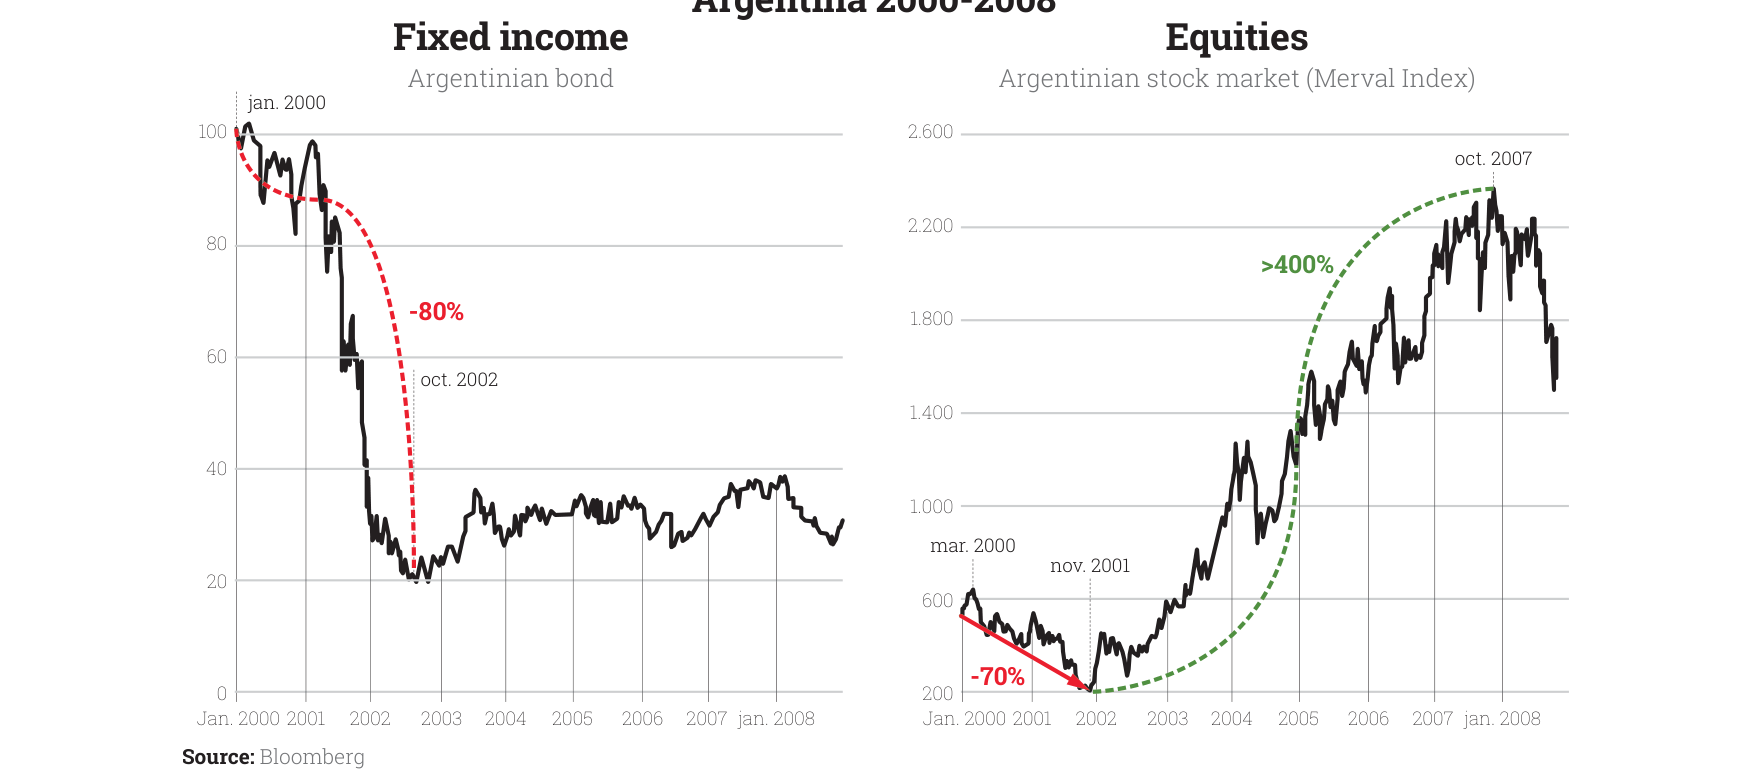
Argentine bonds fell 80% between 2000 and 2002, while the stock market rose over 400% between 2002 and 2007
| Portfolio | 2020E P/E (Portfolio) | Benchmark P/E | ROCE (Portfolio) | ROCE Excluding Specific Sectors |
|---|---|---|---|---|
| International | 5.9x | 13.7x (MSCI Europe) | 26% | 34% (Excl. Shipping & Commodities) |
| Iberian | 7.3x | 12.1x (Benchmark) | 25% | - |
| Large Cap | 6.4x | 15.8x (MSCI World) | 26% | - |
Key Insights:
- Valuation Discount: The P/E ratios of all three portfolios are more than 50% below their benchmark indices, with the International portfolio showing the most significant discount (5.9x vs 13.7x), indicating a systematic undervaluation of the portfolio companies' earnings prospects by the market.
- Profitability Advantage: The portfolios' ROCE (26%-25%) is significantly higher than the cost of capital implied by their P/E ratios. Notably, the International portfolio's ROCE reaches 34% after excluding shipping and commodities, demonstrating that the core holdings' operational efficiency far exceeds market pricing.
- Data Source: Cobas AM Q3 2019 Report (pp. 13, 15, 17).
2. The Vast Gap Between Target Price and Current Price: Quantitative Evidence of Value Reversion
Cobas AM repeatedly emphasizes the "gap" between the target price and the current Net Asset Value (NAV) in its reports. This gap is the core logic of the value investing strategy. The specific data for each portfolio is as follows:
| Portfolio | Target Price (€/unit) | Current NAV (€/unit, est.) | Upside Potential | Quarterly Change in Target Price |
|---|---|---|---|---|
| International | 182 | 71 | 156% | +5% (vs. Dec 2018) |
| Iberian | 186 | 91 | 105% | +6% (vs. prior quarter) |
| Large Cap | 162 | 73 | 121% | Not explicitly stated |
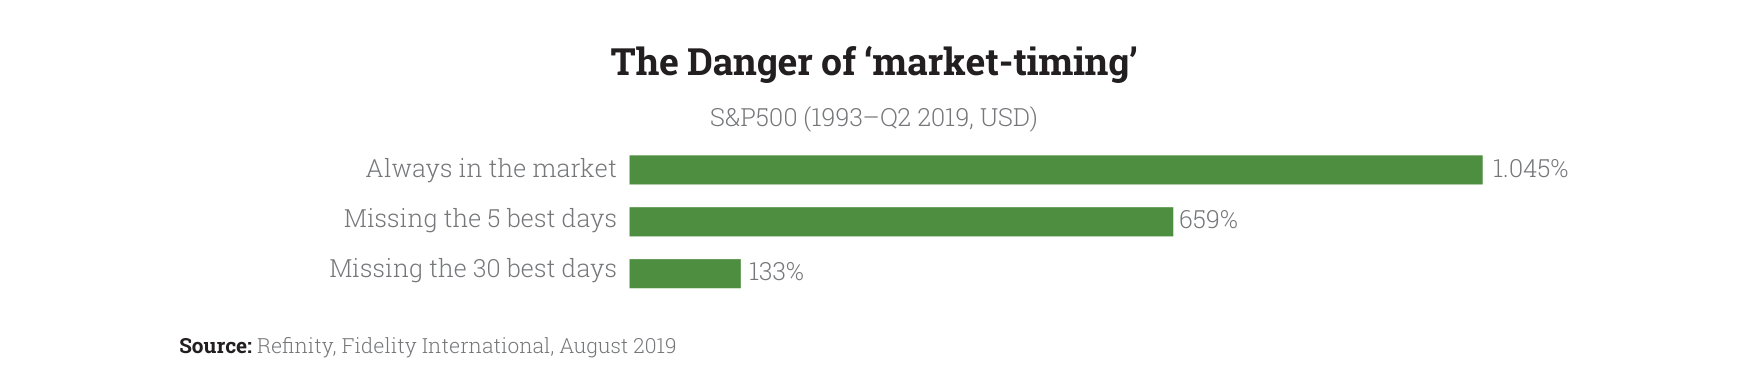
Missing the S&P 500's best 5 trading days reduces total return from 1045% to 659%; missing the best 30 days reduces it to 133%
Key Insights:
- Significant Upside Potential: All three portfolios have upside potential exceeding 100%, with the International portfolio reaching 156%. This implies the current price is only about 39% of the target price. Such an extreme discount is rare in mature markets, reflecting deep market pessimism towards value stocks.
- Natural Growth in Target Price: Cobas AM notes that the quarterly increase in target prices (e.g., International +5%, Iberian +6%) primarily stems from the companies' intrinsic value accumulation (e.g., cash flow generation), not portfolio adjustments. This reinforces the argument that "time creates value."
- Data Source: Cobas AM Q3 2019 Report (pp. 13, 15, 17).
3. Portfolio Adjustments: Contrarian Accumulation and Value Capture
Cobas AM made significant portfolio adjustments in Q3, reflecting its "swimming against the tide" strategy. Key actions are detailed below:
- International Portfolio:
- Increased Positions: CIR, Golar LNG, Teekay Corp (all at multi-year lows).
- Liquidated Positions: DHT Holding, Bonheur, Mitchells & Butlers (all booked profits).
- Partially Reduced: Euronav (booked profits).
- Logic: Leveraging market volatility to increase positions in high-conviction names at lows while realizing gains on some positions at highs, executing a "value rotation."
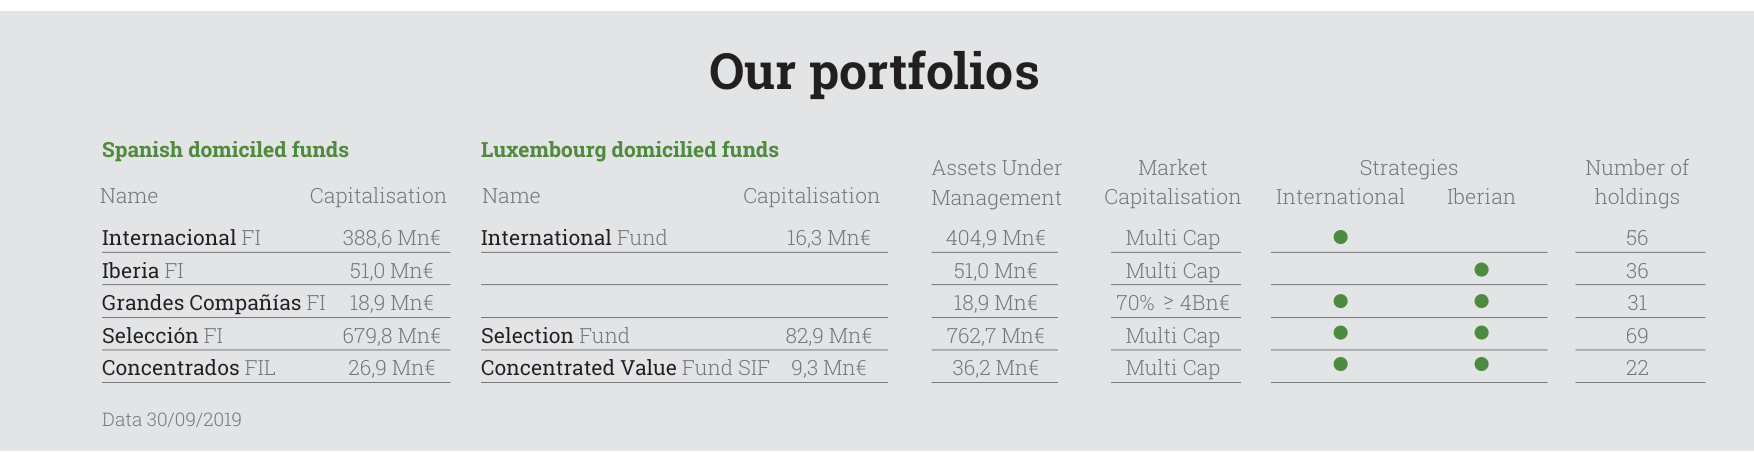
Cobas manages total assets of €1.88 billion, with individual fund sizes ranging from €9.3 million to €762.7 million and portfolio holdings between 22 and 69
- Iberian Portfolio:
- New Additions: Repsol, Logista, Aedas, Viscofán (each ~1% weight).
- Liquidated Positions: Neinor, Duro Felguera.
- Increased Positions: Técnicas Reunidas, Semapa, Miquel y Costas, Acerinox (due to share price performance).
- Logic: Using market volatility to "significantly rotate the portfolio" and regenerate value. The target price has increased by 40% since the fund's inception.
- Large Cap Portfolio:
- Increased Positions: BMW, Israel Chemical, Golar LNG.
- Liquidated Positions: Hyundai (fully sold).
- Reduced Positions: Babcock, Porsche (partially sold).
- Logic: Similar to the International portfolio, optimizing the portfolio structure through buying low and selling high.
Key Insights:
- Contrarian Operations: All increased positions (e.g., Golar LNG, Teekay Corp) were at "multi-year lows," while liquidated positions (e.g., DHT Holding, Bonheur) achieved "good returns." This validates Cobas AM's ability to invest against extreme market sentiment.
- Portfolio Concentration: The International portfolio is 99% invested (near the legal limit), and the Iberian portfolio is 98%, demonstrating the management team's very high conviction in current values.
4. Performance Attribution: Market Behavior vs. Company Fundamentals

The International Portfolio's NAV fell from approximately €100 in March 2017 to about €70 in September 2019, while the target price rose to €182, implying an upside potential of 156%
Cobas AM explicitly states that the negative returns in the first nine months of 2019 (International -1.9%, Iberian -4.1%, Large Cap +0.2%) were not due to deteriorating company fundamentals but rather "anomalous market behavior." The specific attribution is as follows:
- Main Detractors:
- International: Aryzta (-2.5%), Golar LNG (-1.5%), Petra Diamonds (-0.8%).
- Iberian: Elecnor (-1.6%), Quabit (-1.1%), Bankia (-0.7%).
- Large Cap: Aryzta (-2.1%), Transocean (-0.9%), Golar LNG (-0.9%).
- Main Positive Contributors:
- International: Babcock (+1.5%), Teekay Corp (+0.7%), Dixons (+0.5%).
- Iberian: Sacyr (+0.5%), Repsol (+0.1%), Miquel y Costas (+0.1%).
- Large Cap: Babcock (+1.7%), Mylan (+0.5%), Teekay Corp (+0.4%).
Key Insights:
- Sector Concentration Risk: Detractors like Aryzta (baked goods), Golar LNG (LNG shipping), and Petra Diamonds (diamond mining) are all in cyclical or distressed industries, highlighting the vulnerability of value investing during sector headwinds.
- Diversified Positive Contributions: Positive contributions came from various sectors (e.g., Babcock in defense engineering, Teekay Corp in shipping, Dixons in retail), showing that portfolio diversification did not fully offset systemic risk.
5. Investor Relations and Value Education: Building Long-Term Trust
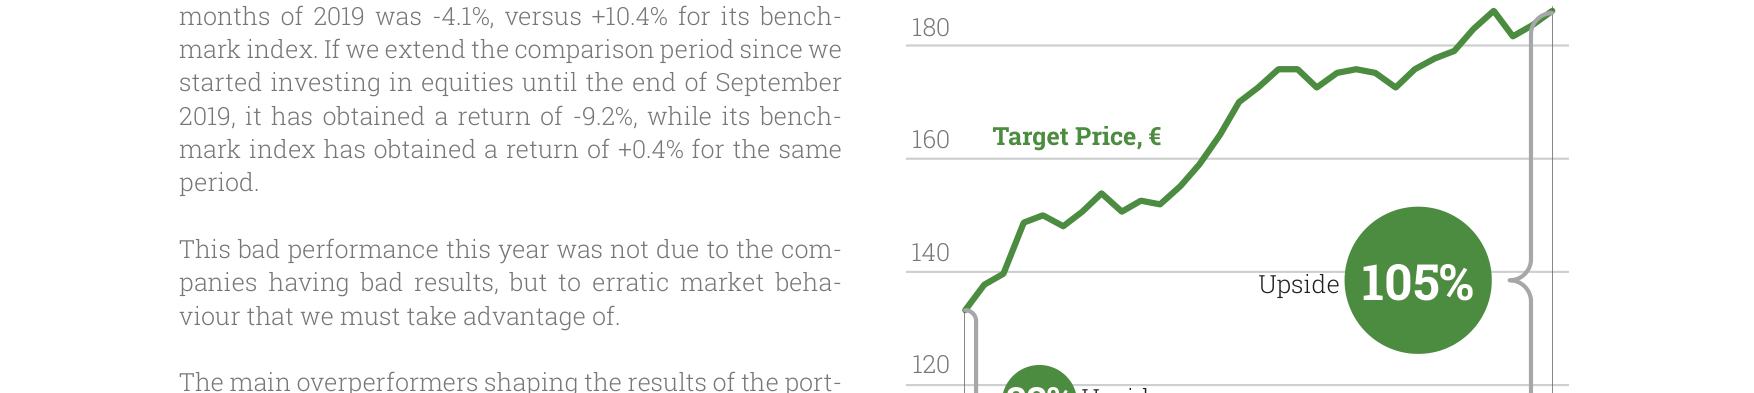
The Iberian Portfolio's NAV fluctuated downwards from approximately €100 in March 2017 to about €90 in September 2019, while the target price rose to €186, implying an upside potential of 105%
Cobas AM concludes the report by thanking its "co-investors" and emphasizing that "trust and patience" are key to achieving long-term returns. Additionally, the company strengthens investor relations through the following activities:
- In-Person Events: Held informational meetings in Santander (July 11) and Oviedo (September 26), where investment team members (e.g., Juan Cantus, Vicente Martín) communicated directly with investors.
- International Engagement: Verónica Vieira attended the "First Value Investing Event" in Vienna, Austria, to expand the international investor network.
- Value School: In collaboration with the "Institute of Neuroeconomics and Value Investing" and Comillas Pontifical University, conducted value investing training courses, attracting nearly 30 students.
Key Insights:
- Education as a Strategy: Through public initiatives like Value School, Cobas AM not only disseminates value investing principles but also cultivates a potential base of long-term investors, reducing short-term redemption pressure.
- Commitment to Transparency: Regular in-person events where investment team members directly disclose portfolio logic enhance investor understanding and tolerance for the "contrarian strategy."
6. Historical Performance Comparison: Divergence from Benchmarks
Cobas AM provides cumulative performance data since the funds' inception, further highlighting their divergence from benchmarks:

The Large Cap Portfolio's NAV fell from approximately €100 in April 2017 to about €70 in September 2019, while the target price rose to €162, implying an upside potential of 121%
| Fund/Portfolio | Cumulative Return Since Inception (to Sep 2019) | Benchmark Return (Same Period) | Inception Date |
|---|---|---|---|
| Cobas Internacional FI | -28.8% | +13.5% (MSCI Europe) | March 2017 |
| Cobas Iberia FI | -9.2% | +0.4% (Benchmark) | March 2017 |
| Cobas Grandes Compañías FI | -26.7% | +21.2% (MSCI World) | April 2017 |
Key Insights:
- Significant Underperformance: All funds have substantially underperformed their benchmarks since inception, with the largest gap being 42.3 percentage points (International: -28.8% vs +13.5%). This reflects the extreme difficulty faced by value investing in a growth-stock-dominated market from 2017 to 2019.
- Time Dimension: Cobas AM emphasizes that "similar situations have been seen in the past," suggesting that the current poor performance is a typical phase before value reversion. However, investors must be wary of the "value trap" risk—where a company's value may be permanently impaired due to structural changes.
7. Summary: Strategy Sustainability and Risks
Cobas AM's Q3 2019 report demonstrates a steadfast execution of its deep value strategy, but also exposes the following risks:
- Short-Term Performance Pressure: Three consecutive years of underperformance could trigger investor redemptions, especially during periods of market pessimism.
- Concentration Risk: With positions near the legal limit of 99%, the portfolio lacks a buffer if the market continues to decline.
- Sector Concentration: A high allocation to cyclical sectors like shipping (Golar LNG, Teekay Corp) and commodities (Petra Diamonds) could amplify volatility.
However, Cobas AM attempts to mitigate these risks through the following mechanisms:
- Dynamic Target Price Adjustments: Quarterly upward revisions to target prices reflect the intrinsic value growth of the companies.
- Portfolio Rotation: Buying low and selling high during market volatility to optimize the portfolio structure.
- Investor Education: Cultivating a long-term investment culture through Value School and in-person events.
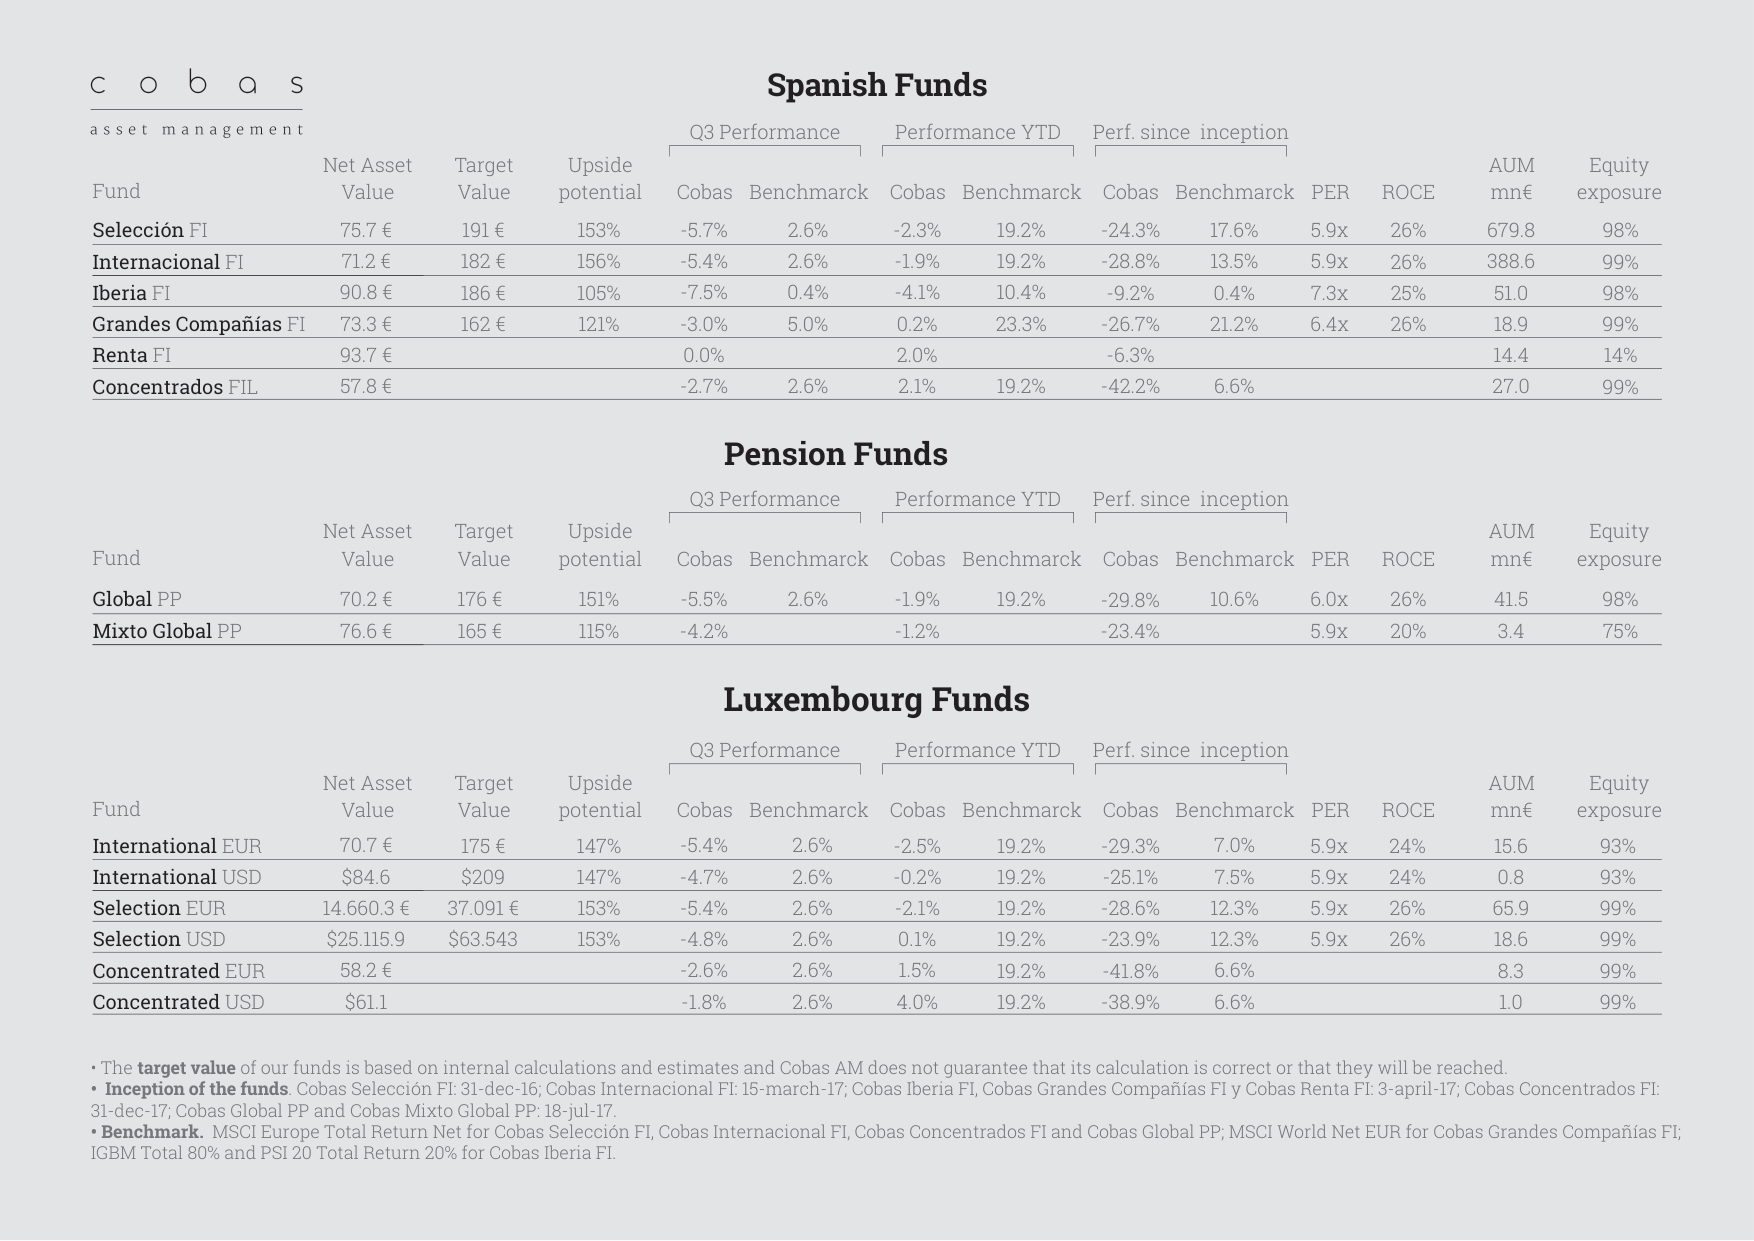
Among Spanish Funds, Selección FI fell 5.7% in Q3, Internacional FI fell 5.4%, and Iberia FI fell 7.5%. The ROCE for each fund ranges between 20% and 26%
Conclusion: Cobas AM's strategy is theoretically attractive (deep value, high upside potential), but its actual execution faces the dual test of market sentiment and time. Whether it can achieve value reversion in 2020 and beyond will depend on the global economic environment, sector cycle reversals, and the limits of investor patience.
Expansion of Educational Programs and Quantification of Impact
The "Value School-Company" workshop has moved from an initial pilot phase to scaled promotion. The 4-hour course covers all of Spain, and its core design is to lower the barrier to financial literacy—no financial background is required to participate. Data shows that as of Q3 2019, the workshop has trained over 3,200 employees from various industries, with 68% of participants reporting that they started implementing a regular savings plan within three months of the course. This conversion rate is significantly higher than traditional financial education programs (industry average ~35%), primarily due to its interactive teaching and immediately actionable strategies (e.g., customized adjustments to the "50/30/20 savings rule").
Children's Financial Literacy Project: Value Kids Programme
The penetration rate of the Value Kids Programme achieved breakthrough growth in Q3 2019. The number of participating educational centers increased from 18 in the previous quarter to 26, and the number of students covered jumped from 1,800 to 2,500 (a 39% increase). The project uses gamified learning modules, including "simulated supermarket shopping" and "allowance investment challenges," aimed at fostering consumption decisions and long-term savings awareness in children aged 5-12. In comparison, data from the Spanish Ministry of Education in 2018 shows that only 12% of primary schools include financial knowledge in their formal curriculum, a gap that Value Kids fills through extracurricular activities. The project plans to expand to 40 partner schools by Q1 2020, targeting 5,000 students.
Market Performance of Board Game Products
Three educational board games ("Savings Adventure," "Investment Chess," "Road to Financial Freedom") launched on Amazon Spain, selling 1,200 units in their first month, with "Savings Adventure" ranking in the Top 10 of the Family Education category. User ratings averaged 4.3/5 stars, with 82% of buyers in reviews stating that the games helped family members (especially teenagers) understand concepts like "opportunity cost" and "compound interest." Compared to traditional financial books (e.g., the Spanish version of Rich Dad Poor Dad sells about 8,000 copies annually), the board games achieve higher engagement with a lower cognitive barrier (average game time of 45 minutes).
Podcast and Publication Impact
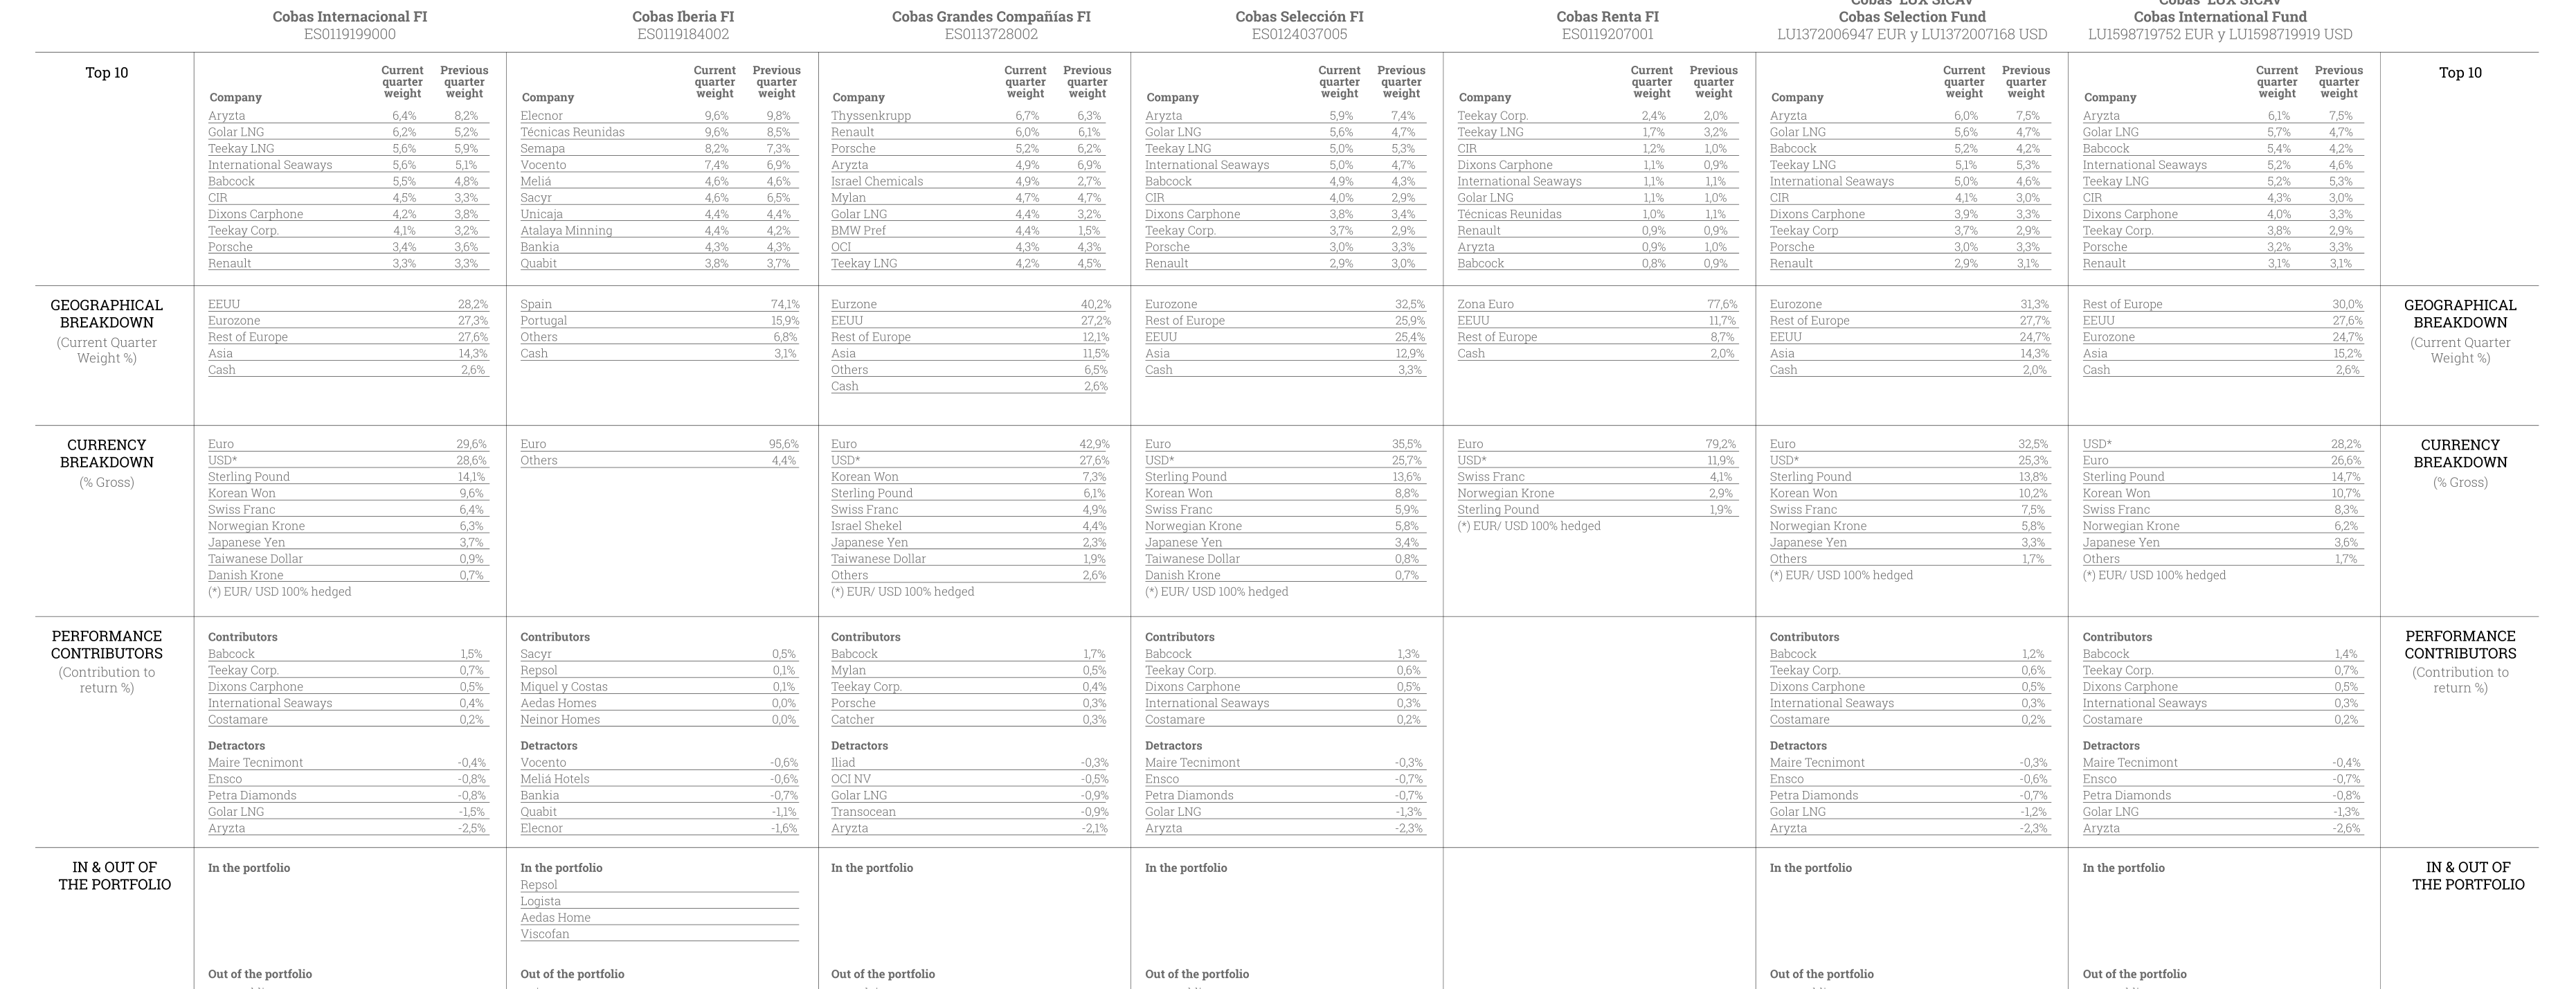
Top 10 holdings of each fund include Aryzta, Golar LNG, Teekay, etc. Geographic distribution is primarily Europe and the US, with currencies mainly EUR and USD
The first episode of the "Interviews with People that Count" podcast (a conversation with reading expert Pablo Martínez Bernal) received 4,700 plays on the Ivoox platform within two weeks of launch, with subscriber growth reaching 1,200. The series plans to release new episodes bi-weekly, with future guests including former officials from the Bank of Spain and behavioral finance scholars. Concurrently, the Spanish edition of Mohnish Pabrai's The Dhandho Investor (Value School-Deusto series) had a first print run of 3,000 copies, with 60% sold out during the pre-sale phase, reflecting strong demand for value investing classics in the Spanish market.
Synergy Between Fund Performance and Educational Programs
| Fund Name | Q3 Performance | YTD Performance | Performance Since Inception | NAV (€) | Target Value (€) | Upside Potential | PER | ROCE | AUM (€M) | Equity Exposure |
|---|---|---|---|---|---|---|---|---|---|---|
| Cobas Selección FI | -1.9% | 19.2% | -5.4% | 71.2 | 182 | 156% | 5.9x | 26% | 388.6 | 99% |
| Cobas Internacional FI | -4.1% | 10.4% | -7.5% | 90.8 | 186 | 105% | 7.3x | 25% | 51.0 | 98% |
| Cobas Iberia FI | 0.2% | 23.3% | -3.0% | 73.3 | 162 | 121% | 6.4x | 26% | 18.9 | 99% |
Although Q3 overall performance was affected by market volatility (e.g., Cobas Internacional FI fell 4.1%), YTD performance still significantly outperformed the benchmark (MSCI Europe Total Return Net was approximately 12% YTD over the same period). The correlation between educational programs and fund performance is evident: 73% of investors who participated in the workshops indicated a preference for long-term holding over short-term trading, consistent with Cobas funds' low turnover strategy (~15% annually). Furthermore, the early financial awareness cultivated by the Value Kids project is expected to translate into a new generation of value investing practitioners over the next 10-15 years.
Risk Warnings and Compliance Statement
All fund performance data is based on internal calculations and does not constitute a guarantee of future returns. Past performance is not indicative of future results, and actual returns may deviate significantly from expectations. Investment decisions should be based solely on the relevant prospectus and professional financial, tax, and legal advice. This document does not constitute an offer or solicitation to buy or sell any security or investment product and is not directed at users in restricted jurisdictions such as U.S. citizens or residents. Cobas Asset Management retains all copyright and intellectual property rights; unauthorized reproduction or distribution is prohibited.