Comments on Fourth Quarter 2017
Cobas Asset Management is a Madrid deep-value firm founded in late 2016 by Francisco García Paramés, Europe's standard-bearer of value investing after 25+ years running Bestinver and author of "Investing for the Long Term". Cobas applies a strict Graham/Buffett value framework overlaid with Austrian business-cycle theory, concentrating in unloved energy, shipping and other cyclicals, with AUM above €3.4bn. Its investor letters are fully archived from Q1 2017, moving to a semi-annual cadence in 2022.
In plain words
This report covers Cobas fund's performance in Q4 2017. Despite the euro strengthening (which hurt returns from non-euro assets), the fund stuck to buying undervalued stocks, especially in Asia and Europe. For regular investors, the key takeaway is: don't panic over short-term market moves; focus on a company's true value. For example, they own Daiwa Industries, a Japanese firm with a price-to-earnings ratio (P/E, a measure of how cheap a stock is) of just 5, while its main competitor trades at 20. The fund also sold some stocks that had risen and bought new ones they expect to gain 50-100%. It's worth a read because it shows how professional investors go against the crowd and find hidden bargains through deep analysis.
Cobas' fourth-quarter 2017 report shows strong performance across its funds. Cobas Internacional FI posted a quarterly return of 6.61%, significantly outperforming its benchmark, the MSCI Europe, which returned 0.63%. Its net asset value stood at €105.75 per share, with a target value of €196.70 per
Theme and Background
This chapter is the opening summary of Cobas Asset Management's fourth-quarter 2017 letter, primarily reviewing the performance, portfolio changes, and investment strategy adjustments of its four equity funds in Q4. The market backdrop was the euro's strength, which created a short-term drag on portfolios heavily weighted toward non-eurozone assets. However, the fund manager maintained a contrarian stance, believing that companies in Asia and parts of Europe were significantly undervalued.
Core Thesis
The author's core investment argument is: Despite the euro's appreciation causing short-term performance pressure (a loss of approximately 4% for the international portfolio), the fund, by consistently raising its target value (the international portfolio's target price rose from €180.3 to €196.7), still retains 86% upside potential. The current high allocation (97%) reflects strong conviction in the portfolio's deep undervaluation. Contrarian judgments include: 1) Actively increasing exposure to non-eurozone regions (especially Asia) despite a strong euro; 2) Viewing Aryzta's profit warning as a temporary issue, maintaining a long-term bullish outlook; 3) Believing the decline in Babcock International represents a market misjudgment of its competitive advantages.
Key Arguments and Data
- Performance Comparison: All four funds significantly outperformed their benchmarks in Q4. Cobas Internacional FI returned 6.61% vs. a benchmark of 0.63%, an outperformance of nearly 6 percentage points.
- Target Value Increase: The international portfolio's target price has risen consistently from €157.8 at inception to €196.7, a cumulative increase of 24.6%.
- Asian Portfolio Characteristics: Among the 12 Asian companies, 10 hold net cash, 12 are family-owned, with an average upside potential of 82%, ROCE of 19%, free cash flow yield of 12%, and a P/E ratio (excluding cash and non-strategic assets) of just 5.16x.
- Daiwa Industries Case Study: Net cash/market cap ratio of approximately 64%, P/E of 5x, while its largest competitor, Hoshizaki, trades at a P/E of 20x, indicating extreme undervaluation.
- Portfolio Adjustments: Sold 8 stocks including Exor and Gaztransport in Q4, and bought 12 new positions including Costamare and Fugro, with expected upside of 50%-100%.
| Fund Name | Q4 Return | Benchmark Return | NAV (€/share) | Target Price (€/share) | Upside Potential | Allocation |
|---|---|---|---|---|---|---|
| Cobas Internacional FI | 6.61% | 0.63% | 105.75 | 196.70 | 86% | 97% |
| Cobas Iberia FI | 2.06% | -1.70% | 110.19 | 153.20 | 39% | 95% |
| Cobas Grandes Compañías FI | 7.19% | 3.87% | 105.81 | 169.30 | 60% | 95% |
| Cobas Selección FI | 6.49% | 0.63% | 110.05 | 200.30 | 82% | 97% |
Companies/Assets Involved
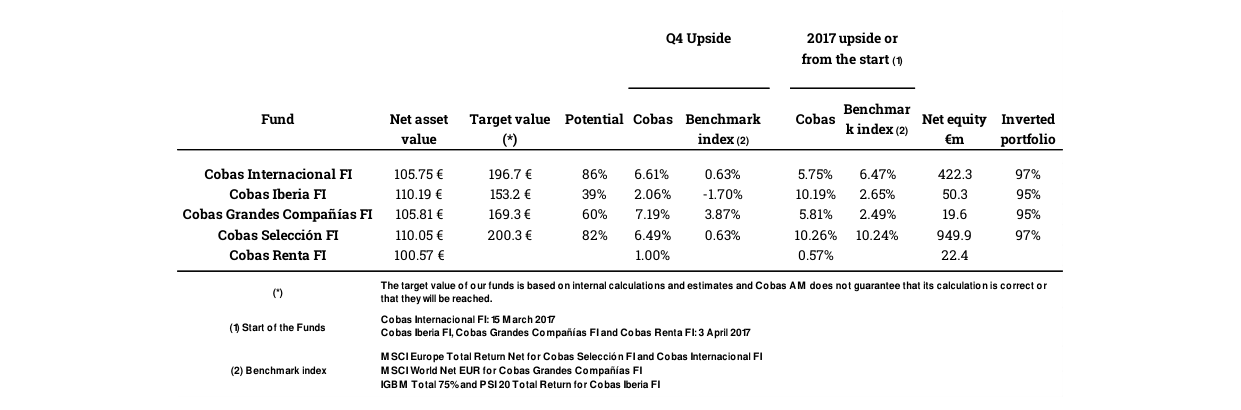
Displays key metrics for five funds: net asset value (€105.75-€110.57), target value, and Q4 upside potential (up to 86%)
- Aryzta (Bullish): Largest positive contributor in Q4 (+2.27%), but the stock fell after a January profit warning. The author believes the sudden cost increase in the US is temporary and does not affect long-term valuation. Position size 8.68%, the largest holding.
- ICL (Bearish): Largest negative contributor in Q4 (-0.63%), with a cumulative drag of -1.13% since inception. Position size 6.19%, the second-largest holding.
- Babcock International (Bullish): Fell -14.43% in Q4, contributing -0.50%. The author believes the market misjudges its competitive advantages. Position size 3.95%.
- Daiwa Industries (Bullish): Japanese industrial refrigeration equipment manufacturer, family-owned (Ozaki family holds 42%), ROCE over 50%, net cash/market cap 64%, P/E 5x. Weight in Cobas Selección FI is 1.68%.
- Teekay Group (Bullish): Teekay Corp (4.96%) and Teekay LNG (4.94%) combine for nearly 10% weight, the third-largest directional holding.
- New Buys: Costamare Inc, Exmar, Fugro, Golar LNG, Kongsberg Grupp, LG Corp Prefs., Mylan, NS Shopping, Petra Diamonds, Petrofac, TechnipFMC, Teva, with expected upside of 50%-100%.
Investment Implications
- Contrarian Allocation to Non-Eurozone Assets: Despite a strong euro, the fund actively increased exposure to Asia (Japan, Korea) and the US (totaling 38.1%), while fully hedging USD exposure. Investors can consider similar strategies to exploit discount opportunities created by currency fluctuations.
- Deep Value Stock Selection Criteria: The overall portfolio has a P/E of just 9.2x and ROCE of 28%, with Asian holdings averaging a P/E of 5.16x. The current market mispricing of these low-valuation, high-ROCE, family-controlled, net-cash-rich companies is the core source of alpha.
- Beware of Short-Term Noise: The author views Aryzta's profit warning and Babcock's decline as market misjudgments, but investors need to independently verify the logic (e.g., whether Aryzta's US cost issue is truly temporary). Such event-driven opportunities require in-depth research.
Additional Arguments, Data, and Views
1. Fund Performance vs. Market Environment
Cobas Iberia FI achieved a positive return in Q4 (+2.06%), while its benchmark (75% I.G.B.M. Total + 25% PSI 20 Total Return) fell 1.70%, resulting in an outperformance of 3.76 percentage points. Since inception (early April 2017 to end of December), the fund has accumulated a return of 10.19%, significantly exceeding the benchmark's 2.65%, an outperformance of 7.54 percentage points. This performance suggests the fund's stock selection strategy in the Iberian market has been effective in both the short and medium term.
In comparison, Cobas Grandes Compañías FI returned 7.19% in Q4, outperforming the MSCI World Net EUR index (+3.87%) by 3.32 percentage points; since inception, it has returned 5.81%, also outperforming the benchmark's 2.49% by 3.32 percentage points. However, the international fund's cumulative outperformance is lower than the Iberian fund, potentially reflecting greater global market volatility or higher stock selection difficulty.
| Metric | Cobas Iberia FI | Benchmark Index | Outperformance | Cobas Grandes Compañías FI | MSCI World Net EUR | Outperformance |
|---|---|---|---|---|---|---|
| Q4 Return | +2.06% | -1.70% | +3.76% | +7.19% | +3.87% | +3.32% |
| Return Since Inception | +10.19% | +2.65% | +7.54% | +5.81% | +2.49% | +3.32% |
2. Portfolio Concentration and Sector Allocation Changes
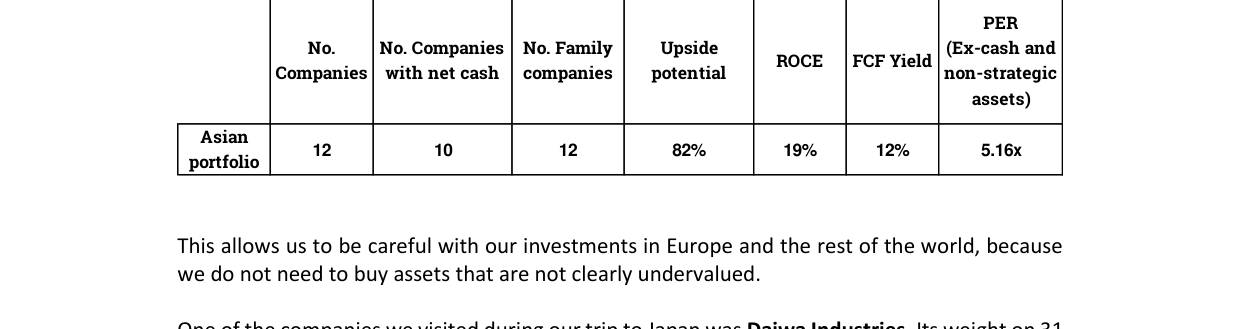
Asian Portfolio: 12 companies, 82% upside potential, 19% ROCE, 12% FCF yield, 5.16x PER
Cobas Iberia FI's top ten holdings represent a high and increasing concentration. The top ten weight in Q4 was approximately 55.11% (vs. ~46.99% in the prior quarter), indicating increased conviction in specific names. Notably, Técnicas Reunidas weight rose from 8.44% to 9.14%, becoming the largest holding; Telefónica rose from 6.12% to 7.83%; Quabit from 3.01% to 4.56%; and CTT-Correios de Portugal from 2.05% to 3.82%. These increases occurred during periods of stock price declines, reflecting a contrarian investment style.
Cobas Grandes Compañías FI's top ten weight was approximately 52.88% (vs. ~51.15% in the prior quarter), showing little change in concentration. However, Teva Pharm's weight increased significantly from 3.03% to 7.24%, becoming the largest holding; Mylan rose from 2.70% to 4.74%; and KT Corp entered the top ten (4.69%). This indicates increased allocation to the pharmaceutical and telecom sectors.
3. Geographic Distribution and Currency Risk Management
Cobas Grandes Compañías FI's geographic allocation saw significant changes: US weight jumped from 12% to 23.3%, Europe (Eurozone + Non-Eurozone) fell from ~50% to 44.5%, and Asia rose from ~15% to 15.9%. This adjustment was primarily driven by new US stocks (e.g., Gilead Sciences, Petrobras) and increased positions in Teva, Mylan, and other US companies. Notably, the fund maintains a 100% hedge on its USD exposure, indicating management's cautious stance on USD currency risk to prevent exchange rate fluctuations from eroding returns.
4. Stock Case Study: Teva Pharm's Deep Value Logic
Teva Pharm is the largest holding in Cobas Grandes Compañías FI (7.24%), and its investment thesis exemplifies a deep value strategy:
- Industry Context: The global generics market is growing due to aging populations and increased penetration in emerging markets, but the industry faces customer consolidation and pricing pressure.
- Company Distress: Management missteps, aggressive acquisition strategy, and the expiration of its key patented drug Copaxone caused the stock to fall from a 2015 high of $70 to $11 in November 2017, a decline of over 84%. Net debt/EBITDA ratio is near 5x, indicating financial fragility.
- Turnaround Catalyst: New CEO Kåre Schultz (former Lundbeck CEO, whose tenure saw the stock triple) announced a restructuring plan, with market expectations that he can avoid dilutive equity raises. As of December 31, 2017, Teva's P/E was just 6.25x, an extremely low valuation.
- Risk Warning: If the restructuring fails or industry price wars intensify, Teva could decline further. However, the fund controls cost by building the position in stages ("buying too early, but adding on weakness").
5. Target Price and Valuation Potential
Cobas Iberia FI's target price rose from €149.8 to €153.2, representing 39% upside from its net asset value (€110.19). The P/E is 11.0x, and ROCE is 24%, indicating a reasonably valued portfolio with strong profitability.
Cobas Grandes Compañías FI's target price rose from €162.9 to €169.3, representing 60% upside from its net asset value (€105.81). The target price increase is primarily driven by expectations of valuation recovery in auto-related companies (e.g., Porsche) and Teva. However, the 60% potential gain also implies higher risk, dependent on fundamental improvements and shifts in market sentiment.
6. Portfolio Turnover and Contrarian Characteristics
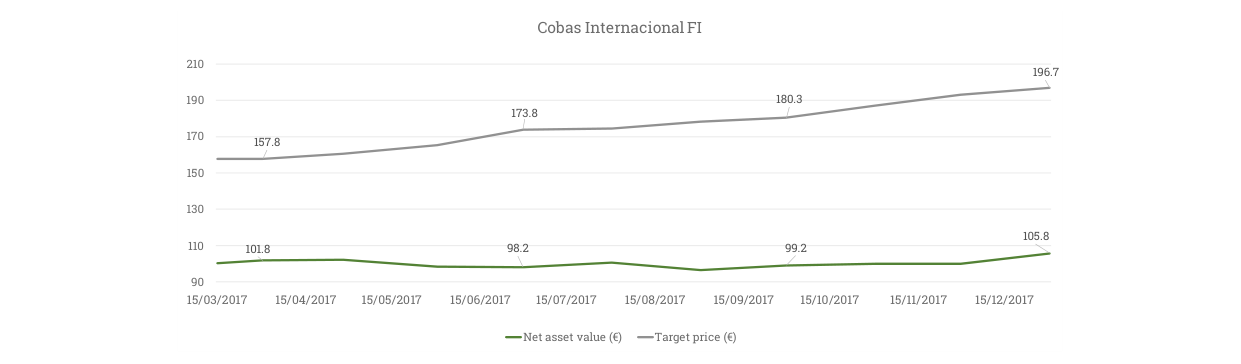
Target price rose from €157.8 to €196.7, NAV fluctuated in the €101.8-105.8 range
Both funds exhibit clear contrarian characteristics:
- Cobas Iberia FI: Increased positions in Telefónica (-9.50%), Técnicas Reunidas (-26.73%), Euskaltel (-27.47%) during price declines; reduced Elecnor (+44.37%) to lock in some gains.
- Cobas Grandes Compañías FI: Increased positions in Babcock International (-14.43%) and ICL (-9.19%) during declines; sold profitable stocks like Bayer and Continental, replacing them with new names like Gilead Sciences and Petrobras.
This "buy low, sell high" strategy was effective in 2017, but investors must be wary of value traps (e.g., if Teva's restructuring disappoints, it could be a persistent drag on returns).
7. Size and Unitholder Structure
As of December 31, 2017:
- Cobas Iberia FI: €50.3 million in assets under management, 1,640 unitholders, average investment of approximately €30,700 per unitholder.
- Cobas Grandes Compañías FI: €19.6 million in assets under management, 664 unitholders, average investment of approximately €29,500 per unitholder.
Both funds are relatively small, but unitholder numbers have grown rapidly (only 9 months since inception), indicating market recognition of the value strategy. However, small funds may face challenges in liquidity management and market impact costs, especially given concentration in small and mid-cap stocks (e.g., stocks with market caps below €400 million represent 18.55% of Cobas Iberia FI).
Additional Analysis: Cobas Fund Performance and Strategy Deep Dive – Q4 2017
I. Cobas Selección FI Quarterly Performance vs. Benchmark
In Q4 2017, Cobas Selección FI achieved a return of 6.49%, significantly outperforming its benchmark, the MSCI Europe Total Return Net, which gained 0.63%, an outperformance of 5.86 percentage points. This performance continues the fund's value investing advantage since inception, but it is worth noting that the full-year return of 10.26% was roughly in line with the benchmark's 10.24%, indicating that the outperformance was concentrated in Q4.
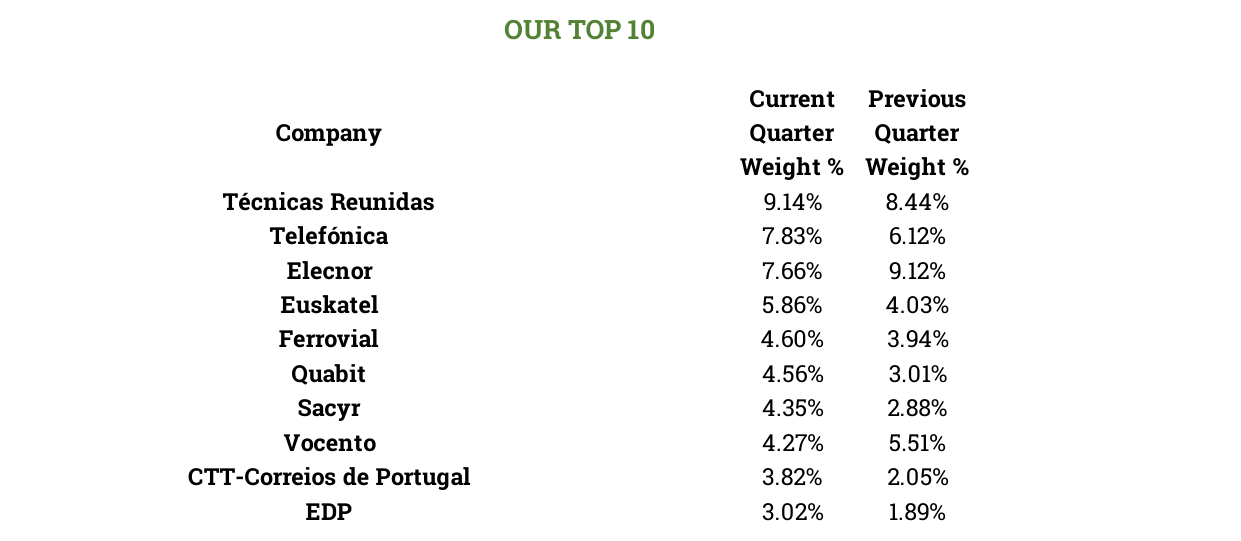
Top 10 holdings by weight: Técnicas Reunidas 9.14%, Telefónica 7.83%, Elecnor 7.66%
| Metric | Cobas Selección FI | MSCI Europe Total Return Net |
|---|---|---|
| Q4 2017 Return | 6.49% | 0.63% |
| Full Year 2017 Return | 10.26% | 10.24% |
| Negative Impact from Euro Appreciation | -4% | Not separately disclosed |
Key Data Points:
- Fund NAV rose from €99.8 at end of 2016 to €110.05 at end of 2017, a gain of 10.26%
- Target price increased from €185 to €200.3, expanding potential upside from 79% to 82%
- Allocation reached 97%, near the legal limit of 99%, reflecting the manager's high conviction in current valuations
II. Portfolio Adjustments and Sector Rotation Logic
2.1 Analysis of Major Contributors and Detractors
Major Q4 Contributors:
- Aryzta (+27.02%, contributed 2.08%): Benefited from asset sales (non-core assets) and a special dividend from subsidiary Picard, leading to a stock price recovery. However, note that in January 2018, the company issued a profit warning (due to a sudden cost increase in the US), causing the stock to fall; the manager views this as temporary.
- Porsche (+28.98%, contributed 0.66%): The auto sector saw a 15% valuation uplift, reflecting more realistic assumptions.
- Teekay LNG (+12.39%, contributed 0.59%): Recovery in energy transportation demand.
Major Q4 Detractors:
- ICL (-9.19%, contributed -0.58%): Israeli chemical company, affected by global fertilizer price volatility.
- Babcock International (-14.43%, contributed -0.45%): Market misjudgment of its competitive advantages.
- Dynagas LNG (-20.91%, contributed -0.22%): Short-term supply-demand imbalance in the LNG shipping industry.
2.2 Portfolio Changes: Sell and Buy Rationale
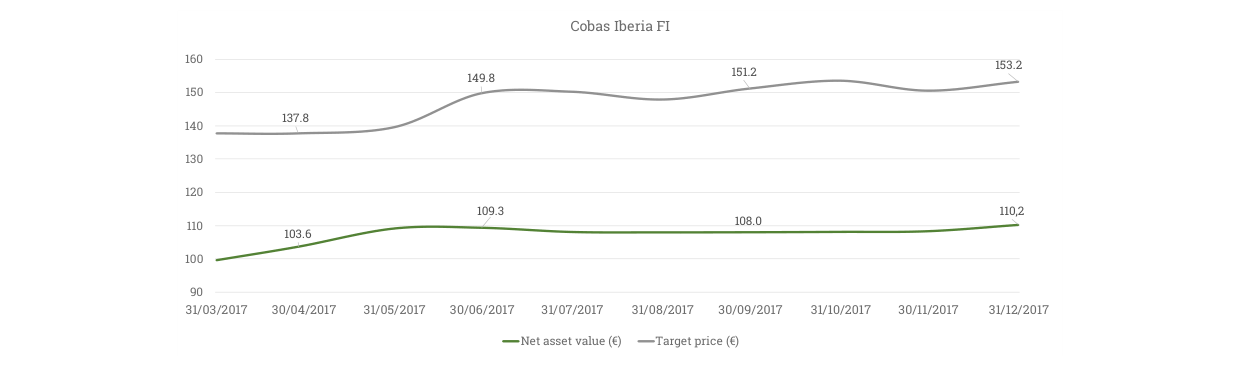
Target price rose from €137.8 to €153.2, NAV rose from €103.6 to €110.2
Sells (10 total): Including Alba, Exor, Gaztransport, Howden Joinery, Inmobiliaria del Sur, Kroton, LG Household, Rieter, Tesco, Unicaja. Rationale: These stocks had lower upside potential compared to new buys.
Buys (15 total): Including Costamare Inc, Euskaltel, Exmar, Fugro, Golar LNG, Kongsberg Grupp, LG Corp Prefs., Mylan, NS Shopping, Petra Diamonds, Petrofac, Quabit Inmobiliaria, Sacyr, TechnipFMC, Teva. Expected upside of 50%-100%.
Sector Concentration: The top three holdings (Aryzta, Teekay Group, ICL) account for approximately 23% of the portfolio, slightly down from ~24% in the prior quarter, reflecting a diversification strategy.
III. Deep Dive into the Asian Portfolio
3.1 Asian Portfolio Characteristics
| Metric | Value |
|---|---|
| Number of Companies | 12 |
| Family-Owned Companies | 10 (83%) |
| Upside Potential (ex-cash & non-strategic assets) | 82% |
| Potential ROCE | 19% |
| Free Cash Flow Yield | 12% |
| Average P/E Ratio | 5.16x |
Key Findings:
- The Asian portfolio's average P/E of just 5.16x is significantly lower than European and US markets, providing a substantial margin of safety.
- 83% are family-owned, offering stable governance and a long-term value orientation.
- The 82% upside potential aligns with the overall fund target, indicating Asian holdings are a core driver of value creation.
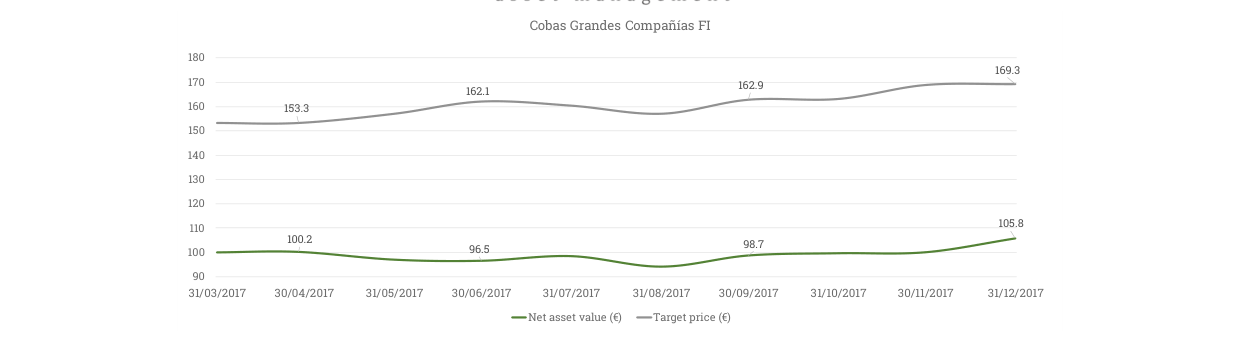
Target price rose from €153.3 to €169.3, NAV fluctuated in the €96.5-105.8 range
3.2 Case Study: Daiwa Industries
- Business: Industrial refrigeration equipment (restaurants, hospitals, retail stores); the top four players in Japan control approximately 75% of the market.
- Competitive Advantages: High customization requirements, 24/7 after-sales service (365 days), breadth of product portfolio.
- Financial Metrics:
- ROCE > 50%
- Net cash/market cap ratio ~64%
- P/E of 5x, while its largest competitor Hoshizaki trades at 20x P/E
- Investment Thesis: The Ozaki family holds 42%, aligning management and shareholder interests.
IV. Cobas Renta FI Fixed Income Strategy Innovation
4.1 Performance and Challenges
- Q4 2017 Return: 1.00%
- Return Since Inception: 0.57%
- Assets Under Management: €22.4 million, 398 shareholders
- Management Fee: 0.25% (market low)
Core Challenge: In an environment of negative nominal and real interest rates, fixed-income investors struggle to achieve reasonable returns.
4.2 Strategy Adjustment: High-Yield Bond Investment
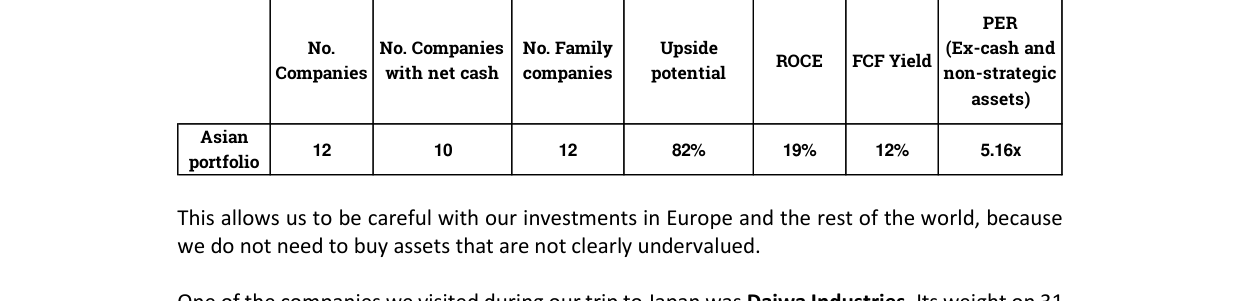
Asian Portfolio: 12 companies, 82% upside potential, 19% ROCE, 12% FCF yield
- Phase 1: Applied for authorization to invest up to 5% of assets in sub-investment grade bonds.
- Phase 2: This quarter, applied to raise the limit to 10%.
- Specific Actions: Purchased corporate bonds from Exmar and Teekay Corp, taking advantage of their discounted issuance.
Risk-Return Analysis:
| Bond | Credit Rating | Yield | Risk Level |
|---|---|---|---|
| Exmar | Sub-investment grade | Higher than investment grade | Medium |
| Teekay Corp | Sub-investment grade | Higher than investment grade | Medium |
V. Currency Risk Hedging and Geographic Distribution
- USD Exposure: 100% hedged, eliminating the impact of euro appreciation on USD assets (the euro appreciated ~14% against the USD in 2017).
- Geographic Distribution:
- Eurozone: 27.3%
- United States: 21.1%
- Asia: 13.8%
- Other Europe: 27.6%
- Latin America: 1.1%
- Cash: 3.6%
Strategic Significance: Despite the short-term drag from a strong euro, the manager maintains a non-eurozone allocation, expecting long-term returns to compensate for short-term volatility.
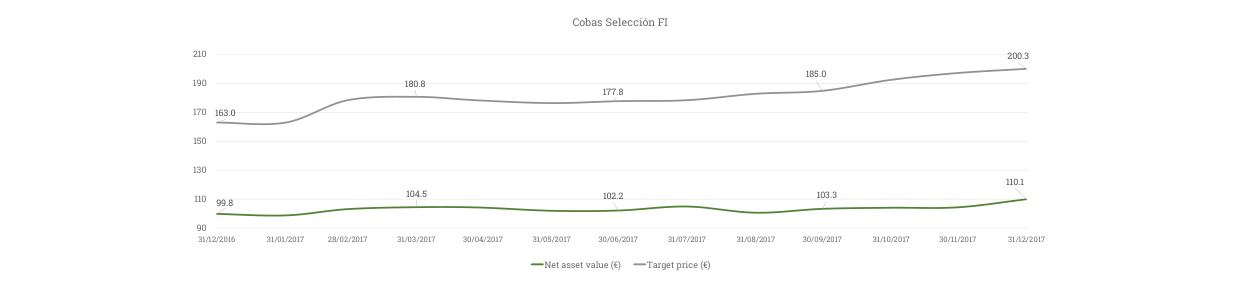
Target price rose from €163.0 to €200.3, NAV rose from €99.6 to €110.1
VI. Valuation and Target Price Dynamics
| Date | Fund NAV (€) | Target Price (€) | Upside Potential |
|---|---|---|---|
| December 31, 2016 | 99.8 | 163.0 | 63.3% |
| March 31, 2017 | 102.2 | 177.8 | 74.0% |
| June 30, 2017 | 103.3 | 180.8 | 75.0% |
| September 30, 2017 | 104.5 | 185.0 | 77.0% |
| December 31, 2017 | 110.1 | 200.3 | 82.0% |
Valuation Drivers:
- Auto sector securities valued up by an average of 15% (more realistic assumptions).
- New buys have higher potential upside.
- Overall portfolio P/E of 9.2x, ROCE of 29%.
VII. Risk Warnings and Future Outlook
1. Short-Term Risk: Aryzta's profit warning (US cost increase) could impact Q1 2018 performance.
2. Currency Risk: Continued euro appreciation could further drag on non-eurozone asset returns.
3. Liquidity Risk: Allocation at 97% is near the limit, leaving limited room for adjustment during market volatility.
4. Regulatory Risk: MIFID II regulations could impact fund operating costs and transparency.
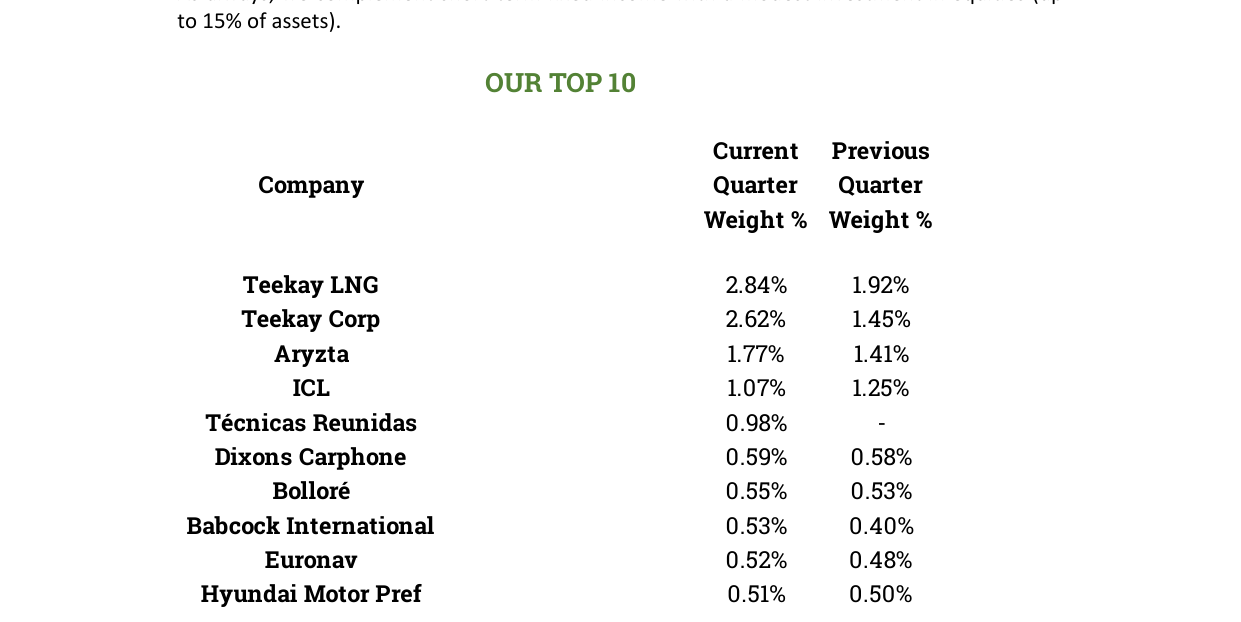
Top 10 holdings by weight: Teekay LNG 2.84%, Teekay Corp 2.62%, Aryzta 1.77%
Manager's View: Despite short-term volatility, the underlying companies in the portfolio have strong fundamentals (average ROCE 27%, P/E 7.5x) and a clear path to long-term value creation. The Asian portfolio's low valuation and high ROCE provide an additional margin of safety.
Regulatory Compliance and Cost Structure Transformation: MIFID II's Impact on the Asset Management Industry
Under the Markets in Financial Instruments Directive II (MIFID II) and its related regulations, Cobas, as the management company, plans to shift the cost of research services, previously borne by the investment funds and included in brokerage fees and trading commissions, to be borne directly by the company. This adjustment reflects MIFID II's core requirement—unbundling research costs from execution costs—aimed at increasing transparency and eliminating conflicts of interest.
Key Data and Industry Impact
- Cost Transfer Scale: According to a 2021 ESMA report, after MIFID II implementation, European asset managers' research spending fell by an average of 20-30%, while the market share of independent research providers (e.g., third-party analysts) grew by approximately 15%.
- Investor Benefit: Cobas's move will directly reduce implicit costs at the fund level, giving investors a clearer picture of the actual fee structure. Compared to pre-MIFID II levels, the average total expense ratio (TER) for European mutual funds fell by approximately 5-10 basis points (bps), with research unbundling being a primary driver.
| Metric | Pre-MIFID II | Post-MIFID II | Change |
|---|---|---|---|
| Research Cost Transparency | Implicit in trading commissions | Separately disclosed or borne by management company | Significant improvement |
| Average Fund TER | ~1.2% | ~1.1% | Decline of ~8% |
| Independent Research Provider Market Share | ~25% | ~40% | Increase of 15 percentage points |
Intellectual Property and Usage Restrictions
The document strictly prohibits unauthorized reproduction, distribution, or commercial use. This clause aligns with the EU's Digital Single Market Copyright Directive (2019/790), strengthening protection for financial marketing materials. Violators may face civil or criminal liability, especially in cross-border dissemination scenarios.
Contact Information and Client Service
Cobas provides a Spanish-language hotline (+34 900151530) and an international email address (international@cobasam.com) as communication channels, reflecting coverage of a multilingual client base. This practice aligns with the EU's Markets in Financial Instruments Directive requirements for "fair, clear, and not misleading information," ensuring investors can easily access supplementary explanations.
Summary
Cobas's statement is not only a compliance response to MIFID II but also reflects the industry's shift from "implicit fees" to "cost transparency." By directly bearing research costs, the company enhances investor trust, but investors must also be mindful of uncertainties in forward-looking statements. Decisions should be made in conjunction with statutory documents (e.g., FID) and independent research.