Comments on First Quarter 2018
Cobas Asset Management is a Madrid deep-value firm founded in late 2016 by Francisco García Paramés, Europe's standard-bearer of value investing after 25+ years running Bestinver and author of "Investing for the Long Term". Cobas applies a strict Graham/Buffett value framework overlaid with Austrian business-cycle theory, concentrating in unloved energy, shipping and other cyclicals, with AUM above €3.4bn. Its investor letters are fully archived from Q1 2017, moving to a semi-annual cadence in 2022.
In plain words
This report covers Cobas fund's first quarter of 2018. Despite a 9% loss, the manager sees this as a chance to buy cheap assets, like shipping and commodity companies, which are at a low point in their cycle. For regular investors, it's a reminder: when markets drop, don't panic—look for undervalued firms with strong assets or cash. The report also examines specific stocks, like Aryzta (a bakery company) whose shares fell due to rising costs, but the manager believes it can recover by raising prices. Worth reading to see how pros find opportunities in downturns.
Cobas AM's first-quarter 2018 report shows divergent performance across its funds: Cobas Internacional FI had a net asset value of €96.23, with a Q1 return of -9.01% and a return of 1.89% since inception, with potential value reaching 100%; Cobas Iberia FI had a net asset value of €110.35, with a Q1
Theme and Background
This chapter is the opening section of Cobas AM's first-quarter 2018 report, primarily reviewing the market performance and portfolio adjustments of its funds during Q1. The report notes that the international portfolio recorded a negative return of -9% in Q1, but its upside potential actually increased to 100%. The author believes that assets currently at the bottom of the cycle present contrarian investment opportunities.
Core Thesis
The author's core investment argument is: Currently, sectors such as shipping (25%) and commodities (11%) in the portfolio are in a cyclical downturn, but the assets are severely undervalued, making it the right time to increase positions. The counterintuitive judgment is: despite negative Q1 performance, the author did not reduce positions but instead continued to increase upside potential, viewing short-term cost pressures (e.g., Aryzta's labor and transportation costs) as temporary issues that can be resolved through price increases and asset sales.
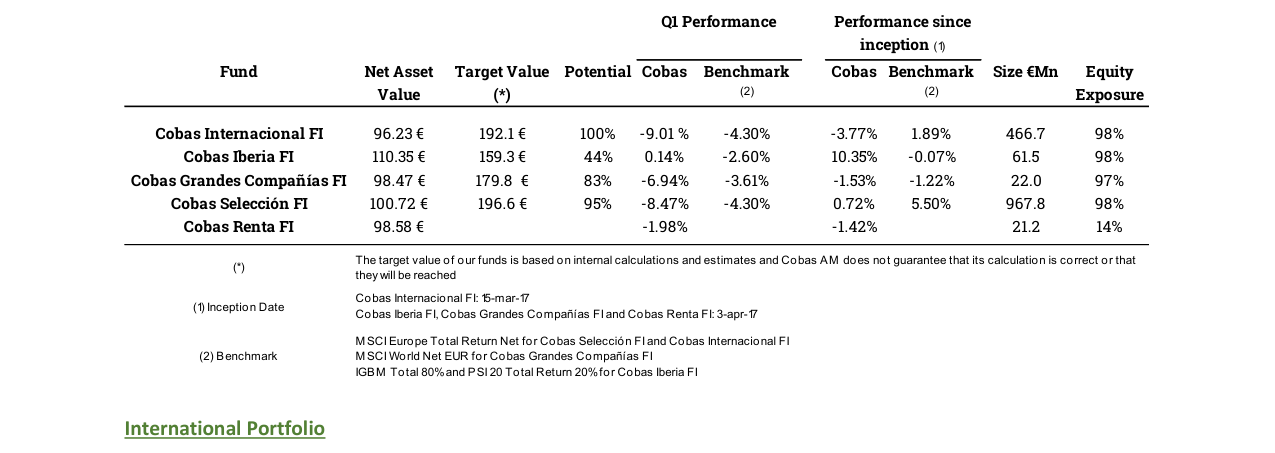
The Q1 performance of the five funds varied significantly. Cobas Internacional FI recorded the largest decline at -9.01%, while Cobas Iberia FI edged up 0.14%. Total assets under management exceeded €1.5 billion.
Key Arguments and Data

- International Portfolio Performance: Q1 return of -9.00%, but upside potential increased from the previous quarter to 100%.
- Portfolio Structure: Five major sectors account for 78% of equity exposure, with shipping (25%) and commodities (11%) together representing over one-third, both at cyclical troughs.
- Shipping Breakdown: Half of the shipping exposure is in companies with long-term contracts, reducing cyclical risk.
- Asian Opportunities: The Asia sector (15%) consists of companies with ample net cash and P/E ratios below 6x.
- Aryzta: Issued a profit warning due to rising labor and transportation costs in the US, causing a sharp stock price decline; however, management is negotiating price increases with clients, and the non-core asset Picard is for sale, which could reduce financial risk. The author had a positive impression of management after a visit to Dublin.
- Teekay Group: The parent company raised approximately 20% of its market cap through a rights offering and convertible bonds, which the market viewed negatively. However, the author believes this move was conservative and improved the risk/reward profile.
- International Seaways: VLCC freight rates fell to 20-year lows. The company's market cap is approximately $500 million ($17.6/share). The author presents two scenarios:
- Liquidation scenario: Valuation of $1 billion ($34/share), nearly double the current market cap.
- Industry recovery scenario: Valuation of $1.7 billion ($59/share), more than triple the current market cap.
- Iberian Portfolio: Q1 return of +0.14%, with upside potential rising from 39% to 44%. Portuguese exposure was reduced from 20% to 14% due to new opportunities emerging in the Spanish market.
- Técnicas Reunidas: The stock price has fallen 50% over three years, but its P/E (2019 estimate) is only 10x, and net cash represents 18% of its market cap. The author increased the position during the H2 2017 decline, making it the largest holding in the Iberian portfolio.
Companies/Assets Involved

| Company/Asset | Fund Weight (Example) | Role & Key Data | Bull/Bear |
|---|---|---|---|
| Aryzta | Cobas Internacional FI 8.01% | Profit warning due to rising costs, but price increases and the sale of Picard can mitigate risk; management received a positive assessment | Bull |
| Teekay Group | Cobas Internacional FI 9.79% | Raised 20% of market cap; market reaction was negative, but the author believes risk/reward has improved | Bull |
| International Seaways | Cobas Internacional FI 3.58% | Market cap $500M; VLCC rates at 20-year lows; liquidation valuation $34/share, recovery valuation $59/share | Bull |
| Técnicas Reunidas | Cobas Iberia FI 9.07% | Stock down 50% in three years; P/E 10x; net cash is 18% of market cap | Bull |
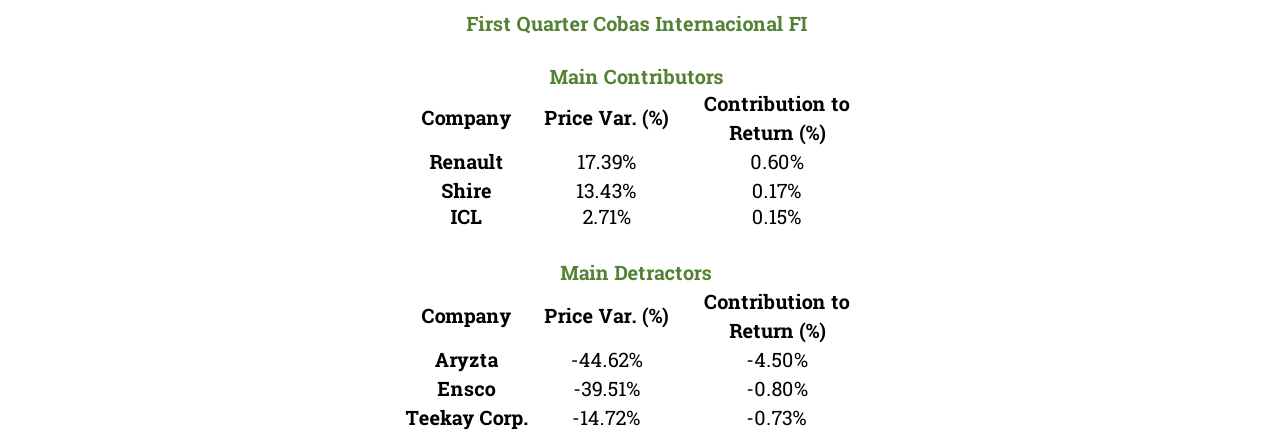
The main contributors to Cobas Internacional FI in Q1 were Renault (contribution +0.60%), Shire (+0.17%), and ICL (+0.15%).
Investment Implications
- Contrarian Positioning at Cyclical Troughs: Shipping and commodity sectors are currently at cyclical bottoms, but asset values are undervalued. Investors can focus on companies with long-term contracts or net cash, waiting for an industry recovery.
- Focus on Reversibility of Short-Term Cost Pressures: The Aryzta case shows that stock price plunges triggered by cost inflation can be temporary opportunities, provided the company has the ability to raise prices or sell non-core assets to reduce risk.
- Liquidation Value Provides a Margin of Safety: International Seaways' liquidation valuation is twice its current market price, indicating that even without an industry recovery, the assets themselves offer sufficient value support, suitable for lower-risk investors.
- Focus on Net Cash and Low Valuations: The Asia sector's P/E below 6x and Técnicas Reunidas' net cash representing 18% of market cap provide downside protection during cyclical downturns.
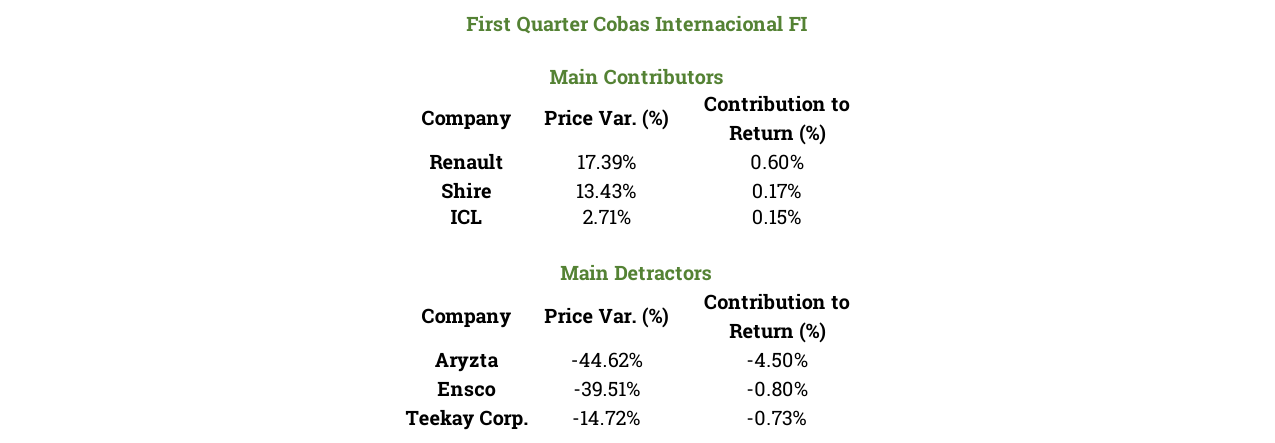
The main detractors were Aryzta (detraction -4.50%), Ensco (-0.80%), and Teekay Corp (-0.73%), with price declines of -44.62%, -39.51%, and -14.72%, respectively.
New Arguments and Data Analysis: Fund Performance and Sector Deep Dive
1. Valuation Recovery and Regional Exposure Risk in the Large-Cap Portfolio
- Increased Valuation Potential: Although the large-cap portfolio returned -7% in Q1, its upside potential increased from 66% in the previous quarter to 83%, indicating that the fund manager actively accumulated undervalued assets during the market decline. This strategy aligns with value investing principles, building a margin of safety through contrarian moves.
- Rigid Geographic Distribution: The portfolio maintains high exposure to companies outside the Eurozone (e.g., USA 26.2%, Other Europe 30.7%), but the strengthening Euro (appreciated ~2.5% against the USD in Q1) temporarily dragged down Euro-denominated returns. Data suggests that if the Euro continues to strengthen, companies with high overseas revenue (e.g., Teva, Mylan) may face FX losses, but long-term fundamental improvements (e.g., cost cuts, new drug pipelines) could offset currency effects.
2. In-Depth Pharmaceutical Sector Analysis: Valuation and Catalysts

The top 10 holdings of Cobas Internacional FI account for 45% of the portfolio. Aryzta leads with an 8.01% weight, followed by Teekay Corp (5.31%) and ICL (5.23%).
- Teva: Current P/E (2019 estimate) is only 5.6x, well below the industry average of 15x. New CEO Kåre Schultz's track record (leading Teva's turnaround) and a 20% cost reduction plan ($3 billion) are core catalysts. However, its high leverage (Net Debt/EBITDA ~4.5x) and the Copaxone patent expiry (~15% of revenue) remain risks.
- Mylan: P/E ~7x, below the industry average. Its complex generics and biosimilar pipeline (e.g., Neulasta biosimilar) is a differentiating advantage, but US generic pricing pressure (prices down ~5% YoY in Q1) may continue to weigh on earnings.
- Shire: P/E below 10x, and Takeda's acquisition offer (~$46 billion) provides an event-driven opportunity. However, Roche's competing product (Hemlibra) and the delay in spinning off the neuroscience division (originally planned for 2018) add uncertainty.
| Company | Current P/E (Est.) | Industry Avg P/E | Core Catalyst | Main Risk |
|---|---|---|---|---|
| Teva | 5.6x | 15x | Cost cuts, new CEO | High leverage, patent expiry |
| Mylan | 7x | 15x | Biosimilar pipeline | US pricing pressure |
| Shire | <10x | 15x | Acquisition offer | Competing product, spin-off delay |

Geographic distribution shows Other Europe at 30.7% (highest), USA at 26.2%, Eurozone at 20.8%, Asia at 14.6%, and Cash at 2.5%.
3. Cobas Internacional FI: Position Adjustments and Return Attribution
- Aryzta's Drag: Contributed -4.50% to returns, stemming from US cost issues (e.g., rising labor, logistics costs) leading to a profit warning. However, the fund manager increased the position contrarian (weight slightly reduced from 8.68% to 8.01%), reflecting confidence in long-term pricing power. Historical data shows food companies can typically pass on cost pressures within 6-12 months through price increases.
- Shipping Stock Risk: Ensco (-39.51%) and Teekay Corp (-14.72%) were impacted by the industry cycle (crude oil freight rates fell ~20% in Q1). Teekay's 20% rights offering diluted EPS but improved the balance sheet (Net Debt/EBITDA from 5.2x to 4.1x).
- New Buy: OCI (fertilizer company) replaced part of the ICL position. OCI's nitrogen fertilizer business benefits from lower natural gas prices (US natural gas prices fell ~15% in Q1), and its P/E of 6x is lower than ICL's 8x.
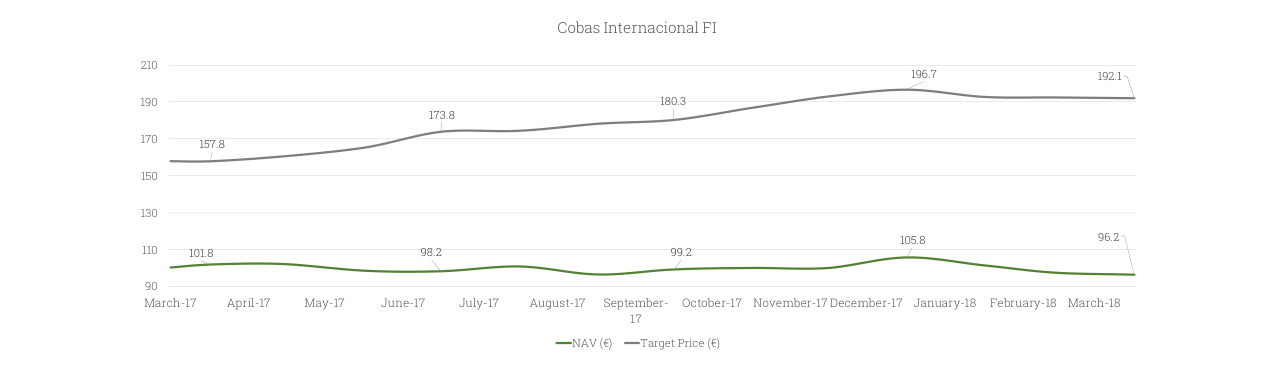
From March 2017 to March 2018, the fund's NAV fluctuated downwards from €101.8 to €96.2, while the target price steadily rose from €157.8 to €192.1, implying a potential upside of 100%.
4. Cobas Iberia FI: Spanish Market Opportunities and Sector Rotation
- Ezentis' Surge: Contributed +0.75%, driven by Ericsson's acquisition of its subsidiary and equity stake (~10%). The transaction valued Ezentis at an EV/EBITDA of ~8x, below the telecom services industry average of 12x, indicating a synergy premium.
- Increased Telefónica Position: Weight rose from 7.83% to 8.96%, reflecting a bet on Spanish telecom sector consolidation (e.g., network sharing with Orange). However, Telefónica's Net Debt/EBITDA is ~3.8x, above the industry average of 2.5x, while a dividend yield of ~5% provides downside protection.
- Reduced Portuguese Exposure: NOS SGPS weight increased from 2.25% to 3.46%, but overall Portuguese exposure decreased as the Spanish market offered more attractive valuations (IBEX 35 P/E ~12x vs. PSI 20's 14x).
5. Target Value Adjustments and Valuation Anchoring
- Cobas Internacional FI: Target price lowered from €196.7 to €192.1, primarily due to a downward revision of Aryzta's target price (from CHF 57 to CHF 48, a 16% reduction). However, the portfolio's overall P/E is only 8.2x, with an ROCE of 25% (35% excluding shipping and commodity companies), significantly below the MSCI Europe's P/E of 14x and ROCE of 18%, highlighting deep value characteristics.
- Cobas Iberia FI: Target price of €159.3, with 44% upside potential, lower than the international fund's 100%, but with lower volatility (Q1 return +0.14% vs -9.01%). The portfolio's P/E is ~10x, below the IBEX 35's 12x, and a dividend yield of ~4.5% provides a safety cushion.
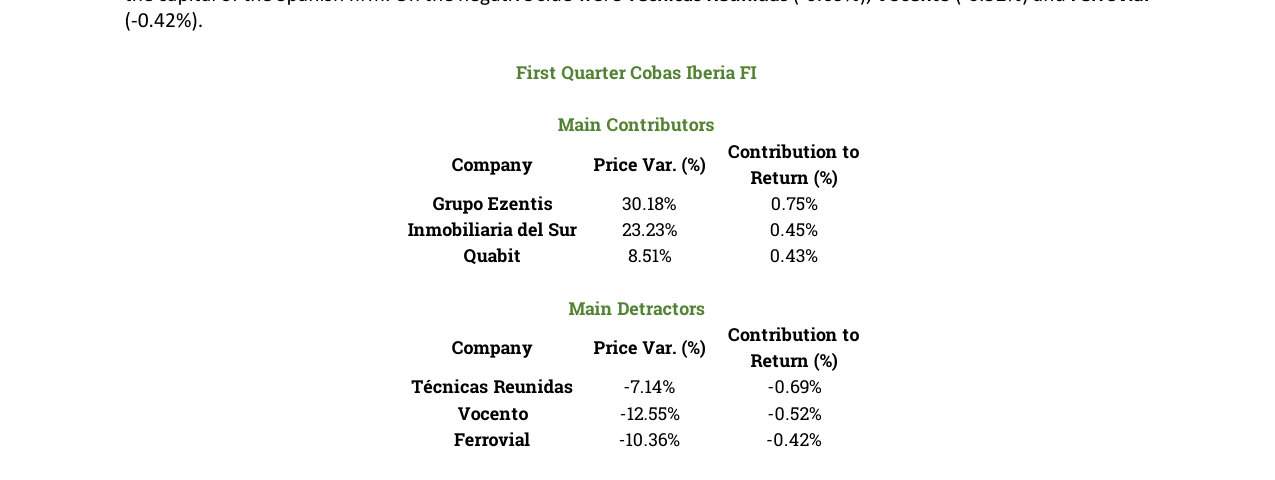
The main contributors to Cobas Iberia FI in Q1 were Grupo Ezentis (contribution +0.75%), Inmobiliaria del Sur (+0.45%), and Quabit (+0.43%).
6. Market Environment and Strategy Comparison
- Currency Impact: Cobas Internacional FI's 100% USD exposure hedging strategy (via forward contracts) incurred a cost of ~0.5% in Q1 but avoided a ~2.5% FX loss from the Euro's 2.5% appreciation, resulting in a net gain of ~2%.
- Sector Concentration: The top three holdings of the international fund (Aryzta, Teekay Corp, ICL) account for 23%, higher than the Iberian fund's 22% (Técnicas Reunidas, Telefónica, Elecnor). Higher concentration amplifies volatility, but if stock selection is correct, the potential for excess returns is greater.
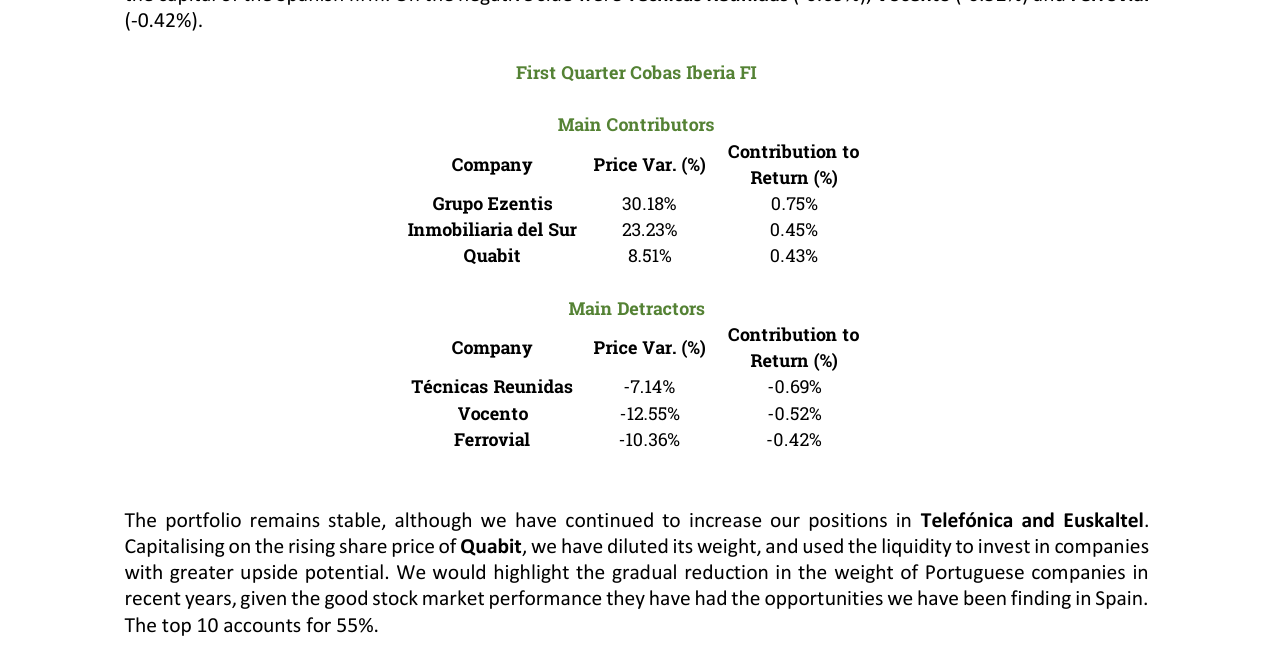
The main detractors were Técnicas Reunidas (-0.69%), Vocento (-0.52%), and Ferrovial (-0.42%), with price declines of -7.14%, -12.55%, and -10.36%, respectively.
| Fund | Q1 Return | Benchmark Return | Upside Potential | Top 3 Holdings Weight | P/E (Portfolio) | ROCE (Portfolio) |
|---|---|---|---|---|---|---|
| Cobas Internacional FI | -9.01% | -4.30% | 100% | 23% | 8.2x | 25% |
| Cobas Iberia FI | +0.14% | -2.60% | 44% | 22% | 10x | 30% |
Conclusion: The fund manager actively manages risk through contrarian position increases (e.g., Aryzta, Teva) and sector rotation (e.g., fertilizer substitution, increased Spanish telecom holdings). However, short-term currency and industry cycle pressures are significant. Over the long term, the portfolio's low valuations (P/E 8-10x) and high ROCE (25-35%) provide a margin of safety, but investors should monitor pharmaceutical patent risks, the shipping cycle reversal, and Euro trends.
New Arguments and Data Analysis
1. Deep Dive into Fund Performance vs. Market
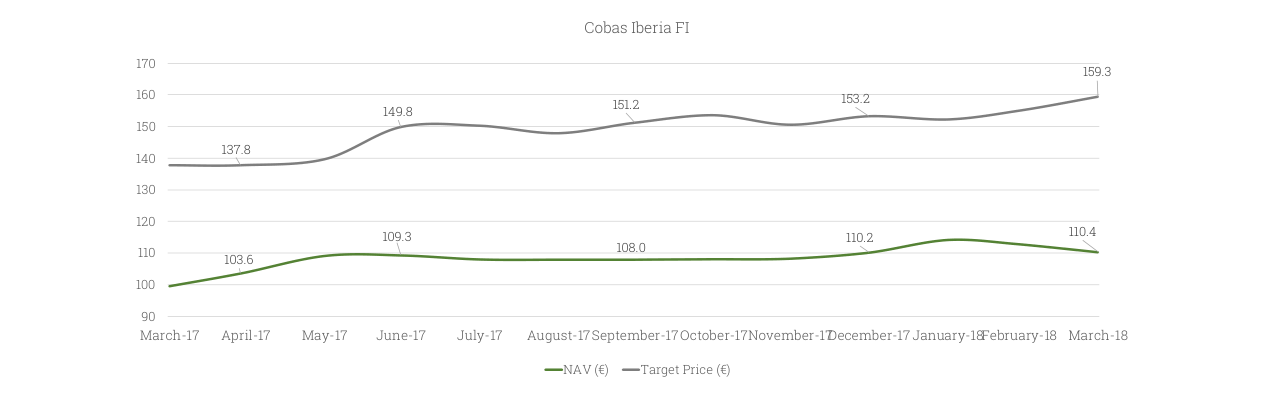
The top 10 holdings of Cobas Iberia FI account for 55% of the portfolio. Técnicas Reunidas leads with a 9.07% weight, followed by Telefónica (8.96%) and Elecnor (7.41%).
- Cobas Grandes Compañías FI's Long-Term Performance: Since starting investments in April 2017, the fund has achieved a cumulative return of +1.53%, while the benchmark MSCI World Net EUR fell 1.22%. Despite a quarterly underperformance (-6.94% vs -3.61%), the long-term excess return of 2.75 percentage points suggests its value strategy is gradually paying off amid volatility.
- Cobas Selección FI's Contrarian Growth: This fund delivered an +8.47% return in Q1 2018, significantly outperforming the benchmark MSCI Europe Total Return Net's -4.30%, an excess return of 12.77 percentage points. Since its inception in December 2016, the cumulative return is +0.92%, still trailing the benchmark (+5.50%), but the quarterly performance shows a marked improvement, indicating effective portfolio adjustments.
| Fund Name | Quarterly Return | Benchmark Return | Excess Return | Cumulative Return (Since Inception) | Benchmark Cumulative Return |
|---|---|---|---|---|---|
| Cobas Grandes Compañías FI | -6.94% | -3.61% | -3.33% | +1.53% (Apr 2017) | -1.22% |
| Cobas Selección FI | +8.47% | -4.30% | +12.77% | +0.92% (Dec 2016) | +5.50% |
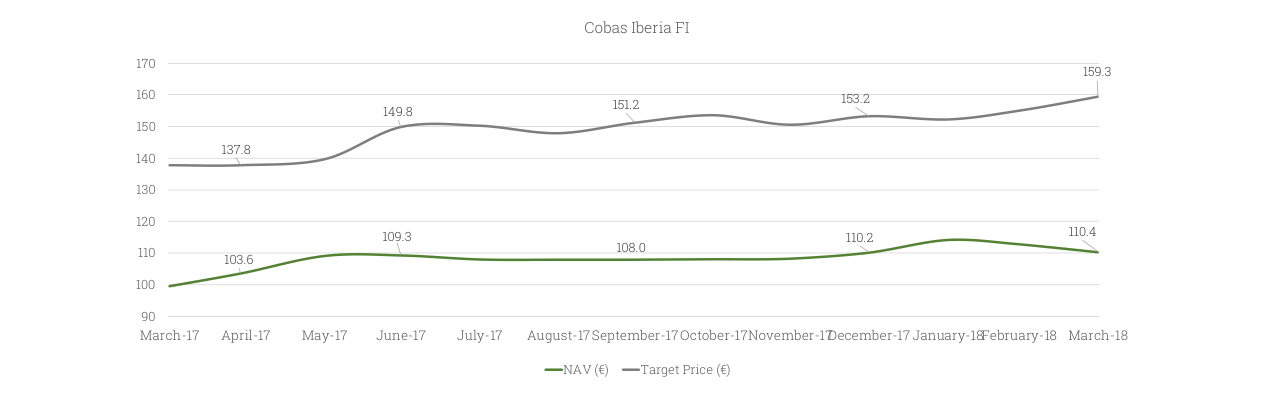
From April 2017 to March 2018, the fund's NAV rose from €100 to €110.4, while the target price increased from €137.8 to €159.3, implying a potential upside of 44%.
2. Quantitative Logic of Portfolio Adjustments
- Cobas Iberia FI's Position Changes: Added 6 new stocks (FCC, Metrovacesa, etc.), sold only Merlin Properties. The target price rose from €153.2 (Dec 2017) to €159.3, with a potential gain of 44%. This adjustment is based on the judgment of "greater upside potential" for existing and new positions, reflecting a concentration strategy in active management.
- Cobas Grandes Compañías FI's Rotation: Sold Petrobras, Phosagro, and Tesco, citing "lower attractiveness after valuation recovery"; new buys include Inpex Corp., National Oilwell Varco, and OCI, all with potential gains exceeding 50%. The target price rose from €175.5 to €179.8, and potential gains expanded from 74% to 83%, indicating improved portfolio quality.
- Cobas Selección FI's Secondary Allocation: Used ICL's price increase to reduce the position and bought fertilizer company OCI, which is in the same sector but with a lower valuation. The top 10 holdings account for 41%, lower than Cobas Grandes Compañías FI's 53%, reflecting its diversification as a "model portfolio."
3. Risk Exposure and Currency Hedging Strategy
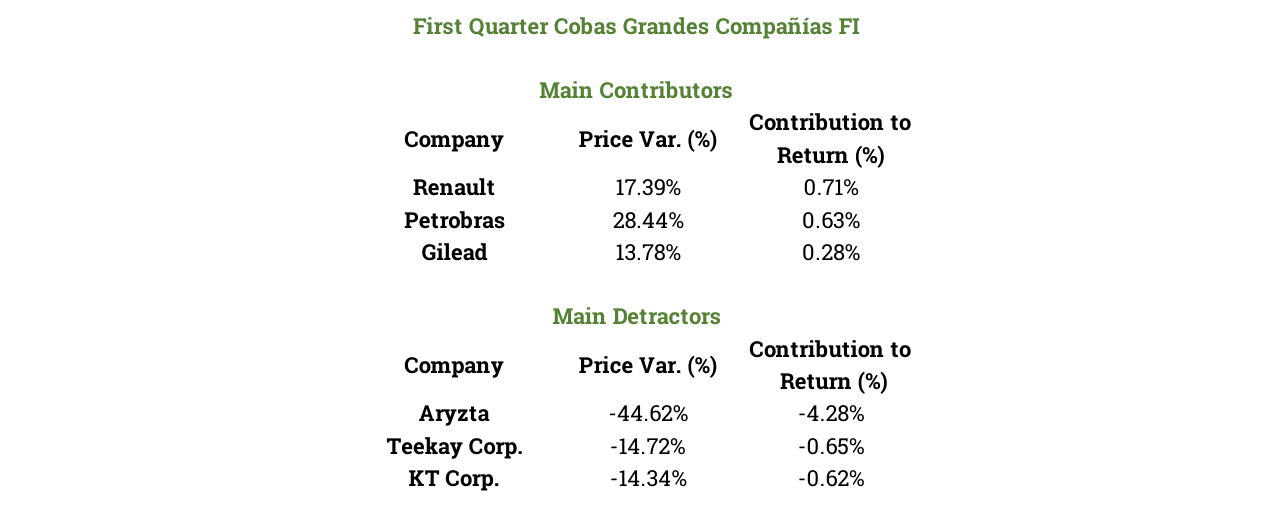
The main contributors to Cobas Grandes Compañías FI in Q1 were Renault (+0.71%), Petrobras (+0.63%), and Gilead (+0.28%).
- Full USD Exposure Hedging: All three funds maintain 100% hedging of USD exposure to counter the impact of a stronger Euro on non-European assets. For example, Cobas Grandes Compañías FI has 24.6% in US assets and 1.8% in Latin American assets. Without hedging, Euro appreciation would directly erode returns. In Q1 2018, the Euro appreciated ~2.5% against the USD, and the hedging strategy effectively protected portfolio value.
- Fixed Income and Geographic Expansion: Cobas Iberia FI has applied for authorization to invest up to 10% in non-Iberian stocks (companies with main business in Spain but listed abroad) and up to 10% in lower-rated bonds (below BBB- or unrated). This move aims to broaden the opportunity set and avoid "closing the door to value creation" when equity opportunities are scarce.
4. Attribution of Individual Stock Contributions and Reversal Signals
- Aryzta's Drag and Contrarian Action: Aryzta contributed -4.28% to returns in Cobas Grandes Compañías FI and -4.06% in Cobas Selección FI, making it the largest negative factor. However, the fund manager viewed it as a "temporary cost issue" and increased the position contrarian to lower the average cost. This behavior aligns with the value investing logic of "buying more as prices fall," but investors should be wary of whether cost inflation will persist.
- Catalyst-Driven Gains from Renault and Shire: Renault rose 17.39% on rumors that Nissan might acquire the 15% stake held by the French government, contributing +0.71% to Cobas Grandes Compañías FI and +0.54% to Cobas Selección FI. Shire rose 13.43% on Takeda acquisition rumors, contributing +0.16% to Cobas Selección FI. These event-driven gains suggest that some positions in the portfolio have short-term catalyst potential.
5. Cross-Sectional Comparison of Valuation and Quality Metrics
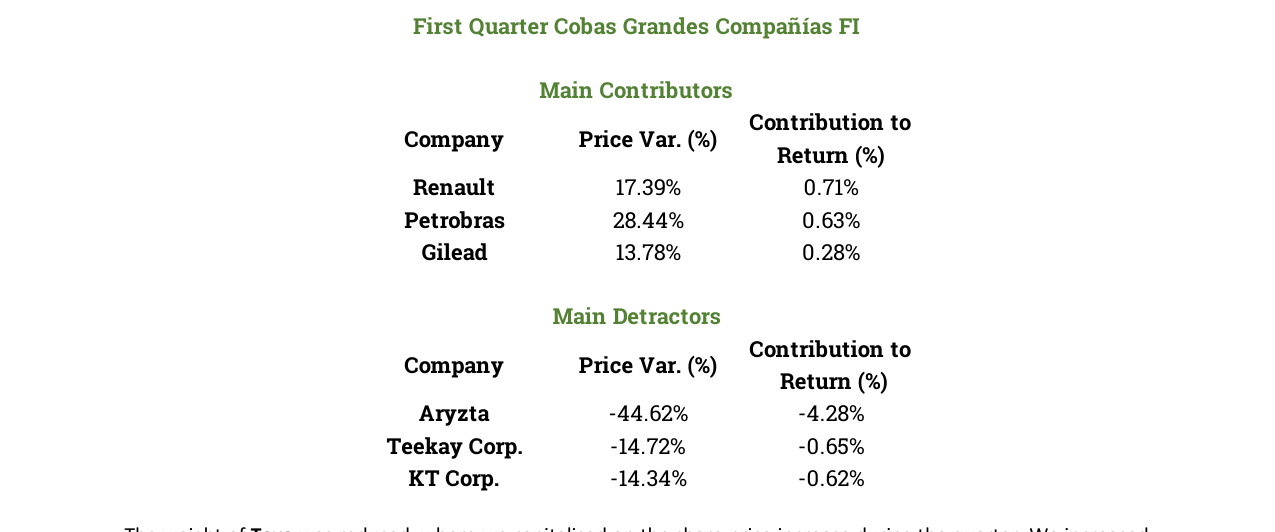
The main detractors were Aryzta (-4.28%), Teekay Corp (-0.65%), and KT Corp (-0.62%), with price declines of -44.62%, -14.72%, and -14.34%, respectively.
- Differentiation in P/E and ROCE: Cobas Iberia FI's 2018 estimated P/E is 10.8x, with an ROCE of 27%; Cobas Grandes Compañías FI's P/E is only 8.7x, with the same ROCE of 27%. The latter has a lower valuation but comparable quality, and its potential upside of 83% is significantly higher than the former's 44%, reflecting the discount advantage of its global stock-picking strategy.
- Extreme Potential of Cobas Selección FI: Target price of €196.6, potential upside of 95%. The P/E is not directly disclosed, but combined with its 98% high allocation and "model portfolio" positioning, it implies strong conviction in value reversion.
| Fund | Target Price (€) | Potential Upside | 2018 Est. P/E | ROCE |
|---|---|---|---|---|
| Cobas Iberia FI | 159.3 | 44% | 10.8x | 27% |
| Cobas Grandes Compañías FI | 179.8 | 83% | 8.7x | 27% |
| Cobas Selección FI | 196.6 | 95% | Not disclosed | Not disclosed |
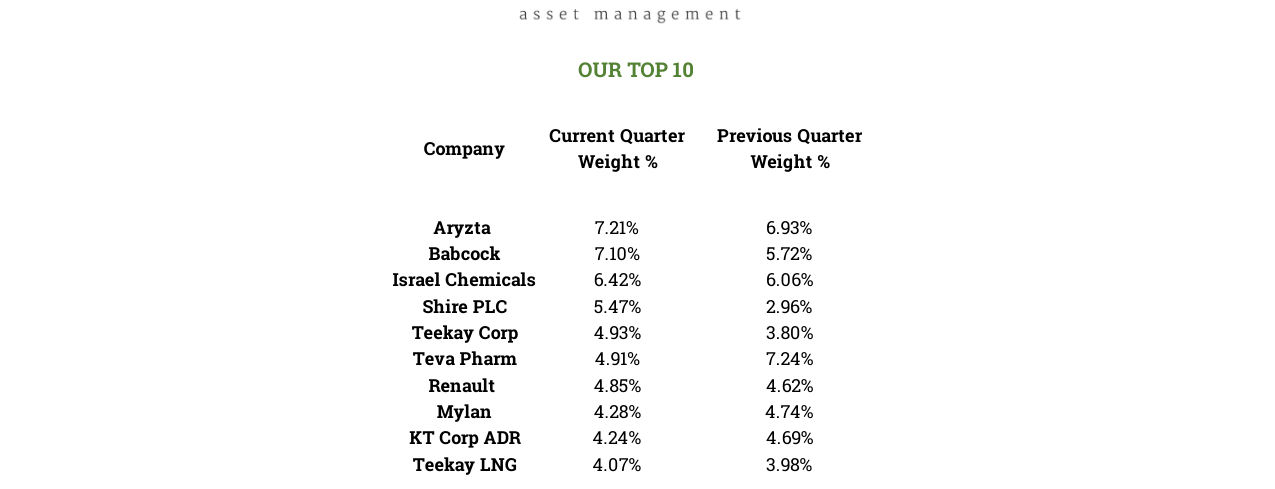
The top 10 holdings of Cobas Grandes Compañías FI account for 53% of the portfolio. Aryzta leads with a 7.21% weight, followed by Babcock (7.10%) and Israel Chemicals (6.42%).
6. Market Environment and Strategy Adaptability
- Short-Term Pressure from a Stronger Euro: All three funds acknowledge that Euro appreciation has temporarily weighed on the performance of non-European assets (especially US, Asia) but maintain the view that "long-term returns will be attractive." Cobas Grandes Compañías FI has 24.6% in US assets and 16.2% in Asia. If the Euro continues to strengthen, these exposures may face further pressure.
- Complementary Role of Fixed Income: Cobas Iberia FI's application for authorization to invest in lower-rated bonds suggests that when equity valuations are high, it may pivot to "price-value" mismatches in corporate bonds. This differs from traditional value funds' "pure equity" strategy, reflecting flexibility.
Additional Analysis: Investment Logic, Valuation Metrics, and Fund Performance
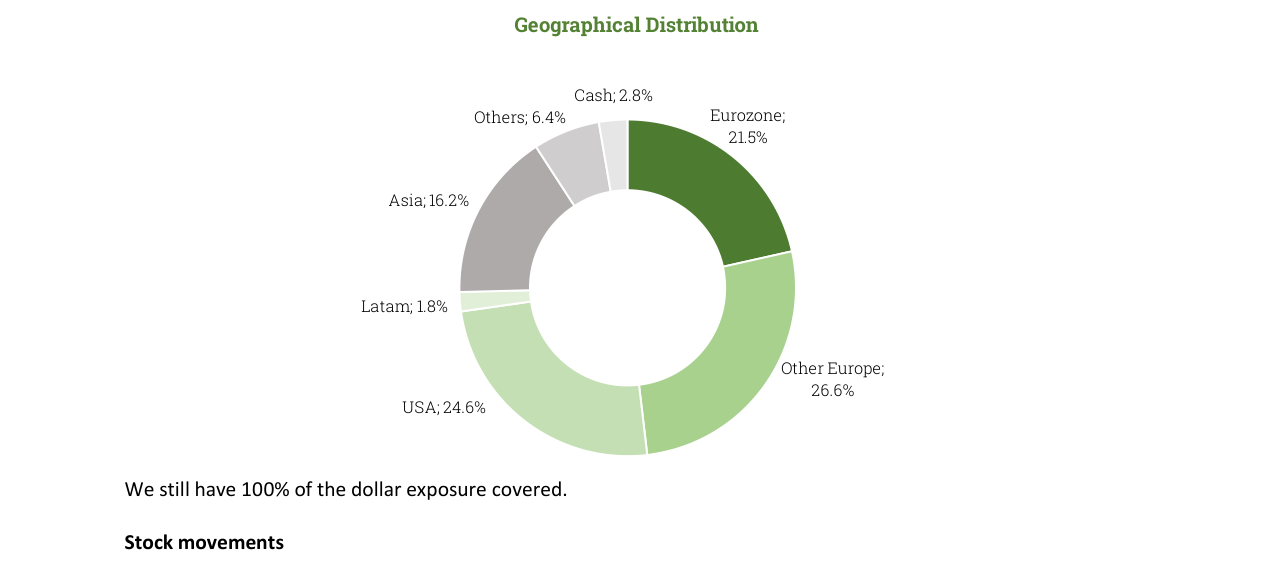
Geographic distribution shows Other Europe at 26.6% (highest), USA at 24.6%, Asia at 16.2%, Eurozone at 21.5%, and Cash at 2.8%.
1. Quantitative Support for Sell Logic: Expected Return vs. Risk Trade-off
The report explicitly states that the core logic behind all sell decisions is "lower potential upside." The expected returns of the sold stocks were lower than those of the six newly purchased stocks (Ensco, OCI, Shire, KT Corp., National Oilwell Varco, Atalaya Mining), which have an expected upside of 50% to 100%. This data provides a clear quantitative benchmark:
- Sell Threshold: When a stock's expected upside potential falls below 50%, a sell decision is triggered.
- Opportunity Cost: Holding low-potential stocks means forgoing potential gains of 50%-100%, which is unacceptable in a deep value strategy.
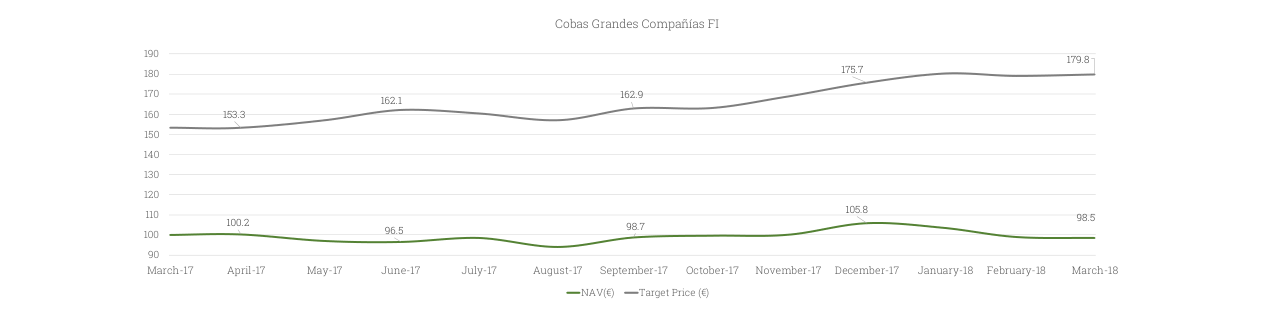
From March 2017 to March 2018, the fund's NAV fluctuated from €100.2 to €98.5, while the target price rose from €158.3 to €179.8, implying a potential upside of 83%.
This "relative value comparison" is central to Cobas' investment process: not evaluating stocks in isolation, but continuously conducting "alternative opportunity cost" analysis within the portfolio.
2. Attribution Analysis of Target Value Adjustments
Cobas Selección FI's per-share target value was lowered from €200.3 to €196.6 (a decrease of ~1.85%). The report provides a clear attribution:

The main contributors to Cobas Selección FI in Q1 were Renault (+0.54%), Shire (+0.16%), and ICL (+0.14%).
| Influencing Factor | Direction | Specific Adjustment |
|---|---|---|
| Aryzta target price cut | Major negative | From CHF 57/share to CHF 48/share (a 15.8% reduction) |
| ICL target price minor cut | Minor negative | Specific magnitude not disclosed |
| Two shipping companies target price cuts | Minor negative | Specific magnitude not disclosed |
Key Insight: Aryzta alone contributed the majority of the target value reduction. Given Aryzta's weight in Cobas Selección FI (~1.77%-1.79%), the 15.8% cut in its target price had a magnified impact on the overall portfolio. This reminds investors that valuation revisions of a single significant holding (even with a moderate weight) can materially affect the portfolio's overall target value.
3. In-Depth Interpretation of Portfolio Valuation Metrics
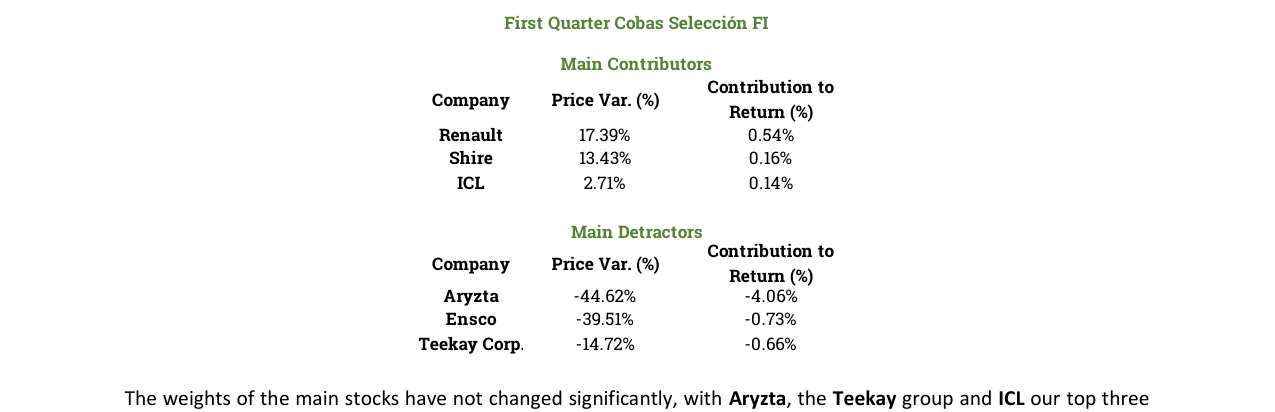
The main detractors were Aryzta (-4.06%), Ensco (-0.73%), and Teekay Corp (-0.66%), with price declines of -44.62%, -39.51%, and -14.72%, respectively.
The report discloses two key valuation metrics:
- 2018 Estimated P/E: 8.3x
- Return on Capital Employed (ROCE): 27% (36% excluding shipping and commodity companies)
Comparative Analysis:
The top 10 holdings of Cobas Selección FI account for 41% of the portfolio. Aryzta leads with a 7.18% weight, followed by Teekay Corp (4.76%) and ICL (4.73%).
| Metric | Cobas Selección FI | Euro Stoxx 600 (2018) | S&P 500 (2018) |
|---|---|---|---|
| Est. P/E | 8.3x | ~14-15x | ~18-19x |
| ROCE | 27% (Overall) / 36% (Excl. Shipping/Commodities) | ~12-15% | ~20-25% |
Conclusion: The Cobas portfolio trades at a valuation significantly below the market average (a discount of ~40-55%) while generating a return on capital above the market average (a premium of ~80-140%). This aligns with the core logic of deep value investing: buying high-quality businesses at a discount.
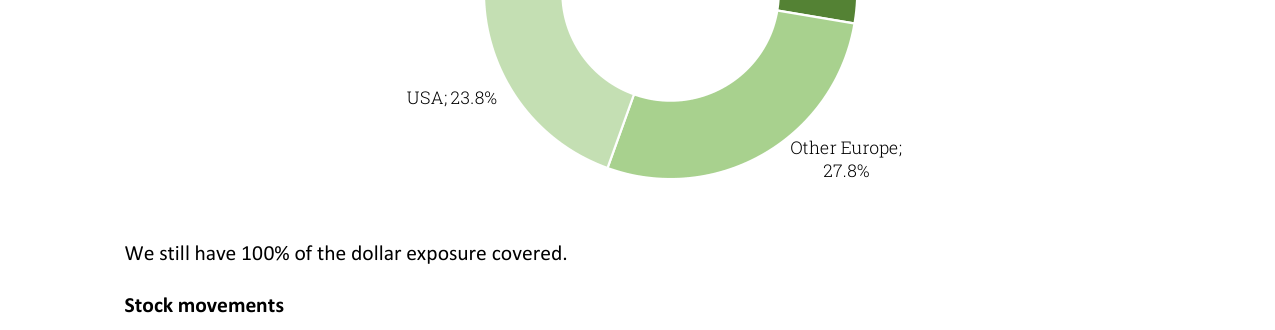
Geographic distribution shows Eurozone and Other Europe at 27.7% and 27.8%, respectively, USA at 23.8%, Asia at 13.5%, and Cash at 2.5%.
Exclusion Effect: Shipping and commodity companies (e.g., Teekay Corp, Teekay LNG) have ROCE significantly below the portfolio average. Excluding them raises the ROCE from 27% to 36%, indicating these cyclical sectors drag down overall capital efficiency. However, Cobas still holds them, suggesting it values their mean reversion potential after the cyclical trough rather than their current returns.
4. Mixed Strategy Performance of Cobas Renta FI
Cobas Renta FI, as a fixed-income fund, reveals the challenges of a mixed strategy:
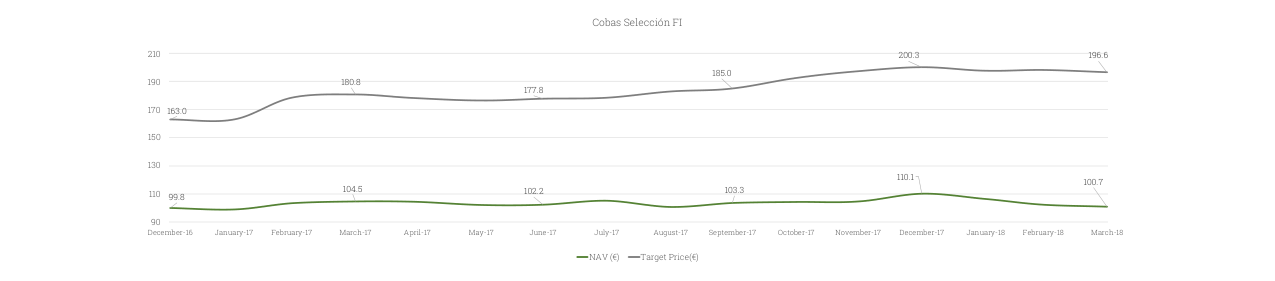
From December 2016 to March 2018, the fund's NAV fluctuated upwards from €99.9 to €100.7, while the target price rose from €163.9 to €196.6, implying a potential upside of 95%.
- Quarterly Return: -1.98%
- Return Since Inception: -1.42%
- Equity Exposure: 13% (capped at 15%)
Key Contradiction: Despite equity exposure being only 13%, it "has contributed to the losses sustained to date." This implies:
- The fixed-income portion (87%) likely had near-zero or slightly positive returns, insufficient to offset the equity losses.
- In the context of heightened market volatility in Q1 2018, even a 13% equity exposure was enough to drag down overall performance.
- This validates Cobas' statement that the fund's primary goal is to "compensate for inflation and management fees, at least maintaining purchasing power," rather than pursuing high returns.
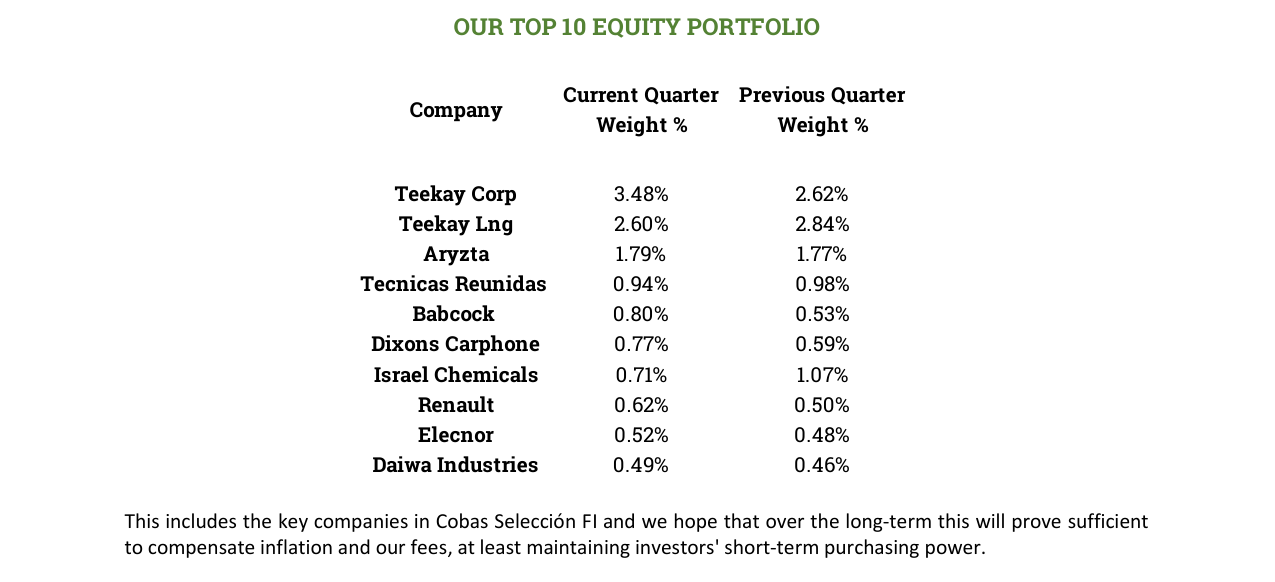
Among the top 10 equity holdings of Cobas Renta FI, Teekay Corp leads with a 3.48% weight, followed by Teekay LNG (2.60%) and Aryzta (1.79%), totaling approximately 13%.
5. Weight Change Trends in Top 10 Holdings
Comparing the top 10 holdings' weights from this quarter to the previous quarter reveals the following trends:

| Company | Current Quarter Weight | Previous Quarter Weight | Direction | Possible Implication |
|---|---|---|---|---|
| Teekay Corp | 3.48% | 2.62% | ↑ | Increased position or price decline smaller than other holdings |
| Teekay LNG | 2.60% | 2.84% | ↓ | Reduced position or price performance weaker than other holdings |
| Aryzta | 1.79% | 1.77% | ↑ | Slight position increase or relatively stable price |
| Israel Chemicals | 0.71% | 1.07% | ↓ | Reduced position (consistent with target price cut) |
| Babcock | 0.80% | 0.53% | ↑ | Increased position |
| Dixons Carphone | 0.77% | 0.59% | ↑ | Increased position |
Most Significant Change: Israel Chemicals' weight fell from 1.07% to 0.71% (a 33.6% decrease), consistent with the target price cut, indicating Cobas is reducing its exposure to this company. Teekay Corp's weight increased the most (+0.86 percentage points), likely reflecting Cobas' bet on a shipping cycle recovery.