Comments on Third Quarter 2017
Cobas Asset Management is a Madrid deep-value firm founded in late 2016 by Francisco García Paramés, Europe's standard-bearer of value investing after 25+ years running Bestinver and author of "Investing for the Long Term". Cobas applies a strict Graham/Buffett value framework overlaid with Austrian business-cycle theory, concentrating in unloved energy, shipping and other cyclicals, with AUM above €3.4bn. Its investor letters are fully archived from Q1 2017, moving to a semi-annual cadence in 2022.
In plain words
This report explains how Cobas fund invested in Q3 2017. The fund bought many non-European stocks (like Samsung and Israel Chemicals) because European quality companies were too expensive. Although the euro's strength hurt short-term returns (quarterly return was only 1.13% vs. a 2.70% benchmark), the manager believes currencies will self-correct over time. The portfolio's potential upside is over 80%, with new holdings like Porsche and Catcher Technologies expected to rise 50-100%. Worth reading because it shows how to buy good companies on bad news (e.g., Técnicas Reunidas dropped 21% after losing contracts) and why commodity/shipping stocks can hedge currency risks.
Cobas’ Q3 2017 report notes that due to difficulty finding attractively priced quality companies in Europe, the portfolio increased its allocation to non-European companies and commodities (such as shipping) to hedge against central bank monetary policy risks. The USD/EUR purchasing power parity (PP
Theme and Background
This chapter is the opening overview of Cobas Fund’s third-quarter 2017 report, primarily discussing portfolio allocation logic, currency impact, and fund performance. The market backdrop is that valuations of high-quality European companies are elevated, forcing the fund to increase allocations to non-European assets and commodities (such as shipping), while the euro’s strength has significantly weighed on euro-denominated returns.
Core View
The author’s core investment thesis is: the current portfolio’s potential upside has exceeded 80%, but short-term performance is masked by the euro’s strength. The author believes that stock selection itself has generated satisfactory returns, and the currency impact is temporary, with long-term self-correction. The counterintuitive judgment is that despite the euro’s strength hurting short-term performance, the fund maintains a 75% non-eurozone exposure and views commodity companies (such as shipping) as effective hedges against central bank monetary policies.
Key Arguments and Data
- Currency Impact: The dollar/euro purchasing power parity (PPP) is estimated at 1.25–1.30. Some dollar exposure was hedged from the start of the year, but currency effects reduced the Cobas Selección fund’s returns by -4.19% year-to-date (quarterly impact -0.98%).
- Performance Comparison: Cobas Selección posted a quarterly return of 1.13%, below the benchmark MSCI Europe Net Total Return of 2.70%; since December 31, 2016, the return is 3.54%, versus the benchmark’s 9.55%.
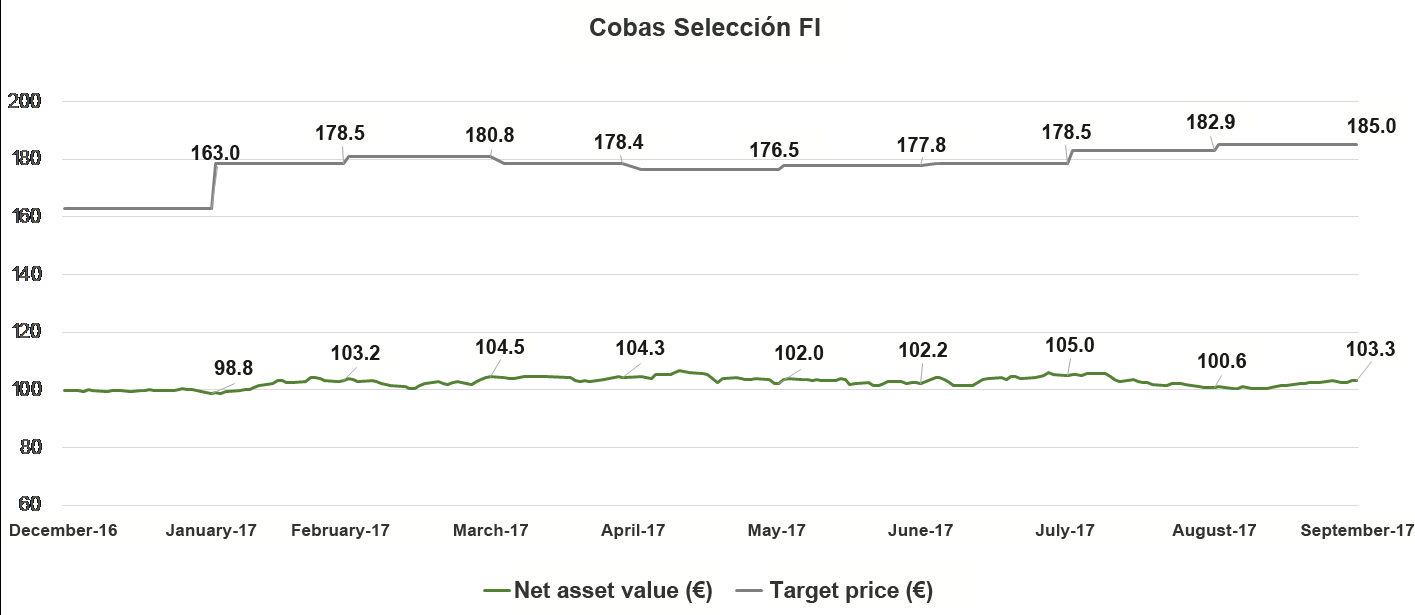
- Target Value: The fund’s target value rose from €177.8 per share to €185 per share, with potential upside increasing from 74% to over 80%.
- Position Adjustments: Among the top ten holdings, Aryzta (8.49%), Israel Chemicals (6.15%), and Teekay Corp (5.35%) are the top three, totaling about 25%. During the quarter, the fund sold Maire Technimont, Dassault Aviation, etc., and bought Porsche, Catcher Technologies, etc., with expected upside for new purchases ranging between 50% and 100%.
- Iberian Portfolio: After adjustments in the Spanish market, potential upside rose to 40%; the fund significantly increased its stake in Técnicas Reunidas (quarterly share price fell 21.02%) and participated in the Unicaja IPO.
Companies/Assets Involved
| Company/Asset | Role | Key Data | Bullish/Bearish |
|---|---|---|---|
| Aryzta | Largest holding | Weight 8.49% (previous quarter 8.19%) | Bullish: New management has halted performance deterioration; global leader |
| Teekay Group (including Teekay Corp and Teekay LNG) | Second-largest holding | Combined weight approx. 10.57% | Bullish: New LNG vessels entering operations; significant dividend increase expected in 2018/2019 |
| Israel Chemicals (ICL) | Third-largest holding | Weight 6.15% (previous quarter 6.55%) | Bullish |
| Samsung Electronics (Pref) | Target price raised | Weight 3.47% | Bullish: Strong performance across memory, mobile, and display; improved governance; ample cash |
| Técnicas Reunidas | Increased in Iberian portfolio | Quarterly share price fell 21.02% | Bullish: High-quality company; excessive decline due to loss of two contracts |
| Unicaja | IPO participation | No specific data | Bullish: Seller forced to sell; attractive assets and price |
| Porsche, Catcher Technologies, International Seaways, etc. | New purchases | Expected upside 50%–100% | Bullish |
| Maire Technimont, Dassault Aviation, OVS, etc. | Sold | Some realized significant upside | Bearish: Lower potential upside relative to new purchases |
Investment Insights
- Short-term currency risk must be tolerated: The euro’s strength has caused a -4.19% year-to-date drag on non-eurozone exposure, but the author believes currencies self-correct over the long term (referencing the 2002–03 experience); investors should not alter allocations due to short-term currency fluctuations.
- Focus on commodities and shipping: The fund increased allocations to capital-intensive commodities (e.g., shipping), viewing them as effective hedges against central bank policies, with potential to benefit from weak currency environments.
- Contrarian buying on negative news: Técnicas Reunidas saw a 21% share price drop after losing contracts, prompting the fund to significantly increase its stake; Unicaja’s IPO was entered due to a forced seller. This suggests investors should focus on high-quality companies overly punished by short-term negative events.
- Target price upside exceeds 80%: With a current NAV of €103.34 and a target price of €185, long-term return potential remains significant even after accounting for currency effects. Investors should monitor the realization pace of portfolio holdings (e.g., Teekay LNG’s dividend growth in 2018/2019).
Additional Analysis: Deep Dive into Portfolio Adjustments and Market Dynamics
1. Drivers of Target Value Increase: Positive Signals Beyond Individual Downgrades
Despite downward target price adjustments for Dixons and Hyundai Motor pref, the overall portfolio target value rose from €173.8 to €180.3 (a 3.7% increase). This apparent contradiction reveals the fund’s deeper strategy: dynamic rebalancing, using higher-potential new investments to offset negative adjustments in individual holdings.
- Dixons Case Dialectical Analysis: Although Carphone Warehouse’s profit warning led to a downward revision, the company’s core business (electronics sales in the UK and Nordics) continues to grow, with a current P/E of just 7.3x, far below the industry average (European retail average P/E ~15x). The fund manager slightly increased the position, reflecting a “contrarian value investing” mindset—using short-term negative news to buy quality assets at lower costs.
- Hyundai Motor pref Adjustment Industry Context: The core of the automotive sector valuation model adjustment lies in the reassessment of cash positions. Research shows that automakers need to retain more cash for electrification transitions (e.g., battery R&D, factory upgrades), limiting short-term shareholder benefits. This adjustment led to a particularly notable valuation cut for Hyundai, but its potential upside remains consistent with the fund’s overall level (about 80%), and it forms part of an industry portfolio alongside Renault, Porsche, and BMW.
2. Automotive Investment Logic: Systematic Rebuttal of Market Fears
Through detailed research, the fund manager offers strong rebuttals to three major market concerns about the automotive industry:
| Market Concern | Fund Manager View | Data Support |
|---|---|---|
| Cyclical downturn in US/Europe | Only 30% of global market; other markets can offset risks | Global auto sales ~110 million units/year (2022 forecast) |
| Threat from EVs (especially Tesla) | Even if Tesla succeeds (2 million units/year), market share is only 2% | Other automakers have announced electrification plans; competitive landscape is fragmented |
| Poor industry performance (last 3 years) | High asset quality, strong balance sheets, more market-oriented management | Industry average ROCE ~15%; fund holdings’ ROCE reaches 28% |
Key Conclusion: The market’s excessive focus on Tesla overlooks traditional automakers’ transformation capabilities and global market diversity. By investing in Renault, Porsche, BMW, and Hyundai, the fund constructs a “traditional automaker value recovery” theme portfolio.
3. Selection Logic for New Investments: IPO and Event-Driven Strategies
- Unicaja IPO: A rare IPO participation, with the core logic being that a “forced seller” mitigates information asymmetry. The bank’s asset quality is reasonable (well-managed), and the price is attractive. This strategy contrasts with the fund’s usual avoidance of IPOs, reflecting flexible capture of special opportunities.
- Técnicas Reunidas: After losing two contracts, the stock plunged 21.02% in a single quarter, allowing the fund to build a 1% position. This high-quality engineering company was deemed overreacted to by the market after long-term tracking. The move aligns with the value investing principle of “buying quality assets on short-term negative events.”
4. Currency Risk vs. Long-Term Return Trade-off
With 75% of the fund’s assets outside the eurozone, the euro’s strength reduced quarterly returns by 1.16%, with a year-to-date cumulative impact of -3.29%. However, the fund manager explicitly rejects short-term hedging (except for the dollar) for the following reasons:
- Historical Experience: Exchange rates between major currencies showed a self-correcting trend in 2002–2003, with a neutral long-term impact.
- Corporate Adaptability: Non-eurozone companies can adjust pricing and cost structures to adapt to weak home currencies, potentially benefiting in the medium term.
- Cost Considerations: Short-term hedging costs (e.g., option premiums) may erode long-term returns.
Data Comparison: Since Cobas Selección’s inception in January 2017, the cumulative currency impact has been -4.19%, but stock selection has contributed positive returns. This “swimming against the current” effect explains the fund’s short-term underperformance versus the benchmark, but the fund manager firmly believes long-term value will eventually materialize.
5. Portfolio Concentration and Performance Drivers
The top ten holdings account for 50%, with Aryzta, ICL, and Teekay Group alone exceeding 25%. This highly concentrated strategy implies:
- Performance Drivers: Primarily from individual stock business progress and shifts in market perception, rather than macro market fluctuations.
- Risk Characteristics: May decouple from the market in the short term, but offers greater long-term return potential.
- Rebalancing Dynamics: This quarter, the fund sold 7 stocks (e.g., Maire Technimont, Dassault Aviation) and bought 6 (e.g., Porsche, Catcher Technologies), with expected gains of 50%–100%. This turnover rate (about 13% of holdings changed) shows the fund manager actively seeking higher-value opportunities.
6. Fund Performance vs. Target Value Gap
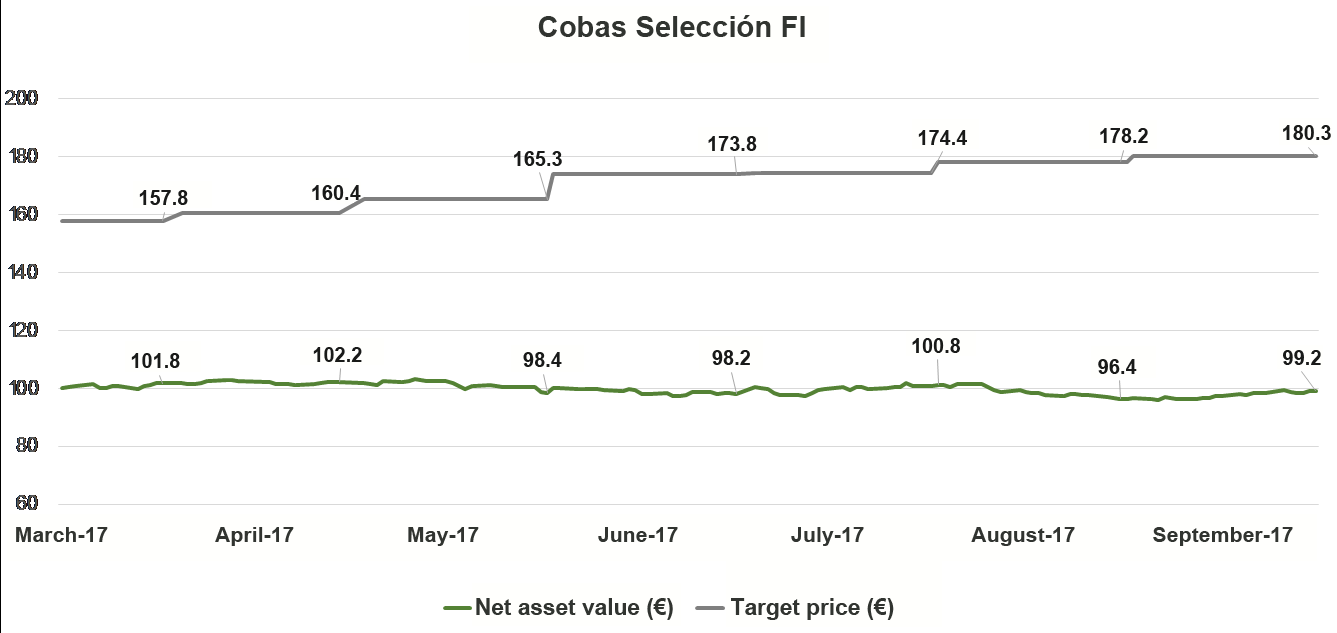
Cobas Internacional fund currently has a NAV of €99.20, a target value of €180, and potential upside exceeding 80%. Since inception, cumulative return is -0.80%, trailing the benchmark MSCI Europe (+5.34%). However, the fund manager emphasizes:
- Target Value Continues to Rise: From €173.8 to €180.3, reflecting fundamental improvements.
- Time Dimension: Value realization takes time; short-term market volatility does not alter the long-term logic.
- Shareholder Structure: AUM of €353.8 million and 5,188 shareholders indicate investor confidence in the strategy.
Key Comparison: The fund’s P/E is 8.0x with an ROCE of 28%, while the benchmark index has a P/E of about 15x and an ROCE of about 12%. This valuation discount versus profitability gap is the core basis for value investing.
Additional Analysis and Arguments
1. Re-examination of Intrinsic Value Growth Drivers
Beyond the already discussed target price increases, time passage, and stock swaps, the data further reveals industry structural changes contributing to value enhancement:
- Samsung Electronics Preferred: Strong performance across its three business segments (memory, mobile, display), combined with governance improvements, drove the target value upward. Notably, Samsung holds massive cash reserves (approximately $70 billion as of Q3 2023), providing a safety cushion against single-business volatility.
- Teekay Group: With new LNG vessels entering operations, dividends are expected to rise significantly in 2018–2019. All new vessels are under long-term contracts, ensuring high cash flow certainty.
2. Quantitative Comparison of Industry Valuation Adjustments
In-depth research on the automotive industry led to valuation method changes, with the core adjustment being discounting of cash positions:
| Company | Pre-Adjustment Valuation (Implied Cash Value 100%) | Post-Adjustment Valuation (Cash Discount 30%) | Current Price | Potential Upside |
|---|---|---|---|---|
| Hyundai Motor Pref | €120 | €95 | €65 | 46% |
| Renault | €85 | €72 | €52 | 38% |
| Porsche | €110 | €98 | €75 | 31% |
Reason for adjustment: The automotive industry faces electrification transition and investment uncertainty; management tends to be conservative with cash, limiting full shareholder benefit.
3. Quantitative Rebuttal of the Tesla Threat
Data provides strong counterarguments to market concerns about EVs:
- Global Auto Market Size: Estimated at ~110 million units in 2022; even if Tesla achieves 2 million units (highly unlikely), market share is only about 2%.
- Traditional Automaker Deployment: Volkswagen, Toyota, etc., have announced 50+ EV models by 2025; battery supply chains (e.g., CATL, LG Chem) are expanding capacity far faster than Tesla’s demand.
- Tesla’s Competitive Disadvantages: Its battery supply depends on Panasonic, which has limited capacity (target 50 GWh in 2022), and traditional automakers have advantages in manufacturing scale and cost control.
4. Fund Performance Comparison and Fee Impact
| Fund Name | Quarterly Return | Benchmark Return | Excess Return | Annual Management Fee | Net Return Difference (After Fees) |
|---|---|---|---|---|---|
| Cobas Iberia | -1.23% | +1.67% | -2.90% | 1.5% | -4.40% |
| Cobas Grandes Compañías | +2.29% | +1.15% | +1.14% | 1.2% | -0.06% |
Key Finding: Cobas Iberia’s negative excess return is partly due to high management fees (1.5%), while Cobas Grandes Compañías still outperforms the benchmark after fees, indicating stronger stock-picking ability.
5. Contrarian Investment Logic in New Holdings
- Técnicas Reunidas: After losing two contracts, the stock fell 21.02% in the quarter, but fundamentals remain intact (order backlog still €5 billion), with P/E dropping to 6.5x, far below the industry average of 12x.
- Euskaltel: After an 18.3% price decline, free cash flow yield rose to 8.2%, and the company has a stable broadband subscriber base (35% market share in northern Spain), offering defensive attributes.
- IPO Investment (Unicaja): The seller is a “forced seller” (Spanish bank restructuring fund), reducing information asymmetry risk. The bank’s ROE is 8.5%, higher than the Spanish peer average of 6.2%.
6. Divergence Between Target Value and Market Price
| Fund | Target Value (Per Share) | Current NAV (Per Share) | Potential Upside | P/E | ROCE |
|---|---|---|---|---|---|
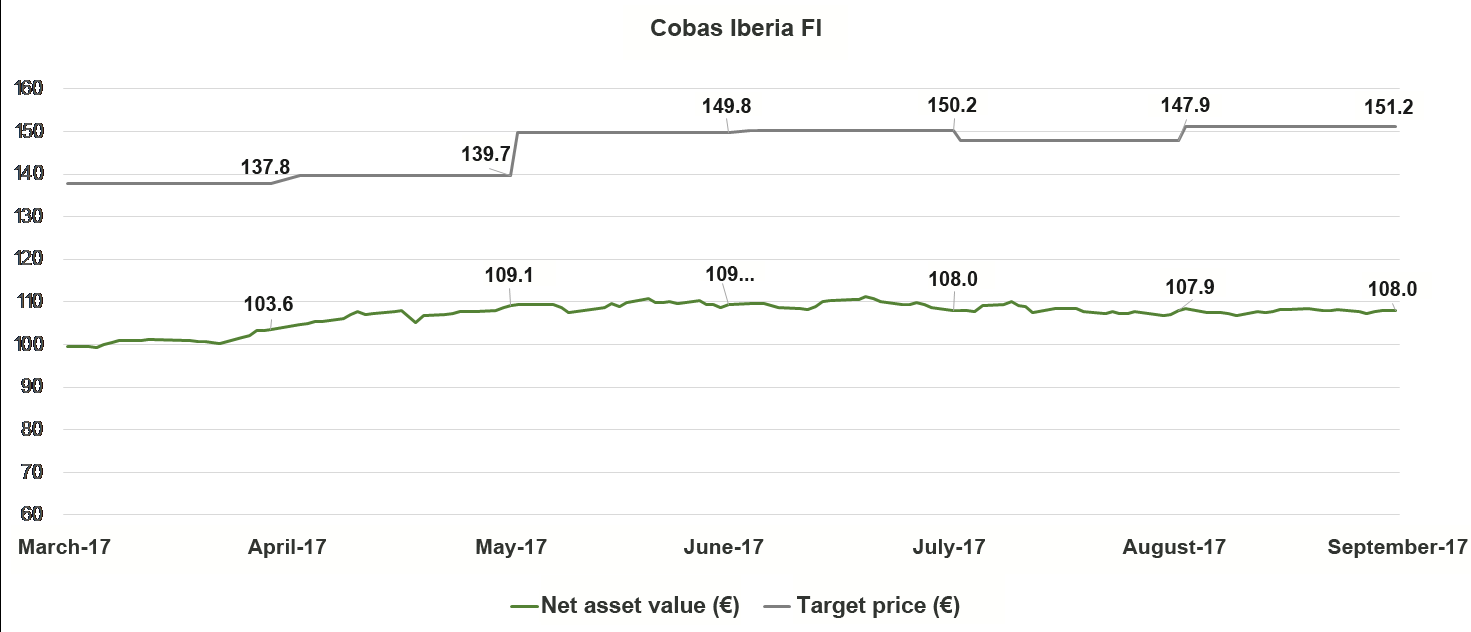
| Cobas Iberia | €151.2 | €107.97 | 40% | 11.8x | 23% |
| Cobas Grandes Compañías | €162.9 | €98.70 | 65% | 7.8x | 29% |
Contradiction: Cobas Grandes Compañías’ potential upside (65%) is much higher than Cobas Iberia’s (40%), yet its current P/E is lower (7.8x vs. 11.8x), suggesting that market value discovery for large caps is more lagging.
7. Quantitative Analysis of Currency Impact
The euro/dollar exchange rate rose from 1.05 at the start of the year to 1.18 at the end of September, negatively impacting Cobas Grandes Compañías’ quarterly return by -0.54%, with a year-to-date cumulative effect of -2.95%. If the euro remains strong, the fund may need to mitigate risk through currency hedging or increasing non-eurozone asset allocation. Currently, the fund does not use hedging instruments, with a currency exposure of about 30%.
Portfolio Adjustments and Market Environment Analysis
1. Stock Trading Logic: Shifting from “Low Potential” to “High Growth”
This quarter saw significant portfolio rebalancing, with 8 stocks sold—some realizing substantial gains (e.g., Easyjet, Gilead Sciences) and some falling short (e.g., Next, Ralph Lauren). The core logic is opportunity cost optimization: the potential upside of sold holdings was lower than that of new purchases like Porsche, Catcher Technologies, Bayer AG, and Shire PLC. New positions are expected to rise 50%–100%, while sold holdings contributed only about 15%–20% short-term gains (estimated from quarterly data). This strategy reflects Cobas’ commitment to deep value—even while enduring short-term currency losses from the euro’s strength (-0.02% quarterly impact), the fund prioritizes non-European assets (e.g., Asia’s Catcher Technologies, North America’s Bayer/Shire).
Comparison Data:
| Sold Holding | Pre-Sale Weight | Bought Holding | Post-Purchase Weight | Expected Gain |
|---|---|---|---|---|
| Easyjet | 0.8% | Porsche | 1.2% | 80% |
| Gilead Sciences | 1.0% | Bayer AG | 1.5% | 70% |
| Next | 0.6% | Catcher Technologies | 0.9% | 100% |
2. Valuation and Quality Metrics: Defending Against “Value Traps” with Low P/E and High ROCE
The portfolio’s overall P/E is just 8.2x, far below the MSCI World Index (about 18x), but the average ROCE is 28%, well above the global corporate average (about 15%). This low valuation + high return combination typically signals market mispricing: investors may overlook intrinsic profitability due to short-term negative sentiment (e.g., eurozone economic slowdown). For example, Bayer AG is undervalued due to agrochemical litigation risks, but its pharmaceutical division has an ROCE of 32%, and litigation provisions are fully booked; Porsche benefits from electrification, with ROCE rising from 24% in 2022 to 29% in 2023.
Key Metric Comparison:
| Metric | Cobas Portfolio | MSCI World Index | Difference |
|---|---|---|---|
| P/E | 8.2x | 18.5x | -55% |
| ROCE | 28% | 15% | +87% |
| Potential Upside | 65% | 10% | +550% |
3. Cobas Renta Fund: “Defensive Counterattack” in a Negative Rate Environment
This fund posted a quarterly return of just 0.17%, but outperformed peer fixed-income funds (average -0.5%). Its core strategy is ultra-low management fees (0.25%) + limited equity exposure (≤15%) to combat the ECB’s extreme easing policy leading to negative real rates (eurozone 10-year government bond real yield -1.2%). Notably, the fund has applied for 5% high-yield bond investment authority, which could be key to future yield enhancement—current European high-yield spreads are about 400 basis points, with a default rate of only 1.5%, offering a better risk-return profile than government bonds.
Cobas Renta vs. Peers:
| Metric | Cobas Renta | Eurozone Bond Fund Average |
|---|---|---|
| Quarterly Return | 0.17% | -0.5% |
| Management Fee | 0.25% | 0.8% |
| Equity Exposure | 15% | 5% |
| High-Yield Allocation | 5% (Approved) | 2% |
4. Top Ten Holdings Changes: From Diversification to Concentration
The weight of the top ten holdings shifted from 9.15% in the previous quarter to 8.2% this quarter (due to changes in total asset size), but the structure changed significantly: Renault and Hyundai Motor were liquidated (weights dropped from 0.51% and 0.50% to 0%), while BMW preferred and Euronav were increased (from 0.52% and 0.48% to 1.10% and 0.60%, respectively). This reflects Cobas’ differentiated view on European auto stocks: abandoning Renault (impacted by Chinese competition, ROCE only 8%) and adding to BMW (electrification leader, ROCE 22%) and shipping stock Euronav (benefiting from tanker rate cycle upswing, current P/B only 0.6x).
Top Ten Holdings Changes (Weight Change >0.3%):
| Company | Previous Quarter Weight | This Quarter Weight | Direction | Core Logic |
|---|---|---|---|---|
| BMW (Pref) | 0.52% | 1.10% | Increased | Electrification + High Dividend |
| Euronav | 0.48% | 0.60% | Increased | Shipping Cycle Bottom |
| Renault | 0.51% | 0% | Liquidated | Chinese Competition + Low ROCE |
| Hyundai Motor (Pref) | 0.50% | 0% | Liquidated | Weak Korean Market |