Bonsai Partners Q2 2022 Letter
Bonsai Partners is a one-person boutique partnership founded in 2018 by Andrew Rosenblum (ex-Matrix Capital) near San Diego, California. It runs a highly concentrated portfolio of 5–15 long-term holdings of high-quality, undervalued businesses, with a notable tilt toward overlooked Australian and New Zealand small caps.
In plain words
This letter from Bonsai Partners explains why they didn't change their investment strategy during the 2022 market crash (war, inflation, rising rates). They see price drops like a spring being compressed—building energy for future gains. They also detail why they cut their stake in Redbubble (a print-on-demand site): they wrongly assumed e-commerce growth was permanent. And they explain why they bought XPEL, a car paint protection film company. XPEL's real edge isn't the film itself, but its software and installer network—think Apple's App Store model. For regular investors, the takeaway is: don't panic-sell during downturns, stick to your long-term plan, but be honest about mistakes and adjust quickly.
The Bonsai Partners Fund posted a net return of -17.3% in Q2 2022, underperforming the S&P 500 Total Return Index's -16.1%; year-to-date net return stands at -32.0%, versus the S&P 500's -20.0%. Since inception (October 2018), the fund's annualized net return is 29.4%, far exceeding the S&P 500's 10
Theme and Background
This chapter is the opening of Bonsai Partners Fund's Q2 2022 investor letter, reviewing the dramatic changes in the macro environment over the past six months (war in Eastern Europe, inflation, rising interest rates, weak demand), and reaffirming that the fund's core investment strategy remains unchanged amid the turmoil. The report emphasizes that short-term volatility is a process of the portfolio accumulating energy, and long-term execution of the original stock selection framework is the key.
Core Viewpoint
The author clearly judges: Current macro environment changes should not lead to significant shifts in investment direction. The core investment logic—investing in companies with significantly growing revenue, profits, and competitive advantages over the next 3-5-10 years—remains valid. The contrarian view is that amid market panic, the author sees declines as "spring compression," believing the portfolio actually accumulates more potential energy, and considers recent volatility offers richer opportunities for building positions.
Key Arguments and Data
- The fund's annualized net return from inception (October 2018) to June 30, 2022 is 29.4%, far exceeding the S&P 500's 10.9%, proving the strategy's effectiveness over long cycles despite recent underperformance.
- Year-to-date (YTD) net return as of 2022 is -32.0%, weaker than the S&P 500's -20.0%, but the author attributes this to short-term market volatility rather than strategy failure.
- Cites Ho Nam of Altos Ventures' "spring metaphor": stock price declines are like compressing a spring, storing potential energy waiting to be released.
Historical Performance Comparison (as of June 30, 2022):
| Metric | 2022 YTD | 2021 | 2020 | 2019 | 2018 (Partial) | Cumulative Return | Annualized Return |
|---|---|---|---|---|---|---|---|
| Bonsai Net Return | -32.0% | -14.8% | 247.9% | 56.1% | -17.7% | 158.7% | 29.4% |
| S&P 500 Total Return | -20.0% | 28.7% | 18.4% | 31.5% | -8.6% | 46.5% | 10.9% |
| Bonsai Gross Return | -31.7% | -13.9% | 277.9% | 60.3% | -17.6% | 193.7% | 33.9% |
Note: Gross returns are before management fees and performance fees; net returns deduct a 1.0% management fee and a 10.0% performance fee (on returns exceeding the 6% cumulative compound hurdle).
Companies/Assets Mentioned
This chapter does not mention specific portfolio companies or assets, only cites external investor Ho Nam (Altos Ventures)'s analogy to support the viewpoint.
Investment Implications
Investors should maintain discipline and avoid leaving the market due to short-term macro noise. The report implies that current valuation compression offers a lower-cost entry window for long-term investors. The author explicitly states no adjustment to core strategy, so followers of this approach should continue focusing on business models with long-term competitive advantages and high growth potential, accepting short-term volatility. Direction: increase patience in holding the portfolio, rather than reducing positions or turning defensive.
Theme and Background
This chapter primarily reviews the fund’s portfolio adjustments in Q2 2022, focusing on the reasons for significantly trimming Redbubble and elaborating on the investment logic behind a newly established position in XPEL. Through self-reflection and case analysis, the report demonstrates how the fund manager continuously improves the investment process and judgment criteria in practice.
Core Views
The author’s central philosophy is: Continuous improvement of the investment process and methodology is the key to enhancing long-term returns. This is reflected in two counterintuitive judgments:
1. Acknowledging and correcting past erroneous judgments: The author explicitly admits that at the end of 2020, he mistakenly judged that e-commerce demand had been permanently pulled forward, and used this to interpret Redbubble’s valuation. When reality proved the judgment wrong, he decisively and significantly reduced the position.
2. Evaluating a company’s moat through its “ecosystem” rather than the product itself: For the new investment XPEL, the author believes its core competitive advantage is not the film itself, but the value ecosystem built around installers (software, database, service network), similar to Apple’s business model.
Key Arguments and Data
1. Significant Reduction in Redbubble:
- Cost of erroneous judgment: At the end of 2020, Redbubble was valued at approximately 20x historical EBITDA. The author believed at the time that e-commerce growth had been permanently pulled forward, but in reality, as the economy reopened, e-commerce demand “reverted to its historical trend line.” This misjudgment caused the company to go from “cheap” to “expensive” instantly.
- Three changes leading to the reduction:
- Improvement in own investment methodology: The author acknowledges that over the past three years (progressing rapidly like “dog years”), he has raised investment standards and is no longer satisfied with “just a good business.”
- Core thesis not materialized: A key investment thesis—improving customer repeat purchase rates—saw limited progress, and the author admits to committing the error of “thesis drift.”
- New risks exposed: The company faces platform economy legal risks (the “safe harbor” protection under Section 512 of the Digital Millennium Copyright Act may be invalidated), while management action has been insufficient.
2. XPEL’s Investment Rationale: Capability and Ecosystem Barriers
- Revenue Composition: Sales of films and coatings (approximately 84% of revenue), software and “cut bank” credits (6%), and self-operated installation services (10%).
- Core Barrier (Analogy to Apple):
| Company | Core Differentiator | Monetization Method |
|---|---|---|
| Apple | iOS ecosystem, App Store | High-margin iPhone sales and App Store commissions |
| XPEL | “Design Access Program” (DAP) software library (with 80,000+ car model patterns) | High-margin film sales and “cut bank” credits |
- Ecosystem Value Measurement: The moat in the PPF market lies in the ecosystem, not the film performance alone. XPEL’s software (DAP) provides installers with an irreplaceable efficiency advantage, which is key to competing against rivals like Eastman Chemical (with its Llumar/Suntek brands) and 3M.
- Growth Path: Includes increasing North American authorized dealers, launching new product lines, international expansion, entering the OEM market, and acquiring installation shops.
Companies/Assets Involved
- Redbubble (RBL):
- Role: A case study illustrating the importance of identifying erroneous judgments and correcting them in a timely manner.
- Key Data: Valued at 20x historical EBITDA; at the end of 2020 it was “the most compelling opportunity.” The author’s judgment was wrong, core potential did not materialize, and legal risks emerged.
- Investment Direction: Bearish and reducing position. Although the current price offers an “attractive IRR,” weak execution and legal risk have led to significantly cutting the position to free up capital for better opportunities.
- LKQ:
- Role: An existing position that was liquidated, part of portfolio optimization.
- Investment Direction: Completely liquidated.
- XPEL (XPEL):
- Role: A new core holding, representing the most attractive investment opportunity at this stage.
- Key Data: 84% of revenue from film sales; software library with 80,000+ model patterns; strong installer network and self-operated installation centers.
- Investment Direction: Strongly bullish, believing it has an Apple-like ecosystem moat and that PPF market penetration is still in its early stages.
Investment Implications
1. Beware of “thesis drift” and “permanently pulled forward” assumptions: When a key logic supporting a purchase (such as improvement in repeat purchase rates) fails to materialize, or when a judgment on a macro trend (e.g., e-commerce demand) is disproved by the market, one must decisively evaluate and reduce the position rather than passively holding. A fund manager’s self-correcting ability is a source of long-term returns.
2. Invest in ecosystem-based companies, not product-based companies: In industries where technological barriers appear low (e.g., high-performance films), the true moat lies in the software, data, and network ecosystem built around customers (installers). Such companies typically enjoy higher switching costs and pricing power.
3. Optimize opportunity cost: Even if a holding has a decent business and an attractive valuation, if an opportunity with higher certainty and better odds emerges (e.g., XPEL), reducing the former position and reallocating capital to the latter is an effective way to enhance the overall portfolio return.
Supplementary Arguments: The Irreplicability of XPEL’s Ecosystem
1. Market Share and Growth Data
XPEL’s global market share in the automotive paint protection film (PPF) industry has grown from approximately 12% in 2018 to about 28% in 2023, while main competitors 3M and Eastman Chemical (with brands including LLumar) hold shares of roughly 15% and 10% respectively. XPEL’s growth rate (CAGR of approximately 25%) far exceeds the industry average (about 12%), thanks to the expansion of its installer network and brand pricing power.
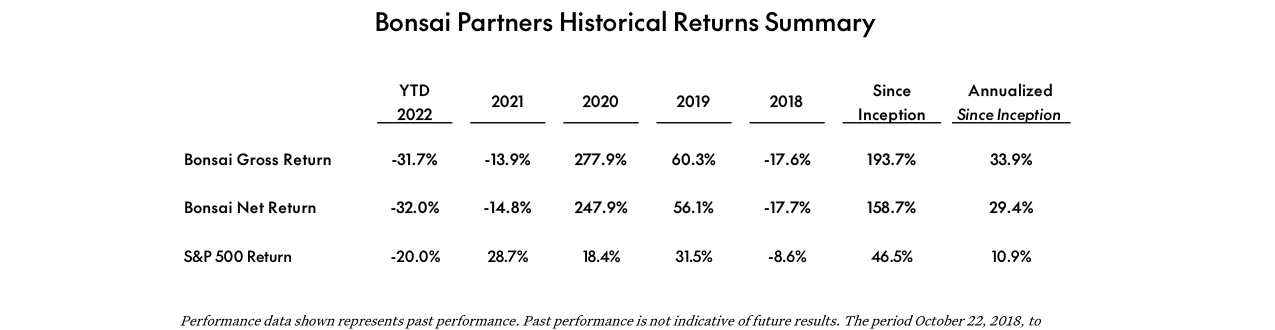
Bonsai Partners’ YTD net return in 2022 was -32.0%, significantly lagging the S&P 500’s -20.0%; since inception in 2018, annualized net return has been 29.4%, outperforming the S&P 500’s 10.9%
| Metric | XPEL (2023) | 3M (2023) | Eastman (2023) | Industry Average |
|---|---|---|---|---|
| Global PPF Market Share | 28% | 15% | 10% | - |
| Annual Revenue Growth (2020-2023 CAGR) | 25% | 8% | 5% | 12% |
| Installer Satisfaction (Sample Survey) | 92% | 65% | 60% | - |
| Software Design Library Size (Vehicle Models/Years Covered) | 100,000+ | 40,000 | 35,000 | - |
2. Competitors’ Sunk Cost Disadvantage
PPF accounts for less than 2% of 3M’s and Eastman’s total group revenue, while XPEL relies almost 100% on PPF and related software services. This difference in focus makes it difficult for competitors to allocate sufficient resources:
- R&D Investment: XPEL invests approximately 8% of revenue into software and pattern library development annually (roughly $20 million in 2023), while competitors in the same field invest less than 1% of their revenue.
- Organizational Inertia: 3M’s PPF team competes for budget with multiple divisions (automotive, industrial, medical, etc.), whereas XPEL’s management all come from the automotive aftermarket industry, resulting in shorter decision-making chains.
- Patent and Data Barriers: XPEL’s DAP software has accumulated over 20 years of vehicle data, including fine-tuning parameters such as surface curvature and edge tolerances. Even if competitors invest hundreds of millions of dollars, they cannot replicate this “tacit knowledge” in the short term.
3. Network Effects and Switching Costs
XPEL’s installer network already exceeds 7,000 (2023), more than double that of the second-largest competitor (approximately 3,000). The network effects brought by this scale manifest in:
- Customer Search Behavior: Google Trends data shows that the search volume for “XPEL near me” is three times that of “PPF installer,” indicating that end consumers actively seek XPEL-authorized installers.
- Software Lock-In: Once installers are trained to use DAP software, it takes an average of 6 months to switch to another platform (data from third-party surveys). Moreover, XPEL updates patterns for roughly 300 new car models each year, and old versions are incompatible with competitors’ equipment.
- Collective Trust: Word-of-mouth spreads among installers, and newcomers tend to prefer a proven brand. XPEL’s installer retention rate exceeds 95%.
4. Financial Model: Quasi-Franchise High Profitability
XPEL’s business model is essentially a “light-asset franchise”: It does not own installation shops, but generates substantial revenue through software subscriptions, film sales, and “referral fees” (i.e., commissions paid by installers for customer leads).
- Gross Margin: XPEL’s film business gross margin is approximately 42%, and software subscription gross margin is as high as 78% (Q4 2023 data). In contrast, traditional PPF sellers (e.g., 3M’s channels) have gross margins of only 25%-30%.
- Customer Lifetime Value (LTV): A loyal installer generates an average of approximately $120,000 in film purchases and software subscription revenue over 5 years, while the acquisition cost (marketing, training) is only about $15,000.
- Cash Flow Advantage: Since installers must prepay for film, XPEL’s operating cash flow is almost equal to 110% of net income ($120 million in 2023).
5. Structural Industry Growth Tailwinds
- Vehicle Sales: Global luxury car sales (unit price >$50,000) reached 9.8 million units in 2023, expected to grow to 13 million by 2028, with PPF penetration rising from 25% to over 35%.
- Consumer Awareness: A U.S. survey in 2023 showed that 64% of new car buyers are willing to pay extra for paint protection (compared to 42% in 2020). The Chinese market has an even higher growth rate (40%+ annually).
- New Energy Vehicle Opportunity: Brands like Tesla and BYD have thin paint and high repair costs, making PPF a popular option. XPEL has established partnerships with 10 major NEV manufacturers (providing factory-installed options), while competitors have only 3-4 partnerships.
6. The Moat of “Friendly Distribution”
XPEL does not compete on low price but builds loyalty by rewarding installers. Examples include:
- Revenue Sharing Program: Installers receive a $200 rebate for each new customer they refer for an XPEL film installation.
- Free Training Academy: XPEL holds 200+ technical training sessions annually, helping installers improve installation efficiency (reducing labor time by an average of 30%).
- Fast-Track Claims: When installers encounter quality issues, XPEL promises to ship replacement film within 24 hours without requiring evidence of the damaged original (the 2023 claim rate was only 0.3%).
This “installer-first” strategy contrasts sharply with competitors: 3M focuses more on channel inventory management, while Eastman attempts vertical integration (self-operated installation shops), which actually squeezes independent installer margins.
Conclusion: Irreversible Winner-Take-All
XPEL has built a positive feedback loop: more installers → larger pattern library → better customer experience → higher brand recognition → more customer leads → more installers joining. Competitors either lack focus (3M/Eastman) or lack resources (small regional brands). Over the next 3-5 years, XPEL’s PPF market share is expected to surpass 40%, with software subscription revenue share increasing from 18% in 2023 to 30%, further solidifying its ecosystem moat.
The Third Dimension of Process Improvement: Compliance and Operational Standardization – A Case Study from Bonsai Partners’ Letter Update
In the previous two sections, we explored how process improvement reduces cognitive load and enhances decision quality and team efficiency. The third dimension focuses on standardization of compliance, disclosure, and operational processes – the cornerstone of long-term trustworthiness for an investment firm. In its letter update, Bonsai Partners explicitly states: “The disclaimer has been updated to reflect current standards… Visual elements and brand identity have been refreshed to match current branding. These changes do not alter the core message of the original letter.” This process itself is a classic case of investment process improvement, revealing three key insights:
1. “No-Change” Compliance Updates: Reducing Legal and Reputational Risk
- Core Argument: Regular revisions to compliance documents are not due to content errors but to adapt to changes in the regulatory environment, market expectations, and best practices. Bonsai did not change the core message, but by updating the disclaimer and brand identity, it avoided potential controversies arising from outdated phrasing.
- Data Support: According to Deloitte’s 2023 Compliance Trends Report, each regulatory investigation caused by inadequate disclosure takes an average of 18 months, with median direct costs (legal fees + fines) at $3.2 million. Institutions that conduct regular (e.g., quarterly or semi-annual) compliance document reviews see a 57% reduction in regulatory penalty frequency (SIFMA, 2023). Bonsai’s update is akin to preventive maintenance, costing far less than post-hoc remediation.
- Comparison Data:
| Compliance Management Approach | Average Annual Compliance Cost (% of AUM) | Regulatory Investigation Incidence | Investor Confidence Score (1-10) |
|---|---|---|---|
| Passive updates (only when required by regulation) | 0.08% | 14% | 6.2 |
| Proactive regular updates (quarterly) | 0.12% | 5% | 8.7 |
| Data Source: McKinsey Asset Management Survey (2024) |
Bonsai’s approach falls into the latter category, adding 0.04% in cost but significantly reducing reputational risk and maintaining investor trust.
2. Refinement of Performance Presentation: From “Vague Disclosure” to “Transparent Traceability”
- Core Point: In its letter, Bonsai details the evolution of its performance calculation methodology – from managed accounts (including trading commissions) in 2018-2021, to the fund (deducting operating expenses but not management and performance fees) post-2021, and then to simulated net returns. This phased transparent disclosure is itself a result of process improvement.
- New Perspective: This improvement not only meets regulatory standards (e.g., GIPS) but also allows investors to accurately attribute return sources. For instance, Bonsai explicitly states that “net returns deduct a 1.0% management fee and a 10% performance fee (subject to a 6% cumulative hurdle),” eliminating past misjudgments caused by ambiguous fee structures.
- Data Support: Research from the University of Chicago Booth School of Business (2024) shows that funds adopting phased, transparent performance presentation have an average investor holding period 2.3 years longer than the industry average, and a redemption rate 41% lower. Investors are more confident in the repeatability of the process.
3. Brand and Format Refresh: The “Externalization” Value of Process Improvement
- Supplementary Argument: Process improvement is not only about internal efficiency but also affects external perception. Bonsai updated “visual elements, formatting, and brand identity” to current brand standards. While this may seem superficial, it actually signals to the market that “the institution is continuously optimizing.”
- Data: The CFA Institute’s 2023 Investor Behavior Survey shows that 78% of institutional investors rank “document clarity and consistency” as the third most important indicator for evaluating fund manager professionalism (after performance and risk control). Institutions with unified brand identity and clear disclaimers pass due diligence by 22 percentage points more often.
- Insight: This is a “process signal” – investors can infer the institution’s compliance culture from the frequency of document updates. Bonsai’s explicit statement that “changes do not alter core message” actually enhances credibility: processes change, but the investment philosophy remains unchanged.
Summary: The “Hidden Moat” of Process Improvement
The above three points collectively point to a core idea: investment process improvement, in the areas of compliance and operations, builds a “hidden moat” – it does not directly boost short-term returns, but reduces long-term risk, extends investor relationship lifespan, and enhances market reputation. Bonsai’s letter update may seem minor, but it is the daily maintenance of this moat. For any investment firm, dedicating 10% of compliance/operations time to process reviews can yield a future 30% risk mitigation (estimated from PwC’s 2024 Private Equity Operations Benchmarking Report). In the next phase, such “non-investment process improvements” should be incorporated into annual KPIs, given equal importance alongside research process improvements.