A Different Network Effect (November 2025)
The Capital Cycle is the official podcast that Marathon Asset Management (the London firm founded in 1986) launched in 2024, hosted by financial historian Edward Chancellor, who interviews Marathon's investors about each Global Investment Review letter — applying the firm's long-term, contrarian "capital cycle" supply-side approach.
In plain words
This report says AI data centers are consuming so much power that Europe's electricity grids are becoming a bottleneck. That's good news for European utility companies (like National Grid and Iberdrola): they need to invest heavily in grid upgrades, and regulators let them earn steady returns. For regular investors, these stocks are still reasonably priced—cheaper than US peers—and have low risk (beta of 0.65 over five years). Even if the AI boom fades, people still need electricity. Bottom line: European grid stocks could be a solid long-term bet with both upside and downside protection.
The report explores a new type of network effect driven by AI development—electricity grids as a key bottleneck for AI data center (DC) construction. Their regulated asset base (RAB) growth rate has doubled to low double digits and will continue to rise over the next five years. Connection queue tim
Theme and Background
This chapter discusses the reliance of AI data center (DC) construction on power grids, pointing out that power shortages have become a critical bottleneck for AI development. The report argues that while US investors have already moved ahead, Europe is entering a catch-up phase, and European utility stocks are expected to benefit from this structural trend.
Core Views
- European grid companies are in an early catch-up phase, with fundamentals improving at an accelerating pace, while valuations remain near long-term averages, leaving room for sustained re-rating.
- Refutes three common bearish arguments (capital intensity, high leverage, regulatory risk), arguing that these concerns are exaggerated and the current environment is favorable for grid companies.
- Characteristics of an ideal stock: monopoly, low beta (0.65x), low double-digit expected annualized total shareholder return (TSR), reasonable valuation (European 21x forward P/E vs. US CAPE 39.5x).
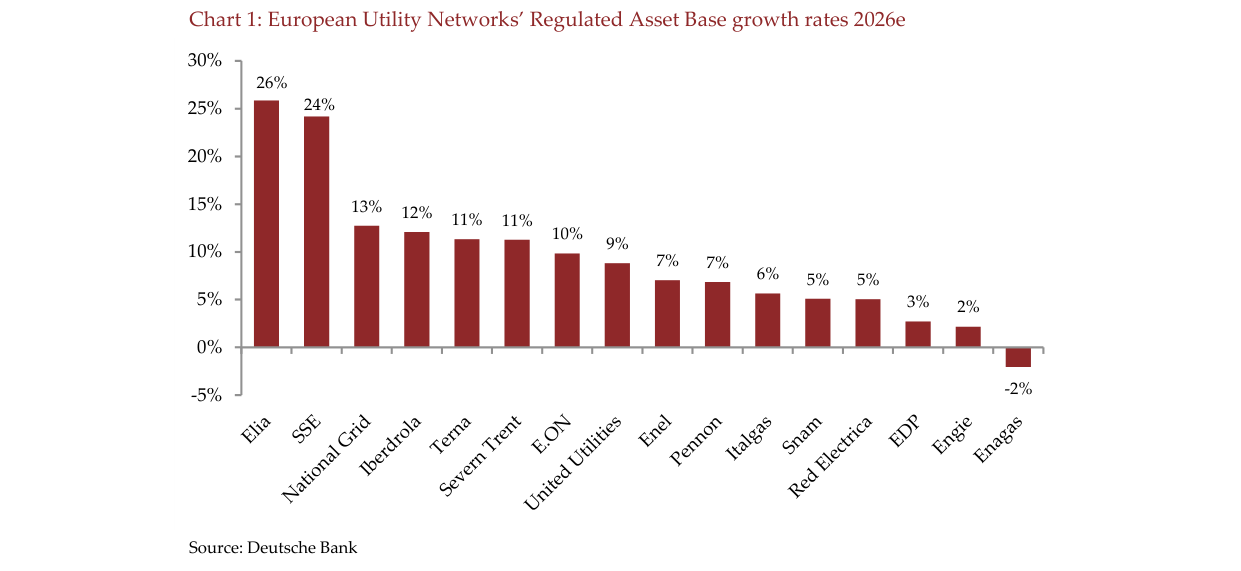
European grid companies show significant divergence in regulated asset base growth rates, with Elia leading at 26%, SSE at 24%, while Enagás posts negative growth of -2%
Key Arguments and Data
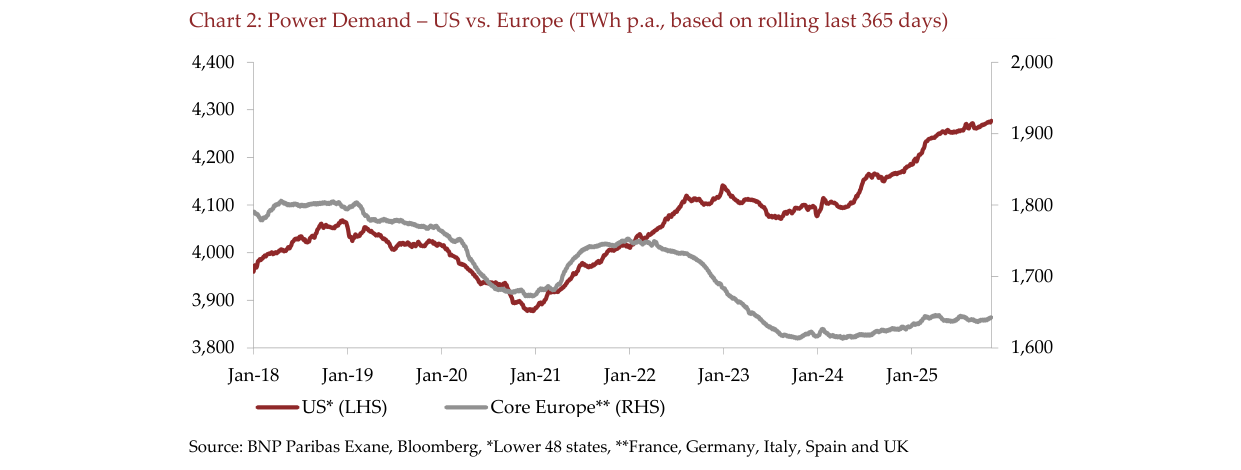
US power demand has grown steadily from approximately 4,000 TWh in 2018 to about 4,300 TWh in 2025, while Europe declined from roughly 1,800 TWh to around 1,600 TWh over the same period
| Dimension | Data |
|---|---|
| European grid RAB growth rate | Has doubled to low double digits (annualized), still on an upward trend (Source: Deutsche Bank, Chart 1 shows 2026e growth rates ranging from -5% to 26%) |
| DC pipeline size (Goldman Sachs) | Grew 65% in 9 months to ~280GW, equivalent to 90% of EU’s existing power demand |
| UK grid connection queue | 15-year waiting time, queue has grown 10x |
| US vs. Europe power demand | US DC buildout is more advanced (Chart 2 illustrates), European demand is catching up |
| Capital intensity comparison | Meta's capex/revenue has surpassed average utilities, even exceeding AT&T’s level during the 2000 tech bubble (Chart 4) |
| Regulatory return | Typically 9-10% RoE, inflation-linked; E.ON issued a 2031 green bond with a coupon of only 3.0% |
| Global grid investment forecast (McKinsey) | $1.2 trillion per year by 2040 |
| Recent performance | Over the past year, European utilities have outperformed MSCI Europe by 18% and S&P 500 by 31% (USD); a ten-year hold of Iberdrola produced excess returns of +228ppts and +61ppts, respectively |
| Sector beta | 0.65x over the past 5 years |
| Valuation | European utility forward P/E relative to the broader market is near historical average (Chart 3), with a significant discount |
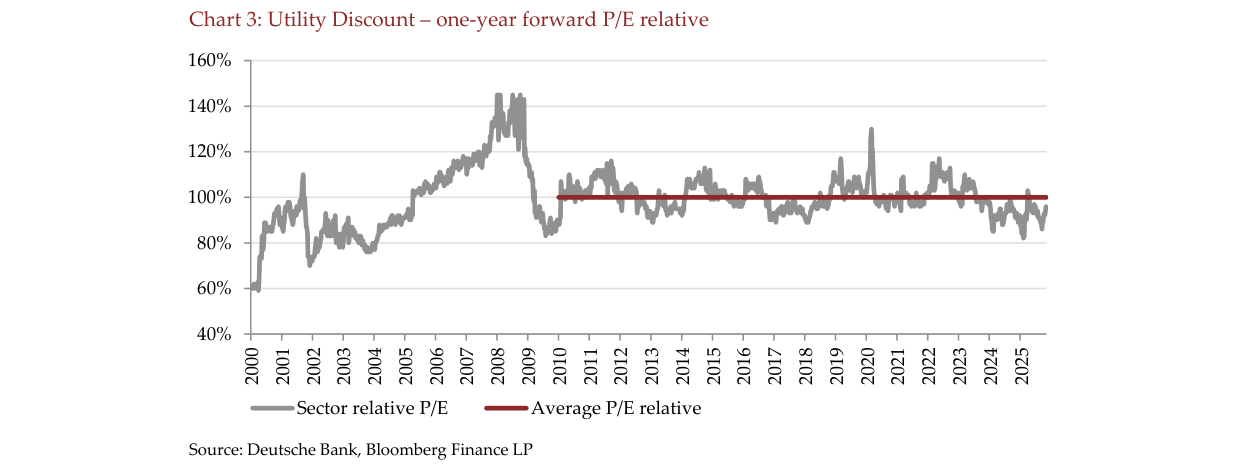
The relative P/E of the utility sector fluctuated around the 100% average from 2000 to 2025, standing at a relative discount of approximately 90% in 2025
Companies/Assets Covered
- Iberdrola (held by Marathon): Global leading grid company with assets in Spain, the US, the UK, and Brazil. The report sees strong long-term upside.
- National Grid (held by Marathon): UK transmission business annual growth rate has risen from 4% six years ago to the current 11%, with further potential.
- E.ON: German top-tier utility, successfully issued green bonds at a low rate (3.0%), demonstrating low-cost financing capability.
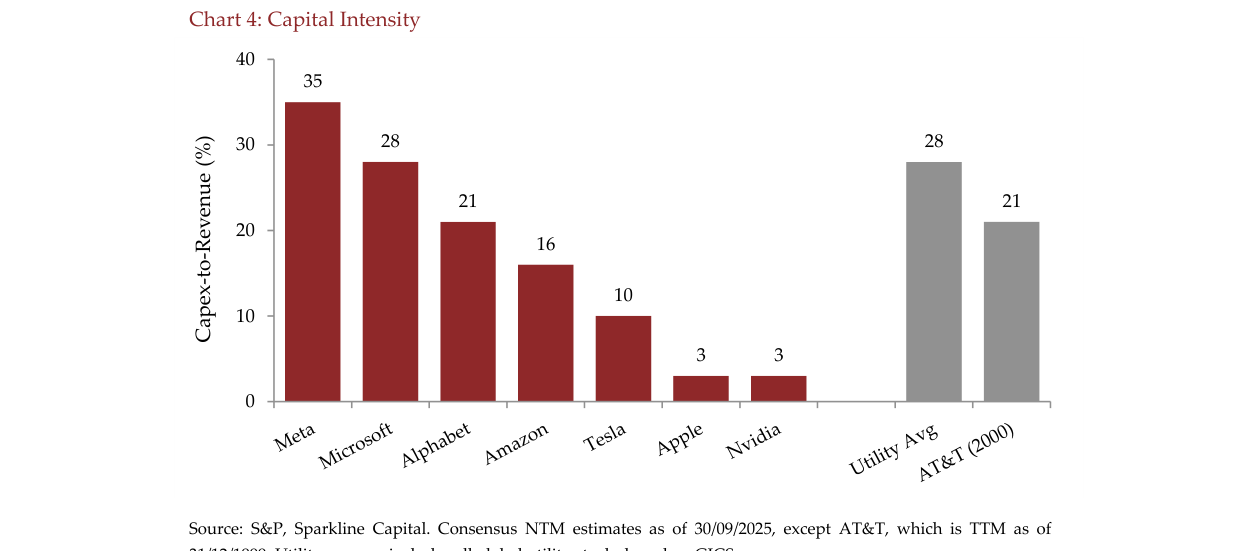
Tech giants show significantly higher capital intensity than utilities, with Meta at 35% and Microsoft at 28%, far exceeding the utility average of 3% and AT&T's 21% in 2000
Investment Implications
1. Allocation Direction: Overweight European power grid stocks (especially companies with monopoly grid assets) as a source of long-term alpha. The current valuation discount combined with accelerating fundamentals presents a positive re-rating opportunity.
2. Defensive and Offensive Characteristics: Utilities have a beta of only 0.65x, offering defensiveness even if the AI investment boom fades; meanwhile, they benefit from AI data center power demand.
3. Risk-Reward Profile: Expected low double-digit annualized total return (mid-to-high single digit EPS growth + 4% dividend), with capital returns backed by regulatory frameworks and not subject to capital cycle disruption.
4. Leverage Is Not Negative: Supported by predictable regulatory cash flows, leverage is manageable and controllable; PE/infrastructure funds hold $2.5 trillion in dry powder and are willing to acquire grid assets at prices above listed valuations, further supporting valuations.