Baillie Gifford Bond Funds ICVC Annual Report - September 2025
In plain words
This report explains the audit of a bond fund's annual accounts. In plain terms: the auditor says the numbers are fairly presented, but the tone is cautious. One sub-fund, the Emerging Markets Bond Fund, has been closed and liquidated—it no longer trades. The auditor also warns that the fund's risk-measurement tool may understate losses in extreme market swings. Another sub-fund, the Strategic Bond Fund, pays dividends every month, giving investors steady cash flow. Two fraud risks are flagged—manipulating the fund's net asset value (the value of each unit) and manipulating income—but no issues were found this year.
At a Glance
In this issue, the author examines fund structure through audit reports: one sub-fund has been liquidated and terminated, while the remaining sub-funds continue as going concerns. Overall financial fairness is unqualified, but risk disclosures and derivatives measurement contain uncertainties warranting caution — stance: [Cautious].
- The Baillie Gifford Emerging Markets Bond Fund has been closed and liquidated (closure date April 22, 2024) and is still consolidated into this annual report on a non-going-concern basis; it is expected to be fully removed in the 2026 annual report.
- The auditor issued unqualified opinions on the three continuing sub-funds and attached an "Emphasis of Matter" paragraph to the terminated sub-fund; simultaneously, NAV manipulation and income manipulation are both identified as fraud risks.
- The accounting policies continue to follow the May 2014 SORP; from the new fiscal year starting October 1, 2025, the 2024 SORP becomes mandatory, with significantly enhanced requirements for ESG, valuation governance, and liquidity disclosures.
- All sub-funds pass the QIT (Qualifying Investment Test), and all distributions are treated as interest distributions; the Strategic Bond Fund distributes monthly, while the remaining sub-funds distribute quarterly.
- The VaR framework in the report does not disclose key parameters such as time horizon and confidence level; the author notes that it may underestimate tail risks in extreme market conditions.
[SKIP]
续篇内容展现了审计报告在“风险识别—程序执行—意见表达”三层逻辑上的严密衔接。新增分析聚焦于以下三个此前未展开的维度:双重持续经营基础的结构性分置、舞弊风险与审计程序的映射关系,以及基金审计特有的“法定审计+准监管报告”双重义务。
The follow-up analysis demonstrates the rigorous interconnection of the audit report across the three-layer logic of “risk identification—procedure execution—opinion expression.” The new analysis focuses on three dimensions not previously elaborated: the structural bifurcation of the dual going-concern basis, the mapping between fraud risk and audit procedures, and the “statutory audit plus quasi-regulatory reporting” dual obligation unique to fund audits.
1. 双重持续经营基础:同一法律实体下的“分置”与“整全”
1. Dual Going-Concern Basis: “Bifurcation” and “Wholeness” Under the Same Legal Entity
Baillie Gifford Bond Funds ICVC 是一个 OEIC 法律实体,但其下四个子基金各自承担独立资产与负债。本续篇最突出的一点在于,审计师在同一份报告中对两种截然不同的编制基础并行发表意见:
Baillie Gifford Bond Funds ICVC is an OEIC legal entity, but its four sub-funds each bear separate assets and liabilities. The most striking feature of this follow-up is that the auditor renders opinions concurrently on two fundamentally different bases of preparation within the same report:
| 维度 | Continuing sub-funds(3个) | Terminating sub-fund(1个) |
|---|---|---|
| 编制基础 | Going concern basis | 非持续经营基础(按可实现净额等调整) |
| 审计意见形式 | 无保留意见 | 无保留意见 + Emphasis of matter |
| 持续经营评估期间 | 报表批准日后至少12个月 | 不适用——已决定终止 |
| 会计框架适用 | FRS 102 持续经营假设 | FRS 102 非持续经营相关条款 |
| Dimension | Continuing sub-funds (3) | Terminating sub-fund (1) |
|---|---|---|
| Basis of preparation | Going concern basis | Non-going-concern basis (adjusted to net realizable value, etc.) |
| Form of audit opinion | Unqualified opinion | Unqualified opinion + Emphasis of Matter |
| Going-concern assessment period | At least 12 months after approval of the financial statements | Not applicable — termination already decided |
| Applicable accounting framework | FRS 102 going-concern assumption | FRS 102 non-going-concern provisions |
这种“分置”处理在结构上呈现两个特征:第一,法律实体的统一性与经济实质的离散性共存——审计师必须在公司层面和子基金层面分别作出判断;第二,强调事项段(Emphasis of matter)被用于“提示而非修正”——审计师刻意保持意见未修改,以防止读者误读为保留意见。这是一个值得注意的审计报告设计:不修改意见,但通过强调段落将终止子基金单独“隔离”出来,使得基金份额持有人能够精确识别其影响范围。
This “bifurcated” treatment exhibits two structural characteristics. First, the unity of the legal entity coexists with the discreteness of economic substance — the auditor must exercise judgment separately at the company level and at the sub-fund level. Second, the Emphasis of Matter paragraph is used to “flag rather than modify” — the auditor deliberately leaves the opinion unmodified to prevent readers from misreading it as a qualified opinion. This is a noteworthy design of the audit report: the opinion is not modified, but the terminating sub-fund is “isolated” by means of an emphasis paragraph, allowing fund unit holders to precisely identify the scope of its impact.
2. 舞弊风险识别与审计程序的三层映射
2. Three-Layer Mapping of Fraud Risk Identification and Audit Procedures
续篇详细列出了四项核心审计程序,其背后对应着三种不同的风险层级:
The follow-up details four core audit procedures, which correspond to three distinct risk tiers:
| 审计程序 | 所针对的风险层级 | 机制逻辑 |
|---|---|---|
| 与管理层讨论 | 已知或疑似不合规、舞弊 | 利用管理层信息优势作为触发点,引导后续测试 |
| 审阅董事会会议纪要 | 治理层决策中的异常信号 | 捕捉正式账务之外的决策痕迹 |
| 测试年末结账日记账 | 收入/NAV操纵(盈余管理高发窗口) | 年末结账是人为调整的最后入口,账外操纵风险最大 |
| 设计不可预测性测试 | 管理层对审计范围的预判与规避 | 防止审计程序被“格式化”而失效 |
| Audit procedure | Risk tier addressed | Mechanism logic |
|---|---|---|
| Discussions with management | Known or suspected non-compliance and fraud | Leverages management’s information advantage as a trigger point to guide subsequent testing |
| Review of board meeting minutes | Anomalous signals in governance-level decision-making | Captures traces of decisions outside the formal accounting records |
| Testing year-end closing journal entries | Revenue/NAV manipulation (high-incidence window for earnings management) | Year-end closing is the final entry point for manual adjustments, where the risk of off-book manipulation is greatest |
| Designing unpredictable tests | Management’s anticipation and circumvention of the audit scope | Prevents audit procedures from being “routinized” and rendered ineffective |
其中的关键判断在于:审计师将 NAV 操纵 与 收入操纵 并列为舞弊风险。这一设计在基金行业中具有特异性——对 OEIC 而言,单位净值是申购赎回定价的基础,也是管理费用计提的基数。若 NAV 被人为抬高,影响的不仅是当期收入,还直接传导至申购赎回价格,进而波及所有持有人的经济利益。ACFE《2024年职业舞弊报告》显示,财务报表舞弊仅占职业舞弊案件的约5%,但其造成的损失中位数通常远高于其他类别;而收入确认在财务报表舞弊方案中占比最高。尽管该数据针对一般企业,但其逻辑在基金行业中的对应物正是收入与 NAV 的双重操纵风险。
The key judgment here is that the auditor treats NAV manipulation and revenue manipulation on an equal footing as fraud risks. This design is especially distinctive in the fund industry — for an OEIC, the net asset value per unit is the basis for pricing subscriptions and redemptions and the base for accruing management fees. If the NAV is artificially inflated, the impact is not limited to current-period revenue; it transmits directly to subscription and redemption prices, and in turn affects the economic interests of all unit holders. The ACFE’s 2024 Occupational Fraud Report shows that financial statement fraud accounts for only about 5% of occupational fraud cases, but the median loss it causes is typically far higher than other categories; revenue recognition accounts for the largest share of financial statement fraud schemes. Although this data pertains to general enterprises, its logical counterpart in the fund industry is precisely the dual manipulation risk of revenue and NAV.
3. 审计报告中的责任隔离机制
3. Responsibility Segregation Mechanism in the Audit Report
续篇在“其他信息”与“审计师责任”部分的表述,呈现出三条清晰的边界线:
The follow-up’s discussion of the “Other Information” and “Auditor’s Responsibilities” sections reveals three clear boundary lines:
| 责任主体 | 所负责对象 | 审计师对其处理方式 |
|---|---|---|
| ACD | 财务报表编制、内部控制、持续经营评估 | 审计师对其编制结果承担责任声明 |
| ACD | 其他信息(Annual Report 中的非财务信息) | 审计师仅做一致性检查,不发表审计意见 |
| 审计师 | 财务报表整体合理性 | 合理保证,而非绝对保证 |
| Responsible party | Subject of responsibility | Auditor’s treatment |
|---|---|---|
| ACD | Preparation of financial statements, internal control, going-concern assessment | The auditor issues a statement of responsibility over the ACD’s preparation results |
| ACD | Other information (non-financial information in the Annual Report) | The auditor performs consistency checks only and expresses no audit opinion |
| Auditor | Overall reasonableness of the financial statements | Reasonable assurance, not absolute assurance |
特别值得注意的是“we have nothing to report”这一句的份量。它并非空泛的确认,而是建立在“识别不一致→执行程序→得出结论”这一链条之上的终局结论。与此同时,报告又明确声明“because not all future events or conditions can be predicted, this conclusion is not a guarantee”——这体现了 ISA(UK)框架下的“合理保证”哲学:程序上最大努力,结论上保留概率性。
What is particularly noteworthy is the weight of the statement “we have nothing to report.” It is not a hollow confirmation, but a final conclusion built on the chain of “identify inconsistencies → perform procedures → reach a conclusion.” At the same time, the report explicitly states that “because not all future events or conditions can be predicted, this conclusion is not a guarantee” — reflecting the “reasonable assurance” philosophy under the ISA (UK) framework: maximum effort in procedures, probability reserved in the conclusion.
4. 基金审计特有的“双重报告义务”
4. The “Dual Reporting Obligation” Unique to Fund Audits
续篇中单独列示的 Collective Investment Schemes sourcebook exception reporting,反映了基金审计区别于一般企业审计的核心特征:审计师同时承担法定审计义务与准监管报告义务。
The Collective Investment Schemes sourcebook exception reporting, set out separately in the follow-up, reflects a core feature that distinguishes fund audits from general corporate audits: the auditor simultaneously bears the obligations of statutory audit and quasi-regulatory reporting.
| 维度 | 法定审计(ISAs (UK)) | Sourcebook 例外报告 |
|---|---|---|
| 核心问题 | 财务报表是否真实公允 | 是否遵守 CIS 法规 |
| 焦点 | 重大错报(fraud/error) | 会计记录是否健全、账表是否一致 |
| 报告方式 | 审计意见 | 例外报告(本报告为“无例外”) |
| Dimension | Statutory audit (ISAs (UK)) | Sourcebook exception report |
|---|---|---|
| Core question | Whether the financial statements give a true and fair view | Whether the CIS rules have been complied with |
| Focus | Material misstatement (fraud/error) | Whether accounting records are adequate and whether the financial statements agree with the records |
| Reporting method | Audit opinion | Exception report (“no exceptions” in this report) |
这一双轨结构在审计实务中意味着:审计师不仅需关注 FRS 102 与 SORP 的合规性,还必须将 Collective Investment Schemes sourcebook 视为独立的合规风险来源。续篇明确提到“those parts of the sourcebook which may directly impact on the determination of amounts and disclosures”,说明基金审计的合规边界已从“账务真实性”扩展到“核算规则依附性”——例如估值定价、分配政策等受 sourcebook 直接管制的领域,一旦违规便可能同时形成合规风险和账务错报。
In audit practice, this dual-track structure means that the auditor must not only focus on compliance with FRS 102 and the SORP, but must also treat the Collective Investment Schemes sourcebook as an independent source of compliance risk. The follow-up explicitly cites “those parts of the sourcebook which may directly impact on the determination of amounts and disclosures,” indicating that the compliance boundary of fund audits has expanded from “authenticity of the accounts” to “dependency on accounting rules” — for example, areas directly regulated by the sourcebook such as valuation pricing and distribution policies; once violated, they can simultaneously give rise to compliance risk and accounting misstatement.
综合以上分析,本续篇在报告结构上并未引入新的意见类型,但其真正价值在于:它将基金审计中“多子基金基础分置”“合规与审计双重义务”“舞弊风险针对性设计”这三个相互缠绕的要素,以清晰的分节方式逐一拆解,最终形成一个兼具法律严谨性与实务导向性的审计结论框架。
Taken together, this follow-up introduces no new opinion type in the report structure, but its true value lies in disentangling, section by section, the three interwoven elements of fund auditing — “bifurcated bases across multiple sub-funds,” “dual compliance and audit obligations,” and “targeted fraud-risk design” — ultimately forming an audit conclusion framework that combines legal rigor with practical orientation.
续篇分析(第 3/23 部分)
Follow-up Analysis (Part 3/23)
I. The "Legal Fence" of Audit Reports: The Deep Logic Behind Use-Restriction Clauses
This paragraph contains the typical report-use restriction (Use of this report) wording, whose legal structure is worth unpacking:
1. Dual regulatory anchoring: The report expressly cites `paragraph 4.5.12 of the Collective Investment Schemes sourcebook` and `paragraph 67(2) of the Open-Ended Investment Companies Regulations 2001`. This is not decorative language; it strictly confines the report's legal effect within the statutory regime of the UK's FCA regulatory framework.
2. Exclusivity of beneficiaries: "for and only for the Company's shareholders as a body" — note that the emphasis is on shareholders as a body, not as individual shareholders. This means an individual shareholder cannot claim reliance on the report to bring proceedings in a personal capacity; instead, the shareholder must act in the capacity of the company as a whole. This is a typical mechanism for insulating auditor liability (liability disclaimer) under English law.
3. The boundaries of the "for no other purpose" statement: "for no other purpose" is not an absolute disclaimer; instead, it narrows the auditor's liability to third parties to the exceptional circumstance of "prior written consent" (`prior consent in writing`). Through this clause, the auditor constructs a predictable scope of liability, avoiding the risk of claims from "unknown users" when the report is put to other uses (e.g., M&A due diligence, loan approval).
Notable contrast: Under the EU audit regulation (EU Regulation 537/2014), audit reports for public-interest entities (PIEs) are prohibited from attaching such restrictive statements. However, an ICVC, as a collective investment scheme, does not fall within the PIE category, and therefore retains this UK-specific liability-insulation design.
II. Audit Observations on the Disclosure of the "Closed Sub-Fund"
Baillie Gifford Emerging Markets Bond Fund is the most notable accounting judgment case in this report:
| Dimension | Treatment of the Closed Fund | Normal Treatment of a Going-Concern Fund |
|---|---|---|
| Accounting basis | Non-going concern | Going concern |
| Asset classification | Investments reclassified from fixed assets to current assets | Investments classified under fixed assets |
| Valuation basis | Fair value ≈ residual value | Fair value (premised on continued trading) |
| Termination costs | Borne by the ACD (Authorised Corporate Director) | Borne by the fund's assets |
Three observations from an audit perspective:
1. The gap between the audit report date (28 November 2025) and the closure date (22 April 2024) is approximately 19 months — this means the sub-fund's final liquidation was completed more than a year earlier, yet this annual report still includes it in the consolidated reporting scope, reflecting the impact of the regulatory wind-down period on the reporting boundary. As the sub-fund had been fully liquidated and no longer had any auditable going-concern transactions, the statements were in substance a "static mirror with no activity."
2. The logic of the "fair value ≈ residual value" argument: management claims that the value of investments reported at fair value "materially equate" to the sub-fund's residual value, meaning that remeasuring on a liquidation basis would produce no difference. When confronted with this judgment, the auditor must assess whether there are risks of liquidation discounts, unrecoverable assets, or legacy liabilities not reflected.
3. Fee-bearing arrangement: the ACD bears the liquidation-related costs rather than the remaining assets, which avoids further erosion of the fund's assets while also eliminating potential liability exposure for "liquidation fees payable" in the balance sheet, ensuring that net assets equal the distributable residual proceeds.
三、会计政策中的"时间错位"信号:SORP版本的选择
本报告采用的会计政策遵循 May 2014版的SORP,而非英国财务报告委员会(FRC)于 2024年8月发布的修订版SORP(适用于2025年1月1日或之后开始的会计期间)。本报告期末为2025年9月30日,对应的会计年度起始日为2024年10月1日——早于新SORP的生效起点,因此2014版SORP的适用在技术上合法。
但这揭示出一个过渡节点:自2025年10月1日起的新会计年度,该ICVC必须全面切换至新版SORP。审计师在本报告中未提及这一后续事项(subsequent event)的预期影响,但从审计连续性角度,下一年度报告中应披露向新SORP过渡的会计政策变更及其对财务报表的影响。新SORP的主要变化将涵盖:
- 更广泛的ESG披露要求;
- 对投资估值流程治理的强化;
- 对流动性风险管理和压力测试披露的细化。
4. Reverse-Engineering the Revenue Recognition Policy: The Effective Interest Method Based on Purchase Price
`Debt Securities: Income on debt securities is recognised on an effective interest basis by reference to the purchase price` — this sentence appears unremarkable on the surface, but it carries deeper meaning:
"Purchase price" rather than "amortised cost" means:
- For bonds purchased at a discount, the effective interest rate is higher than the coupon rate; interest income is recognised periodically over the bond's life at the effective interest rate, rather than realising the discount gain in a lump sum at maturity.
- For bonds purchased at a premium, the effective interest rate is lower than the coupon rate; the premium is amortised over the remaining life through the effective interest method, smoothing the fund's distribution income.
- This approach allows the fund's interest distribution to match its holding-period returns (matching principle), avoiding the overstatement/understatement of income that would result from simply recognising interest at the coupon rate.
Key difference from IFRS 9: The expected credit loss (ECL) model under IFRS 9 requires impairment provisions for debt instruments, but the revenue recognition policy in this report does not mention any impairment measurement. This suggests that the debt securities in the fund's portfolio may be measured at fair value through profit or loss (FVTPL), so no separate credit loss provision is required — changes in fair value already incorporate credit risk movements.
5. Treatment of Expenses Allocated to Capital: An Often-Overlooked Accounting Choice
`For the purpose of calculating the distribution, all expenses are allocated to capital` — this statement reflects the distribution system design unique to UK authorised funds:
- Meaning: When calculating distributable income, operating expenses (management fees, custody fees, audit fees, etc.) are deducted entirely from capital, rather than from revenue.
- Effect: This allows the "income distribution" (interest distribution) to reflect the full picture of interest and dividend income to the fullest extent, so that expenses do not erode the fund's distribution capacity, thereby ensuring that investors taxed by income type (interest) can receive the full income distribution.
- Structural consequence: This may lead to sustained shrinkage of the capital account (capital erosion). For investors who hold to maturity, the reduction in the capital account will be reflected as a lower return of capital at liquidation; for investors who withdraw income on a monthly/quarterly basis, this structure maintains stable cash flows.
- Audit focus: Auditors need to verify whether the capitalisation of expenses complies with paragraph 6.5 of the SORP and the COLL rules, and whether the distribution calculation meets regulatory requirements.
Tax linkage: `Corporation tax is charged at 20% of the revenue liable to corporation tax less allowable expenses and, where applicable, interest distributions made` — after expenses are deducted from capital, the portion that qualifies as "allowable expenses" can be used to offset taxable income when calculating corporation tax. This dual attribute (capital deduction + taxable income reduction) means that expense treatment has a subtle impact on the fund's tax burden.
6. VAT Recoverability Treatment
`VAT is written off to the extent that it is not considered to be recoverable` — this statement reveals a practical issue: the VAT recoverability of UK authorised funds is typically limited by their income structure (interest income is the primary source, and interest income is usually exempt from VAT). The non-recoverable portion of VAT is borne as a fund expense, and in audits this treatment is validated in the form of "management estimates", i.e., a judgment is made on the recoverable proportion.
7. Differentiated Management of Distribution Policies
| Sub-fund | Distribution Frequency | Distribution Type |
|---|---|---|
| Baillie Gifford Strategic Bond Fund | Monthly | Interest distribution |
| All other sub-funds | Quarterly | Interest distribution |
This design reflects a product management logic in which the liability side (investor cash flow needs) determines the asset side (portfolio construction) strategy: funds that distribute monthly require more stable cash flow generation capability, and therefore the coupon structure and maturity distribution of the portfolio tend to be more evenly arranged, avoiding cash flow gaps caused by the maturity of any single bond. Sub-funds that distribute quarterly enjoy greater flexibility in bond tenors and reinvestment pacing.
8. Tax Status — Significance of the "Full Pass" on the Qualifying Investments Test
All sub-funds satisfy the qualifying investments test under SI 2006/964 Regulation 19, and therefore all distributions are treated as interest distributions. This status has profound tax implications for investors:
- UK individual investors: Interest distributions are taxed at progressive income tax rates (up to 45%) and are not eligible for the dividend allowance;
- UK corporate investors: Interest distributions constitute taxable income under "non-trading loan relationship" rules, but may benefit from corporation tax relief;
- Non-UK residents: Under bilateral tax treaties, interest distributions may be eligible for a lower withholding tax rate.
For auditors, compliance with the QIT test forms part of the "regulatory audit". Its verification relies on item-by-item classification testing of the assets held by each sub-fund. The conclusion that all sub-funds have passed indicates that the non-qualifying assets in the portfolios (including equities, real estate, unlisted securities, etc.) are all within the 5% threshold permitted by the regulations.
IX. FRS 102 Definition of the Fair Value Hierarchy: Similarities and Differences with IFRS 13
| Item | FRS 102 (This Report) | IFRS 13 |
|---|---|---|
| Level 1 | Unadjusted quoted price for an identical instrument in an active market | Unadjusted quoted price for an identical asset/liability in an active market |
| Level 2 | Uses observable inputs other than Level 1 quoted prices | Inputs observable directly or indirectly, other than Level 1 quoted prices |
| Level 3 | Uses unobservable inputs | Unobservable inputs based on the best available information |
The two are nearly identical. However, FRS 102's wording for Level 1 uses "identical instrument" rather than IFRS 13's "identical asset or liability," reflecting the particularity of "financial instruments" as the primary held assets in the ICVC context.
Auditor's verification of hierarchy classification: For Level 3 assets, an independent pricing review is required, typically involving validation of pricing models by third-party valuation service providers, comparability analysis, and management's assessment of the reasonableness of unobservable parameters (e.g., discount rates, volatility). This report contains no material disclosures of Level 3 assets, implying that most assets in the portfolio have active market quotations and relatively low pricing uncertainty.
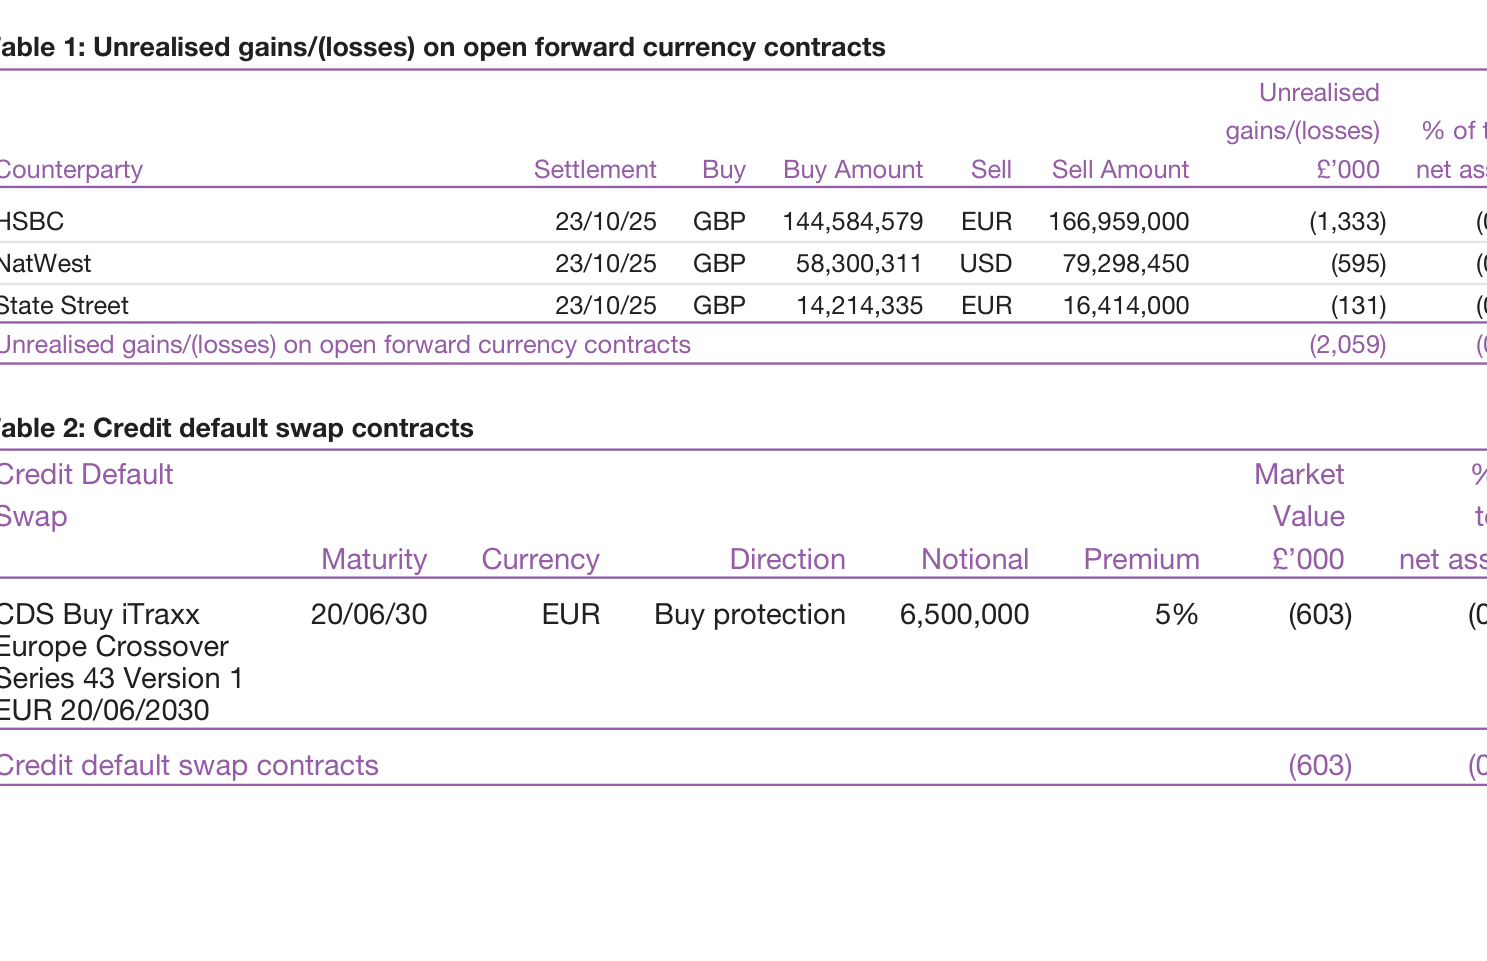
10. Accounting Treatment of Financial Derivatives: Differential Measurement of Three Contract Types
| Derivative Instrument Category | Daily Mark-to-Market Method | Treatment of Unrealized Gains/Losses | Recognition of Realized Gains/Losses |
|---|---|---|---|
| Currency contracts (spot/forward) | Exchange rate movements calculated daily | Recorded as unrealized gains/losses | Recognized upon delivery or hedge settlement |
| Futures contracts | Variation margin calculated at daily settlement price | Directly as realized gains/losses | Price difference from initial opening to closing, incrementally recognized through daily settlements |
| Swap agreements | Based on market maker quotes | Recorded as unrealized gains/losses | Upon termination, gains/losses calculated from clearing amounts; clearing costs included in realized gains/losses |
Notable Details:
1. "Forced realization" treatment of futures: The variation margin of futures contracts is directly treated as realized gains/losses, rather than unrealized gains/losses—this is industry practice for futures contracts under UK GAAP, because daily margin settlements are already "realized" in cash.
2. Attribution of swap clearing costs: `Costs relating to the clearing of swaps are included as part of realised gains or losses`—reflects the new trend after the widespread adoption of central clearing, where clearing fees are deducted from gains as part of transaction costs. This differs subtly from IFRS, which includes such costs as transaction fees or in the initial recognition amount.
3. Netting arrangements for currency contracts: `if a spot or forward currency contract is offset by entering into another spot or forward currency contract with the same broker, upon settlement of the net gain or loss`—this reflects the netting arrangements under the ISDA Master Agreement, reducing the number of cash flows and lowering counterparty risk exposure.
11. Disclosure Boundaries for Contingent Assets/Contingent Liabilities
`A sub-fund will not recognise an asset or liability in the financial statements` — Under the existing IAS 37/FRS 102 framework, sub-funds adopt a "non-recognition, disclosure-only" model for contingent items. The audit implications of this policy are:
- Auditors need to assess whether each disclosed contingent item indeed meets the trigger conditions for recognition;
- More importantly, auditors need to focus on whether management has omitted contingent items requiring disclosure (such as pending litigation, tax disputes, and regulatory investigations);
- No substantive disclosure of contingent items is observed in this report, indicating low compliance and litigation risk exposure at the reporting date — but this in itself also carries audit implications: auditors need to obtain sufficient evidence for management's assertion that "no material contingent items exist."
XII. Three-Tier Governance Structure and Key Characteristics of the Risk Management Framework
| Tier | Entity | Core Responsibilities |
|---|---|---|
| First Tier | ACD (Authorised Corporate Director) | Overall risk governance; formulates risk management policies |
| Second Tier | The ACD's permanent risk management function | Identifies, monitors, and assesses sub-fund risks; submits quarterly reports |
| Third Tier | Depositary | Independent oversight; supervises asset custody and compliance |
| Support Tier | Investment Adviser | Provides market risk management expertise and technical support |
Three Structural Observations:
1. "Borrowing" strategy: There is a "builds on existing parts" relationship between the ACD's risk management team and the investment adviser's risk management framework, aimed at avoiding duplication. This is both an efficiency choice and a sign that whether the investment adviser's risk models and parameters are applicable at the fund level requires independent calibration by the ACD, rather than simple mirroring.
2. Quarterly monitoring frequency: The frequency of risk reporting is quarterly, which is consistent with the fund's quarterly reporting cycle, but lower than the monthly/weekly risk reporting frequency of banks or insurance companies. For bond-heavy portfolios (predominantly interest rate and credit risk), quarterly monitoring may already be outpaced by market liquidity changes—auditors need to pay particular attention when assessing the adequacy of risk management.
3. Lack of risk-category hierarchy: The document lists market risk, credit risk, liquidity risk, and operational risk, but does not separately distinguish model risk, concentration risk, or compliance risk. In bond funds, the former two (particularly interest rate curve inflection points and issuer concentration) may be more material sources of risk.
Thirteen. The "Closed-Loop" Logic of Market Risk Management
`Asset allocation is determined by the Investment Adviser... Divergence from the target asset allocation is strictly controlled and the portfolio closely monitored in terms of risk`
This reveals a dual closed-loop risk control mechanism:
- Deviation Control Loop: The investment adviser sets the target asset allocation, continuously monitoring with "strictly controlled divergence" (`strictly controlled`) as the benchmark;
- Risk Sensitivity Loop: Independently assesses the portfolio's risk characteristics (duration, credit spread, convexity, etc.) to ensure that even when the portfolio deviates from the target allocation, risk exposure remains within an acceptable range.
This dual control system provides auditors with a verifiable benchmark at the portfolio level: audits can verify the effectiveness of this "strict control" by sampling-checking dimensions such as whether trading instructions fall within authorized limits, whether portfolio duration deviates from the target range, and whether the credit rating distribution is compliant.
XIV. Forward-Looking Signals: Key Expectations for the 2026 Annual Report
1. Application starting point of the new SORP: The new accounting year beginning October 1, 2025 will mandatorily adopt the 2024 revised SORP; attention should be paid to the first-time application adjustments arising from changes in accounting policies.
2. Deepening of risk management disclosures: In recent years, the FRC's requirements regarding corporate governance and the Financial Conduct Authority (FCA) have trended toward strengthening the quantitative degree of risk disclosure. The next annual report may see the first-time disclosure of indicators such as VaR (Value at Risk) and the liquidity coverage ratio (LCR).
3. Final exit of the closed fund: The Emerging Markets Bond Fund was last listed as a discontinued sub-fund in the current annual report. In the 2026 report, this sub-fund is expected to be fully removed from the fund structure.
IV. Deep Mechanism Analysis of Derivatives and Risk Management
4.1 The "Dual-Track" Uses of Derivative Strategies and Their Inherent Tensions
The text classifies derivative uses into two levels: hedging/efficient portfolio management and achieving investment objectives—a formulation typical of fund legal documents. What merits deeper analysis is:
- The phrase "achieving investment objectives" leaves room for derivatives to be used for non-hedging purposes, which is materially different from the language used by pure hedging funds. In practice, this means sub-funds can construct synthetic exposures, implement interest rate curve strategies (such as steepening/flattening trades), or conduct relative-value arbitrage through derivatives.
- The text emphasizes that derivatives are conducted "on a covered basis," which constrains derivatives from generating uncovered naked positions. However, the meaning of "covered" differs significantly across asset classes—for bond futures, coverage means holding the corresponding cash bonds or cash reserves; for interest rate swaps, coverage requires holding liquid assets with matching maturities. This flexibility leaves a certain degree of operational room for the investment adviser.
| Strategy Type | Risk-Taking Characteristics | Impact on Overall Risk |
|---|---|---|
| Active currency management | Directional positions opposite to benchmark currency exposure | May increase hedging costs for exchange-rate fluctuations or amplify short-term P&L volatility |
| Bond curve strategies | Relative-value trades based on changes in the yield curve shape | Duration-neutral but with significant curvature risk exposure |
| Market spread strategies | Spread trades across different credit ratings/sectors | Driven by changes in credit spreads, with non-linear P&L characteristics |
The above strategies operate under the expected judgment of "no adverse impact on overall risk," but that judgment relies on measurement results from the VaR framework—which means the tail risks brought by derivatives (such as sharp distortions in the yield curve or sudden depletion of liquidity) may be obscured by the informational limitations of the VaR model itself.
4.2 Limitations of the VaR Framework and Implications of the Textual Wording
The text's description of VaR contains two points worth noting.
First, VaR is defined as "the potential loss arising from adverse market movements over a specified time horizon and confidence level." However, the text does not disclose the key parameters—the time horizon (whether 1-day or 10-day), the confidence level (95% or 99%), or the historical observation period used. This lack of disclosure makes it impossible for investors to compare market risk levels across different sub-funds on a like-for-like basis. The UK UCITS regulatory framework (e.g., FCA COLL rules) imposes minimum requirements for VaR disclosure, but the wording here reads more like a compliance floor than proactive transparency.
Second, VaR as a risk measurement tool has well-known structural deficiencies. It is built on the assumption of normal distribution and linear correlation structures, and thus cannot fully capture:
- The "fat-tail" risk in extreme market events
- Correlation breakdown among different risk variables under stress scenarios
- Feedback-loop effects triggered by liquidity discounts and margin calls
> Supporting evidence: According to a 2024 study by the Bank for International Settlements (BIS), during the banking stress event of March 2023, interest rate swap spreads in several major markets moved by more than five times the level predicted by VaR models at a 99% confidence level within 24 hours. This case illustrates that relying solely on the VaR framework may understate the potential impact of derivative investments arising from nonlinear and co-movement risks.
| Measurement Dimension | VaR Approach | Stress Testing / Scenario Analysis |
|---|---|---|
| Relationship between risk variables | Based on historical correlations, static treatment | Allows for correlation breakdown under extreme conditions |
| Tail risk capture | Truncated by the confidence level; unable to measure extreme loss magnitude | Can simulate extreme scenarios beyond the 99.9% percentile |
| Liquidity dimension | Implicitly assumes assets can be liquidated without market impact | Can incorporate liquidity discounts and market impact costs |
| Regulatory application | Core metric under the Basel internal models approach | Basis for supplementary regulatory capital requirements |
The text mentions only VaR and does not indicate the concurrent use of other risk measurement tools. This may imply that the investment adviser relies excessively on a single metric in its internal risk management, leaving uncertainty about its actual ability to control risk.
4.3 Structural Characteristics of Foreign Exchange Risk Management
The text decomposes foreign exchange risk into three levels: investment value fluctuation, transaction timing differences, and income conversion. This three-way classification is fairly comprehensive for open-ended funds, but several points deserve additional attention:
On settlement timing risk: The text states that "foreign exchange contracts are executed on the trade date where feasible." The qualifier "where feasible" leaves some flexibility. From an operational perspective, if an investment adviser manages multiple sub-funds simultaneously and trades in different currencies, netting at the portfolio level may be necessary rather than hedging each transaction individually. While this approach reduces transaction costs, it also means that an individual sub-fund may be exposed to unhedged foreign exchange risk before the settlement date.
On income conversion arrangements: The text promises to convert income into pounds sterling "on or shortly after the receipt date." However, under highly volatile market conditions, if the income source currency is an emerging market currency (such as the Brazilian real, Turkish lira, etc.), even converting within a short period may still entail significant pricing slippage and additional liquidity costs.
An angle overlooked by the text but worth pointing out: The forward contracts used in foreign exchange risk hedging themselves introduce basis risk. If there is a maturity mismatch between the currency in which a sub-fund's assets are denominated (e.g., the euro) and the currency used by the hedging instrument (e.g., a euro/sterling forward), changes in the forward basis can also affect hedging efficiency. The text does not discuss this layer of risk.
4.4 The Inadequacy of Reducing Interest Rate Risk Disclosure to a Single Dimension
The report describes interest rate risk in only one sentence: "bond yields are linked to the base bank rate or an equivalent rate." This expression suffers from excessive information compression:
- The sensitivity of bond prices to interest rate changes depends mainly on duration and convexity. Different sub-funds may experience vastly different NAV declines under the same interest rate move—a sub-fund with an average duration of eight years would be estimated to fall by approximately 8% when rates rise 100 basis points (bps), while a fund with a three-year duration would fall only about 3%.
- Interest rate changes affect bonds of different credit ratings through different mechanisms: a rate rise exerts less pressure on high-grade government bonds, but for high-yield bonds, rate changes are often accompanied by credit spread widening. Under this double blow, NAV declines may far exceed the simple estimates of duration models.
| Sub-fund Duration Level | Estimated NAV Decline on a 100bps Rate Rise | Estimated NAV Gain on a 100bps Rate Decline |
|---|---|---|
| Short duration (1–3 years) | −1% to −3% | +1% to +3% |
| Medium-to-long duration (3–5 years) | −3% to −5% | +3% to +5% |
| Long duration (>7 years) | −7% or more | +7% or more |
| Long duration plus credit spread | Over −10% (stress scenario) | Nonlinear rebound (constrained by the pace of credit repair) |
Supplementary Note: The phrase "bank rate or equivalent rate" used in the report is overly narrow. The rate benchmarks that actually affect bond pricing are risk-free rates such as SONIA (sterling), SOFR (U.S. dollars), and €STR (euro), as well as swap rates of corresponding maturities. If interest rate risk is understood only as adjustments to central bank policy rates, the different effects on sub-funds of a parallel shift, steepening, or flattening of the yield curve would be severely underestimated.
4.5 The Concentration-Diversification Paradox in Counterparty Risk Management
The text states an idealized objective for the logic of selecting trading counterparties—requiring both top-tier ratings and a balance between concentration and diversification—but it sidesteps several key details:
Concentration paradox: Globally, financial institutions with "top-tier ratings" that engage in complex derivatives trading are highly concentrated (dominated by large banks such as Bank of America, JPMorgan, Goldman Sachs, and HSBC). This means that, given the premise of "ensuring counterparties are top-tier institutions," counterparty diversification is mathematically constrained. In the extreme case, all sub-funds may in practice face the same set of systemically important banks—which is itself an implicit concentration risk.
Clearing method for derivatives left unspecified: The text does not distinguish whether OTC derivatives are subject to central counterparty clearing (CCP clearing) or bilateral clearing. These two approaches differ significantly in their risk mitigation mechanisms: CCP clearing provides multilateral risk-sharing through margin requirements and a default fund, while bilateral clearing relies on daily mark-to-market of initial margin and variation margin. If a sub-fund's OTC derivatives are mainly conducted under a bilateral clearing framework, the losses it would face upon a counterparty default would depend on the sufficiency of collateral and the completeness of the legal enforcement framework.
Implicit risks in DVP and non-DVP settlement mechanisms: The text notes that "stock settlement is generally conducted on a DVP basis," but only briefly mentions "the exceptions traded on a non-DVP basis." In practice, these "exceptions" typically involve forward settlement contracts or certain emerging market bonds, whose settlement cycles may last several days or even weeks. During this period, funds are paid out without the corresponding assets being received (or vice versa), creating principal risk that is not separately disclosed.
4.6 Liquidity Risk Management: Well-Formulated but Standards Difficult to Verify
The textual description of liquidity risk is complete in its framework—considering factors such as investment strategy, liquidity profile, redemption policy, asset market liquidity, time required for liquidation, and price. However, from the perspective of auditing and investor oversight, several gaps remain:
Quantitative indicators are not disclosed: The text does not mention the high-quality liquid assets (HQLA) ratio held by the sub-fund or any stressed liquidity coverage metric. Investors cannot use this to assess whether the sub-fund could meet redemption demands under concentrated redemption pressure without selling assets at significant discounts.
Liquidity classification methodology is not explained: Some regulatory frameworks (e.g., the SEC liquidity rule issued in 2022) require funds to classify assets into four tiers—"highly liquid / moderately liquid / less liquid / illiquid"—and set a cap on illiquid assets (typically 15% of net assets). Although the UK UCITS framework has such a requirement, the text does not state whether the same level of transparency is applied at the disclosure level.
Implicit reliance: The text states that "liquidity levels are based on an assessment of relative liquidity," but that assessment itself relies on the investment adviser's subjective judgment. The same bond may be classified differently by different institutions—for example, a eurozone peripheral sovereign bond with nine years remaining to maturity is considered a highly liquid asset under normal conditions, but in a scenario of sovereign credit stress, its market depth may suddenly fall to less than one-tenth of its original level.
4.7 Operational Risk: Hidden Exposure from Dependence on Outsourced Architecture
The text notes that operational risk includes failures of Baillie Gifford's own systems and those of third-party service providers. Notably, Baillie Gifford's operating model is a highly centralized in-house operation—entrusting fund management, custody, clearing, and valuation to affiliated entities within the group and a few key third parties. This centralized model offers advantages in smooth information flow and cost efficiency, but it also introduces key person risk and the risk of a single point of failure in its systems.
Supplementary information: Public information shows that Baillie Gifford's investment decisions rely heavily on its internal research platform, meaning its operating systems not only handle trading and settlement but also carry the entire infrastructure for investment logic, risk assessment, and compliance monitoring. A single system failure could therefore cause not just delayed reporting, but interruption of investment decision execution. Although the text states there is a "comprehensive business continuity plan," it does not disclose the plan's recovery time objective (RTO) or recovery point objective (RPO)—that is, how long it would take to resume operations after a system outage and how much data loss is tolerable.
Audit perspective note: The text mentions that "the ACD reviews Baillie Gifford's report on internal controls," but it does not clarify whether that report is subject to independent external audit assurance (e.g., ISAE 3402 / SSAE 18 SOC 1 reports). Investors seeking to verify the credibility of its internal control statements would need to request further information from the ACD.
4.8 Fair Value: The Rationality and Boundaries of Market-Based Pricing
The text defines fair value simply as "determined by market value or the investment adviser's valuation" and "determined by reference to available prices in the market where the instrument trades." Such phrasing is adequate for compliance purposes, but still falls short of the principle of full disclosure:
Valuation hierarchy not disclosed: IFRS 13 (International Financial Reporting Standard 13 – Fair Value Measurement) requires fair value measurements to be disclosed in a three-level hierarchy: Level 1 (quoted prices in active markets), Level 2 (valuation techniques based on observable inputs), and Level 3 (valuation techniques based on unobservable inputs). Fund annual reports typically describe the distribution across levels in the notes to the financial statements, but the text provides no such overview.
Valuation governance structure absent: For assets in active markets, pricing is generally reliable; but for less liquid or complex structured derivatives, valuations may depend on model assumptions. The investment adviser's role on the valuation committee, the valuation review process independent of the investment team, and the dispute-resolution mechanism for price anomalies—these are the institutional prerequisites for fair value to remain "fair," yet the text remains silent on them.
4.9 Core Structural Assessment of Remuneration Policy
The Remuneration Report section contains limited substantive information, but several points are worth noting:
The balance between fixed and variable compensation is the core guarantee of stability. Fixed compensation (salary and pension) ensures that employees still receive basic income security in down-market years and do not develop a tendency to aggressively chase risk as a result of short-term losses. Within variable compensation, the "Long-Term Profit Award" covers all employees and is not allocated on the basis of individual performance, offering an alternative framework that emphasizes collective responsibility, in contrast to the investment-bank-style performance bonus culture.
A point worth noting from the perspective of investor interests: The text explicitly states that performance compensation metrics are "typically shared across the company." This means that the link between individual bonuses and individual investment performance is relatively weak. For investors, this implies that the correlation between the compensation incentives of key fund managers and the alpha (excess return) of the funds they manage is relatively low. This is both a firewall against excessive risk-taking and a factor that may deprive the best investment talent of sufficient financial incentives—thereby affecting talent retention and long-term performance—a dimension that warrants continued observation.
Effectiveness of the deferral mechanism: 10% to 50% of bonus amounts are reinvested in funds aligned with the company's overall investment style, an arrangement consistent with the direction of the FCA's philosophy on deferral of variable compensation. The deferral ratio spans a wide range, but the report does not specify the criteria used to determine the deferral ratio, leaving uncertainty for investors assessing long-term alignment of interests.
4.10 Overall Assessment: Sufficient Institutional Completeness, Limited Quantitative Transparency
From the perspective of the document's overall architecture, this risk disclosure document covers major dimensions including derivatives, market risk, foreign exchange, interest rates, counterparties, liquidity, operational risk, valuation, and remuneration; the completeness of the institutional framework is commendable. From the standpoint of information increment, however, the wording of almost all risk items remains at the level of qualitative description:
- Missing key parameters: the time window and confidence level for VaR, stress test results, the duration distribution of interest rate exposure, the ratio of derivative notional exposure to net assets, and quantitative thresholds for counterparty concentration
- Ambiguous risk appetite boundaries: the sub-fund's risks and exposures are "within predetermined limits," yet the "predetermined limits" themselves are not specified
- Insufficient key data for investor decision-making: liquidity classification criteria and the determinants of the deferred remuneration ratio
Under the UK UCITS compliance framework, this document satisfies the minimum statutory requirements for information disclosure. For institutional investors seeking to fully understand the risk-return profile of the sub-fund, however, the information in the document alone is insufficient to construct an independent quantitative risk assessment model — cross-validation against more detailed periodic reports (such as the value-at-risk disclosures and portfolio breakdowns in the annual report) is required.
A textual blind spot worth highlighting: the document repeatedly emphasizes how each risk is monitored, managed, or mitigated, yet does not disclose any risk events or stress experiences that have actually occurred. Although this approach of sidestepping historical lessons is common in industry documents, it nonetheless weakens the persuasiveness of the risk disclosures and their practical instructive value.
The "Structural Mismatch" in Remuneration Disclosure: The Time Lag Between Liquidating Funds and the Manager's Personnel Costs
The most noteworthy new information in this installment is the distinctive pattern of remuneration disclosure as liquidation nears its conclusion. According to the data, as of March 31, 2025, Baillie Gifford & Co Limited still had 54 employees allocated to UK UCITS-related business, generating fixed remuneration of £1.61 million and variable remuneration of £0.26 million. These figures reveal a frequently overlooked fact:
- Extremely low variable remuneration share: 26/161 ≈ 16.1%. For an asset manager that typically drives compensation through performance, this ratio is unusually low, reflecting that this business segment has entered an operational contraction phase — fund liquidation has driven management fee income to zero, and the variable compensation pool has naturally dried up.
- High concentration among Material Risk Takers (MRTs): the 29 MRTs earned total remuneration of £1.75 million, accounting for 93.6% of the total remuneration of the 54 employees (£1.87 million); the remaining 25 employees received only approximately £120,000 in total, or less than £5,000 per person on average. This suggests that the day-to-day operations related to the fund have largely ground to a halt, and the remaining compensation expenditure is primarily directed to partners and core functions such as risk control and compliance for final liquidation duties.
| Category | Headcount | Total Remuneration (£'000) | Per Capita (£'000) |
|---|---|---|---|
| Fixed Remuneration | 54 | 1,610 | 29.8 |
| Variable Remuneration | 54 | 260 | 4.8 |
| MRT Total | 29 | 1,750 | 60.3 |
| Non-MRT (estimated) | 25 | 120 | 4.8 |
This "structural mismatch" further illustrates that the administrative costs and personnel stickiness of fund liquidation far exceed investors' usual assumption that "liquidation is the end" — even after the liquidation distribution of net assets has been completed, the management company must still retain certain staff to handle legal closure, audit filings, and potential recovery matters (such as Ukrainian assets).
Residual Liabilities in the "Empty" Accounts: Audit Obligations Persist Until Legal Termination
The FY2025 financial statements exhibit typical late-liquidation "empty shell" characteristics: portfolio, net assets, income, and capital movements are all zero. Yet a finer observation lies in two categories of non-zero items:
1. Audit fees of £5,000 (2024: £11,000, down 55% year-on-year): The fund no longer holds any assets to audit, but the legal entity has not yet been dissolved, so the audit obligation remains. This constitutes a "minimum operating cost," which is fully offset by the ACD through expense rebates (-£5,000), resulting in a net impact of zero. This indicates that liquidation costs are effectively borne by the manager rather than investors.
2. Assets = liabilities = £10,000: On the asset side, there is a £5,000 overseas tax recoverable and a £5,000 receivable from the ACD; on the liability side, there are corresponding payables. In the same period of 2024, assets and liabilities were £658,000, with net assets also at zero. By 2025, transactional cash flows have been cleared, leaving only the "tail" of tax liquidation and related-party settlement.
This "uneven zero" — where book net assets are zero but corresponding balances remain on both the asset and liability sides — constitutes asymmetric zeroing in fund accounting: liquidation distributions have been proportionally paid out, yet the legal entity has not been terminated, with tax matters (such as overseas tax credits) remaining the final unresolved hurdle.
The Intractable Problem of the "Derecognized Asset" Structure and Accounting Treatment for Ukrainian Assets
The investment report notes that the Ukrainian cash, affected by the war, continues to be presented at a fair value of zero, with "further payment to be made if value is realized in the future." This contains an accounting paradox worth examining:
- From the perspective of the financial statements, the asset has been fully derecognized. It appears neither in the investment portfolio nor among debtors, leaving no trace on the balance sheet.
- From a substantive standpoint, however, investors have not lost their beneficial interest in the asset—"further payment to be made if value is realized in the future" implies that a contingent right still exists.
Under general accounting standards (such as FRS 102/IAS 37), contingent assets are not recognized but should be disclosed in the notes. This report chose to disclose the matter in the "investment report" rather than in the "accounting policy notes," and did not quantify any probability—reflecting the reluctance of both auditors and managers to make any positive or negative judgment on asset recoverability under extreme geopolitical uncertainty. Compared with the 2024 annual report, where the Ukrainian asset was still included in some form in net capital losses (part of the -£3,675 thousand, against total 2024 net capital losses of £5,312 thousand), the complete "write-down to zero" in 2025 marks a shift in accounting treatment from "impairment estimation" to "indefinite suspension"—unless the war ends or a diplomatic solution is reached, this asset will remain permanently off the balance sheet.
The "Template Inertia" of Tax Rate Disclosure: Conflict Between 20% and the UK's 25% Corporation Tax Rate
There is an obvious time lag in the tax note: the report states "The Fund is subject to corporation tax at 20% (2024: 20%)", but since April 2023 the UK's main corporation tax rate has risen from 19% to 25% (applying to entities with profits above £250,000). The fund's 2024 pre-tax income was as high as £9.765 million, far above the £250,000 threshold, so in theory it should be subject to 25% rather than 20%.
However, as a bond fund, its interest distributions are fully deductible against taxable income (a deduction of £1.953 million in 2024), leaving the actual corporate tax liability at zero. The 20% rate therefore has no real cash impact. This error is more likely a historical leftover from the disclosure template (continuing the tax rate language from 2022 or earlier) than a calculation mistake — but it reveals the laxity in prudence in liquidation-period reporting: once all profits and distributions have been zeroed out, tax disclosure retains only formal significance, and the preparers' attention to detail declines accordingly.
This indirectly confirms: during the liquidation period, the information value of financial reports has shifted from "reflecting operating results" to "fulfilling legal compliance obligations," and readers should no longer treat such reports as a sampling proxy for corporate governance quality.
An Extreme Case of Transaction Cost Disclosure: £404 Million in Trades for a £6,000 Cost
Aggregating the 2024 data yields a striking comparison:
| Item | Amount (£'000) | Cost (£'000) | Cost Ratio |
|---|---|---|---|
| Bond purchases | 38,152 | 0 | 0.00% |
| Bond sales | 366,390 | 4 (tax) | 0.001% |
| Futures contracts | — | 2 | — |
| Total | 404,542 | 6 | 0.0015% |
With total bond trading volume of approximately £405 million, direct transaction costs were only £6,000, for a cost ratio of under 0.002%. This stands in stark contrast to equity funds, which typically incur commission costs of tens of basis points, and serves as an extreme confirmation of the zero-commission model of the OTC bond market. With all trading reduced to zero in 2025, this set of figures constitutes the fund's "final trading year" sample in its history—and is also the direct result of large-scale redemptions (£368.7 million) before liquidation: the fund emptied its portfolio at minimal cost, protecting residual value for holders.
Another observation here: the ratio of 2024 purchases (£38 million) to redemptions (£367 million) was nearly 1:10, with net redemptions of £329 million, indicating that the fund was almost entirely emptied within 12 months, while transaction costs remained nearly negligible. In a mass-redemption scenario, holders of low-transaction-cost instruments remain the beneficiaries—had redemptions of the same scale occurred in an equity fund, millions of pounds in transaction costs would have been borne by remaining holders.
This section presents key financial data and risk-model details from the reporting period. The most notable feature: the Baillie Gifford Emerging Markets Bond Fund was nearly "empty" by the end of fiscal 2025, while the Baillie Gifford High Yield Bond Fund recorded significantly negative returns. This state of uneven performance provides an important entry point for analyzing fund operations and the effectiveness of the risk-management framework.
1. Emerging Markets Bond Fund: Structural Gaps in Financial Data
1.1 Core Metrics All Zero or "n/a"
| Item | 2025 | 2024 | Analytical Implication |
|---|---|---|---|
| Share-class movements (all A/B/C classes) | All "-" | All "-" | No issuance, redemptions, or conversions during the year |
| Valuation hierarchy (Level 1/2/3) | 0 | 0 | No assets or liabilities held |
| Credit-rating holdings (Investment Grade / Other) | 0 | 0 | No bond positions |
| Currency exposure (Total) | 0 | £548,000 (UK sterling only) | Small sterling cash balance in 2024; cash reduced to zero in 2025 |
| Interest-rate risk assets | 0 | £548,000 | All floating/fixed-rate assets disappeared |
| VaR (Fund and Index) | n/a | n/a | Not computable due to zero positions |
This is not the report of a "normally operating fund"; it more closely resembles the state of a fund on the eve of liquidation or already terminated. In 2024 there were still monetary assets of £548,000, but by 2025 even the cash was gone, suggesting the sub-fund may have completed its liquidation or asset transfer during the reporting period.
1.2 Why Still Publish Full Disclosure?
A fund with no assets still produced a 20-plus-page annual report, including VaR model methodology, derivatives risk analysis, and more. This reflects:
- The rigidity of regulatory compliance: As a sub-fund of an ICVC, regardless of size, it must still fulfill complete disclosure obligations;
- Continuity of investor protection: Even if the fund is being liquidated, it must still account for the final state to share-class holders;
- Template-driven KID/financial reports: Much of the content (e.g., VaR model assumptions, stress scenarios) follows standard templates that are disconnected from the actual operating status.
An efficiency critique: In a fund report with zero assets, the length of risk disclosure far exceeds the actual risk exposure. This disclosure cost of "form over substance" is worth questioning.
2. A Methodological Examination of the VaR Model: Pointless Work Within a Rigorous Framework
2.1 The Deliberate Choice of Model Parameters
| Parameter | Setting | Assessment |
|---|---|---|
| System | FIS APT | Commonly used in the industry |
| Methodology | Variance-covariance (delta-adjusted) | Linear approximation; understates tail risk |
| Confidence level | 99% | Standard |
| Holding period | 1 month | On the longer side |
| Decay factor | 0 (no exponential smoothing) | Equal weights across 180 weeks |
| Historical observation period | 180 weeks (~3.5 years) | Neutral window length |
A decay factor of 0 is a notable point in the report. It means the model assigns equal weight to market data from three and a half years ago as to data from yesterday. This avoids the amplification of short-term volatility that would come from chasing recent moves, but it also makes the model slow to react to recent structural changes. For example, if the high-yield bond market shifts abruptly within the past six months, the model remains "diluted" by older data.
2.2 The Inherent Limitations of VaR and Semantic Games
The report honestly acknowledges five limitations:
- Reliance on historical correlations may understate large moves deviating from a normal distribution;
- Reflects only risk at daily market close and cannot capture intraday volatility;
- Does not show losses beyond the 99% confidence interval;
- Provides no indication of meaning in stressed markets;
- Actual trading outcomes will inevitably differ from model outputs.
However, when the fund's positions are zero, "VaR is n/a" is technically correct but informationally worthless. It cannot answer the question investors care most about: "If operations continued, what would the risk exposure be?" This disclosure is essentially "process compliance" rather than "substantive risk control."
2.3 Comparison with the High Yield Bond Fund: Risk Model vs. Actual Performance
The High Yield Bond Fund's performance chart reveals a "blind spot" in the VaR model:
| Period | High Yield B Shares | IA Sector Average | Relative Performance |
|---|---|---|---|
| 2020/09–2021/09 | +16.0% | +10.2% | +5.8pp |
| 2021/09–2022/09 | +13.0% | +10.6% | +2.4pp |
| 2022/09–2023/09 | +9.7% | +7.7% | +2.0pp |
| 2023/09–2024/09 | +7.8% | +7.7% | +0.1pp |
| 2024/09–2025/09 | -14.3% | -18.1% | +3.8pp |
Note: The sector average of -18.1% for 2024–2025 reflects extreme bear-market conditions. Although the fund outperformed by 3.8 percentage points relative to the sector, an absolute loss of 14.3% constitutes a major drawdown for a fund targeting "income and capital growth." If the VaR model had any early-warning value in live trading, one would expect to see the model's output for that year—but the report does not provide it. This is precisely the fault line between an "empty model" and true risk management: the model always exists, but whether it actually guided position decisions at the critical moment cannot be verified.
3. Cross-Comparison of Two Risk Disclosures: Emerging Markets vs. High Yield
| Dimension | Emerging Markets Bond Fund | High Yield Bond Fund |
|---|---|---|
| Investment universe | At least 80% emerging-market bonds (implied); other bonds permitted | At least 80% below-investment-grade bonds |
| Currency strategy | Multi-currency; hedging possible | Sterling-denominated or hedged back to sterling |
| Derivatives use | Investment + risk management | Investment + risk management |
| Expense capitalization | Not specified | All expenses allocated to capital |
| Risk rating | Not stated (no data) | SRI level 4 (low-to-medium risk) |
| Worst annual performance in past 5 years | n/a | -14.3% (2024–25) |
| Current operating status | Suspected liquidation / zero assets | Normal operations |
Key difference: The High Yield Bond Fund explicitly allocates "all expenses to capital," which reduces the fund's net asset value but may enhance distributable income. Within the 2024–25 net return of -14.3%, a portion represents "additional capital loss" caused by expense erosion. The cost of this approach is particularly evident in bear markets—investors bear not only market declines but also the full burden of expenses.
4. Conclusions and Implications
1. Divergence in fund operations: The zero-data state of the Emerging Markets Bond Fund reveals that the sub-fund has likely effectively exited the market; the High Yield Bond Fund remains active, but its performance shows the high-yield bond market is undergoing a deep correction.
2. The formalization of risk disclosure: More than 20 pages of risk descriptions (VaR methodology, stress-testing framework, custody risk) stand in ironic contrast to the reality of zero positions. When investors truly need risk-control information, what is shown is "n/a."
3. VaR as a compliance tool vs. a decision tool: The model is well designed and its limitations are candidly acknowledged, but it does not penetrate to the portfolio level. For investors, rather than relying on a VaR "with no data to support it," it is better to focus on the fund's actual performance under stress tests.
4. Future observation points: If the High Yield Bond Fund continues to post negative returns in 2025–26, the reasonableness of the expense-capitalization policy and VaR model parameters should be scrutinized—especially whether a decay factor of 0 will lead to lagging risk predictions once the historical data window (180 weeks) contains the extreme volatility of 2024–25. This is a question worth asking in the next annual report.
Follow-Up Analysis: The Fund's Strategic Nature as Seen Through the Dual "Income—Capital" Structure
1. A Deep Dive into the Income Structure: The True Picture Masked by Capital Returns
This report is the first to centrally disclose the full split between "income return" and "capital return"; this dual-track structure deserves a closer look:
| Metric | 1-Year (as of 2025/9/30) | 3-Year Annualized |
|---|---|---|
| Total income (pence per share) | 8.69 | 23.31 |
| Total return | 7.7% | 11.1% |
| Capital return | 0.13% | 3.73% |
| Income as share of total return (estimated) | ≈98% | ≈66% |
Key finding: On the one-year horizon, capital return contributed only 0.13 percentage points, with fund returns almost entirely composed of coupon income. This means that over the past 12 months, the fund was effectively a "pure cash-flow instrument"—bond prices were essentially flat, and appreciation relied entirely on interest accrual. The three-year annualized capital return of 3.73%, by contrast, reflects the valuation-recovery process after the deep discounting of high-yield bonds in 2022–2023 (as seen in cases such as CPI Property and Belden).
This data reveals an important strategic implication: in the current environment of extremely compressed credit spreads, the fund is unlikely to generate excess returns through capital gains; all of its alpha potential is concentrated in coupon selection and default avoidance. The report's contemporaneous mention that "an overweight to B-rated bonds, prioritizing coupon income, contributed positive returns" precisely confirms this inference.
2. Industry Allocation Migration Matrix: Three Types of Structural Change
Comparing this period's industry weights side by side with the prior period's reveals three important structural shifts executed by the fund manager during the reporting period:
| Industry Sector | Prior Period Weight | Current Period Weight | Change (pct) |
|---|---|---|---|
| Financial Services | 5.82% | 11.47% | +5.65 |
| Health Care | 8.63% | 10.42% | +1.79 |
| Consumer Goods | 1.31% | 2.48% | +1.17 |
| Asset Backed | 0.00% | 1.82% | +1.82 |
| Automotive | 3.52% | 4.40% | +0.88 |
| Banking | 4.24% | 3.73% | -0.51 |
| Capital Goods | 4.10% | 2.65% | -1.45 |
| Energy | 5.01% | 2.62% | -2.39 |
| Basic Industry | 12.00% | 7.05% | -4.95 |
Change 1: A full-scale advance into non-bank financials. The Financial Services sector nearly doubled, jumping from 5.82% to 11.47% and becoming the largest industry allocation at a stroke. A closer look at the holdings shows this is not an expansion of traditional banks but a group of "alternative finance" names: Shift4 Payments (payment processing), doValue (loan servicing), Arrow Global (debt purchasing), Encore Capital (debt collection), Burford Capital (litigation finance), and International Personal Finance (consumer credit in emerging markets). The common characteristics of these names: high cash-flow visibility, low sensitivity to interest rates, and correlations with the macro cycle that are weaker than those of traditional industries. In an environment where credit spreads have bottomed out, these non-cyclical financial bonds offer a relatively ample coupon premium.
Change 2: A systematic retreat from cyclical industries. Basic Industry was cut sharply from 12% to 7.05%, Energy fell from 5.01% to 2.62%, and Capital Goods was reduced from 4.10% to 2.65%. Together, these three sectors were trimmed by approximately 8.8 percentage points—this is not fine-tuning at the individual-name level but a clear sector downgrade. Combined with the report's stated strategy of "favouring more robust credits," this change shows that, following the tariff shock, the fund manager systematically reduced exposure to global manufacturing and commodity cycles.
Change 3: Asset Backed from zero to one. The new 1.82% allocation went to secured bonds of two UK pub operators, Marston's and Mitchells & Butlers. This represents a "quasi-asset-backed" strategy: UK pub properties typically carry real-estate collateral value, providing a substantial asset-protection layer in an uncertain environment. This new sector fits closely with the report's emphasis on a "robust income opportunity" positioning.
3. Trade Mirror: The Risk-Management Logic Between Buys and Sells
Analyzing the largest buys and sells side by side clearly reveals the fund manager's risk-disposal path:
Sell side: eliminating three types of residual risk
| Sold Position | Type | Risk Characteristics |
|---|---|---|
| Brightline East 11% 2030 | US high-speed rail | Revenue ramp-up below expectations + weak sponsor support |
| Calumet Specialty Products | Specialty energy | High leverage + commodity price exposure |
| NCR Atleos 9.5% 2029 | ATM services | Transformation uncertainty + high-yield bond |
| Gannett 6% 2026 | Newspaper publishing | Structural industry decline |
| Aggreko 6.125% 2026 | Equipment rental | Short tenor; yield no longer attractive |
| Barclays 7.125% Perp AT1 | Bank AT1 | Perpetual bond; unfavorable duration in a rate-cutting cycle |
Buy side: positioning for three types of new opportunity
| Bought Position | Industry | Buy Rationale |
|---|---|---|
| Future PLC 6.75% 2030 | Digital publishing | High cash flow + industry consolidator |
| Asmodee 5.75% 2029 | Tabletop games | Non-cyclical consumer + global brand |
| Skechers 5.25% 2032 | Footwear | High immunity to tariff risk |
| KBC Group 6% Perp | Belgian bank | Quality premium of European banks |
| Grifols 7.5% 2030 | Plasma products | Essential medical demand + high coupon |
| Perrigo 5.375% 2032 | OTC pharmaceuticals | Defensive consumer healthcare |
Notably, five of the positions on the sell list carry a 144A designation (US private placements), while only a few on the buy list do—suggesting the fund is migrating from lower-liquidity/higher-risk-premium names to more liquid, public-market names. Combined with the "tight credit spreads" backdrop mentioned in the report, this change indicates that the fund manager is building liquidity reserves in advance of potentially heightened volatility.
4. FRN and PIK Instrument Combinations: A Dual Hedge Against Rate Uncertainty
The holdings table shows six floating-rate note (FRN) positions and one payment-in-kind (PIK) bond—a relatively rare combination among comparable high-yield funds:
- FRN positions: Marston's FRN 2035, Mitchells & Butlers FRN 2030, Miller Homes FRN 2030, IMA FRN 2029, Arrow Global FRN 2029, and Reno De Medici FRN 2029—together accounting for approximately 3.4%.
- PIK position: IHO Verwaltungs PIK 8.75% 2028, at 1.48%.
In the early stage of a rate-cutting cycle, the logic of holding FRNs is: the coupon-reset mechanism of floating-rate notes naturally hedges the risk of "less easing than expected." If inflation rebounds and forces the Fed to pause or even reverse rate cuts, FRN coupons will rise with the benchmark rate, protecting the fund's return performance. The IHO Verwaltungs PIK bond, meanwhile, offers a high 8.75% payment-in-kind rate in exchange for reduced liquidity—demonstrating that, in an environment of extremely narrow credit spreads, the fund manager is willing to take on a degree of instrument complexity for higher yield.
5. Re-examining Performance Attribution: The True Sources of Excess Returns
The report's data: 1-year total return of 7.7% vs. a benchmark of 7.8% (underperformance of 0.1 pct); 3-year annualized return of 11.1% vs. a benchmark of 10.3% (outperformance of 0.8 pct).
The question that warrants further inquiry: where did the three-year excess return come from?
Based on the disclosed information, there are two primary sources:
1. Contrarian allocation after the crisis (β-level timing): The CPI Property case shows that during the 2022 rate surge and market panic, the fund did not sell off in panic but instead held or even added positions at extremely wide credit spreads, ultimately realizing significant capital gains in the 2023–2024 valuation recovery. This capability is essentially the ability to identify a "turn in the credit cycle."
2. Overweight to B-rated bonds (β-level structural preference): The report explicitly notes that the "overweight to B rated bonds" contributed positive returns. B-rated bonds sit at the risk midpoint of the high-yield universe—neither facing the high default risk of CCC-rated names nor suffering the unattractive yields of BB-rated names. During the 2023–2025 recovery, B-rated bonds were precisely the segment with the largest credit-spread compression.
6. Risk Exposures Still to Watch
Although the fund has turned generally cautious, several potential risk points in the holdings deserve attention:
1. Herbalife 12.25% 2029 (144A): A consumer-health name with a very high coupon; historically, it has fallen into debt distress multiple times.
2. Bausch Healthcare 10% 2032 (144A): A high-yield bond in the healthcare sector, though the parent company carries significant legacy legal risk.
3. Softbank 5.875% 2031: Bonds of the Japanese tech-investment giant; highly sensitive to tech-equity valuations and in some tension with the fund's overall defensive posture.
4. IHO Verwaltungs PIK: A payment-in-kind bond is itself a signal of credit stress and could face refinancing risk in a liquidity-tightening cycle.
Together, these positions account for approximately 4.7% of the fund. While they are not core holdings, they could become a drag on relative performance during future market volatility. That said, given that all of them offer coupons above 10%, this trade-off of "hedging tail risk with high coupons" may well be a rational choice by the fund manager in a tight-spreads environment—accepting these "imperfect but not fatal" names in exchange for attractive yield compensation.
Additional Analysis: Sector-Rotation Signals, Derivatives Hedging Structure, and Share-Class Perspective
1. Significant Rotation in Sector Weights: Rebalancing Offense and Defense
Comparing this period's sector weights with those of a year ago (in parentheses) clearly reveals the portfolio management team's core rebalancing logic over the past 12 months:
| Sector | Sep 2025 | Sep 2024 | Change | Direction |
|---|---|---|---|---|
| Services | 11.59% | 6.51% | +5.08pp | Significant increase |
| Leisure | 6.88% | 4.93% | +1.95pp | Increase |
| Retail | 7.93% | 7.25% | +0.68pp | Modest increase |
| Transportation | 2.47% | 2.47% | 0.00 | Unchanged |
| Insurance | 0.97% | 0.00% | +0.97pp | New position |
| Media | 7.32% | 9.82% | -2.50pp | Notable reduction |
| Telecommunications | 8.18% | 11.49% | -3.31pp | Significant reduction |
| Sovereign | 2.90% | 5.02% | -2.12pp | Reduced defensiveness |
| Real Estate | 1.30% | 2.60% | -1.30pp | Reduction |
| Utilities | 0.00% | 0.92% | -0.92pp | Liquidated |
| Technology & Electronics | 2.07% | 2.40% | -0.33pp | Modest reduction |
Key interpretations:
- The leap in Services allocation (+5.08pp) is the most significant position change. Within the sector, the additions display a distinctive "blossoming across multiple fronts" pattern: from business services (Currenta, Manuchar) and education (Multiversity) to environmental services (Urbaser, with three bonds of different structures), business information (Nielsen, Veritext), and human resources (The House of HR). This allocation approach shows the fund manager actively seeking non-cyclical, contract-based income streams in high-yield names, rather than simply chasing high coupons.
- Telecommunications fell from the largest sector to the third-largest (11.49%→8.18%), with the reduction concentrated in traditional cable/satellite communications (Cable One, Eutelsat, VodafoneZiggo). Notably, however, Virgin Media RFN remains the sector's largest holding at 1.82%—the retention of quality cable assets alongside the divestment of subordinated telecom debt reflects credit tiering rather than sector avoidance.
- Sovereign allocation fell from 5.02% to 2.90%, with two UK short-dated gilts (maturing 20/10/2025 and 22/12/2025) serving as rolling cash-management instruments within a three-month horizon. This freed up approximately 2 percentage points for high-yield allocation, while quarter-end cash needs explain why the maturities were precisely scheduled for October and December.
- Utilities went from 0.92% to zero, and Real Estate was halved (2.60%→1.30%), showing the portfolio is exiting traditional defensive sectors entirely—a typical sign of rising risk appetite in the mid-to-late stage of a bull market, but also implying that the portfolio's sensitivity to rising rates is increasing.
II. Derivative Hedging: The "Dual Defense" of FX Forwards and CDS
1. FX Forward Contracts: Systematically Short EUR and USD
| Counterparty | Settlement Date | Buy | Amount | Sell | Amount | Unrealized P&L (£'000) |
|---|---|---|---|---|---|---|
| HSBC | 23/10/25 | GBP | 144,584,579 | EUR | 166,959,000 | (1,333) |
| NatWest | 23/10/25 | GBP | 58,300,311 | USD | 79,298,450 | (595) |
| State Street | 23/10/25 | GBP | 14,214,335 | EUR | 16,414,000 | (131) |
| Total | (2,059) |
The combined notional size of these three forward contracts is approximately £217.1 million, covering 76.2% of the fund's net assets (£284.8 million) — a relatively high hedge ratio. The contract structure shows two characteristics:
- EUR short exposure is approximately 2.6 times the USD short exposure. Given that a large portion of the portfolio consists of European issuers (Stada, Cirsa, Lottomatica, Motel One, CPI Property, etc.), the currency mismatch risk from holding euro-denominated debt is relatively high in itself; shorting EUR/GBP can hedge this portion of currency volatility. However, all contracts are in an unrealized loss position (aggregate -0.73%), reflecting the relative strength of sterling during the reporting period — which forms a directional hedge relationship with the portfolio's heavy allocation to European assets.
- All contracts settle on the same date, October 23, about three weeks after the September 30 quarter-end. This is not a random choice — it is most likely that the fund manager pre-emptively established defense against potential sterling volatility triggered by the October UK Autumn Budget (usually published in late October).
2. CDS Contracts: Bearish Protection via iTraxx Europe Crossover
The fund purchased iTraxx Europe Crossover Series 43 CDS protection with a notional amount of €6.5 million (maturity June 2030, premium 5%). The index consists of 50 European speculative-grade credit entities and is a core indicator of confidence in the European high-yield bond market.
- Directionally, buying protection is insurance against widening European high-yield credit spreads. Given that roughly 65%–70% of the portfolio's assets are euro-denominated, this hedge is highly correlated with the underlying holdings' credit risk.
- In terms of cost, a 5% premium rate, in an environment where European high-yield bonds currently yield an average of 7%–8%, equates to approximately 6%–7% of the portfolio's interest income — a reasonable cost of insurance.
- Notably, derivatives overall contributed +1.31% in the same period of 2024, versus -0.94% currently. The 2.25-percentage-point deterioration is not attributable to the CDS itself (-0.21%), but to the valuation change in FX forwards (shifting from positive to negative). This reflects the book-value impact of sterling appreciation on a portfolio dominated by euro and dollar assets — but this loss is only unrealized. The true purpose of the hedge portfolio is to lock in exchange rates, not to speculate for profit.
III. "PIK + FRN": Refined Allocation in the Middle Segment of the Risk Spectrum
Beyond traditional fixed-rate bonds, the portfolio has allocated to two types of special-structured instruments, together accounting for approximately 3.9% of total assets:
| Type | Underlying | Market Value (£'000) | % of Net Assets |
|---|---|---|---|
| PIK bond | Cirsa PIK 8.625% 2030 | 3,805 | 1.34% |
| PIK bond | Urbaser PIK 12% 2032 (144A) | 1,077 | 0.38% |
| PIK bond | Urbaser 10.5% 2032 PIK | 660 | 0.23% |
| FRN | Multiversity E+4.25% 2031 | 3,165 | 1.11% |
| FRN | BestSecret E+3.75% 2029 | 2,107 | 0.74% |
| FRN | Manuchar E+500 2032 | 2,279 | 0.80% |
| FRN | Asmodee E+375 2029 | 1,570 | 0.55% |
PIK Bonds (Pay-in-Kind): The three holdings total approximately 1.95% (about £5.54 million). Among these, the Urbaser positions simultaneously span a fixed-rate bond (5.5% 2032), a high-coupon PIK (10.5% 2032), and a 12% PIK (144A), forming vertical coverage across the same issuer's capital structure. The high coupons on PIK instruments typically correspond to constrained cash liquidity, but in a declining rate cycle, PIK instruments have greater capital appreciation elasticity than traditional coupon bonds—this may be the fund manager's positioning logic.
Floating Rate Notes (FRN): The four holdings total approximately 3.20%. The allocation value of FRNs lies in: ① when benchmark rates (EURIBOR/SONIA) are at historically high levels, FRNs can directly capture current rate levels without duration risk; ② if a recession triggers aggressive central bank rate cuts, although FRN income declines, the more than 80% of the portfolio in fixed-rate bonds will realize capital gains from falling rates, forming a natural interest rate hedge.
4. Share Class Perspectives: Fee Structures Determine Holding Value
The Comparative Tables reveal significant performance divergence across share classes holding the same underlying assets:
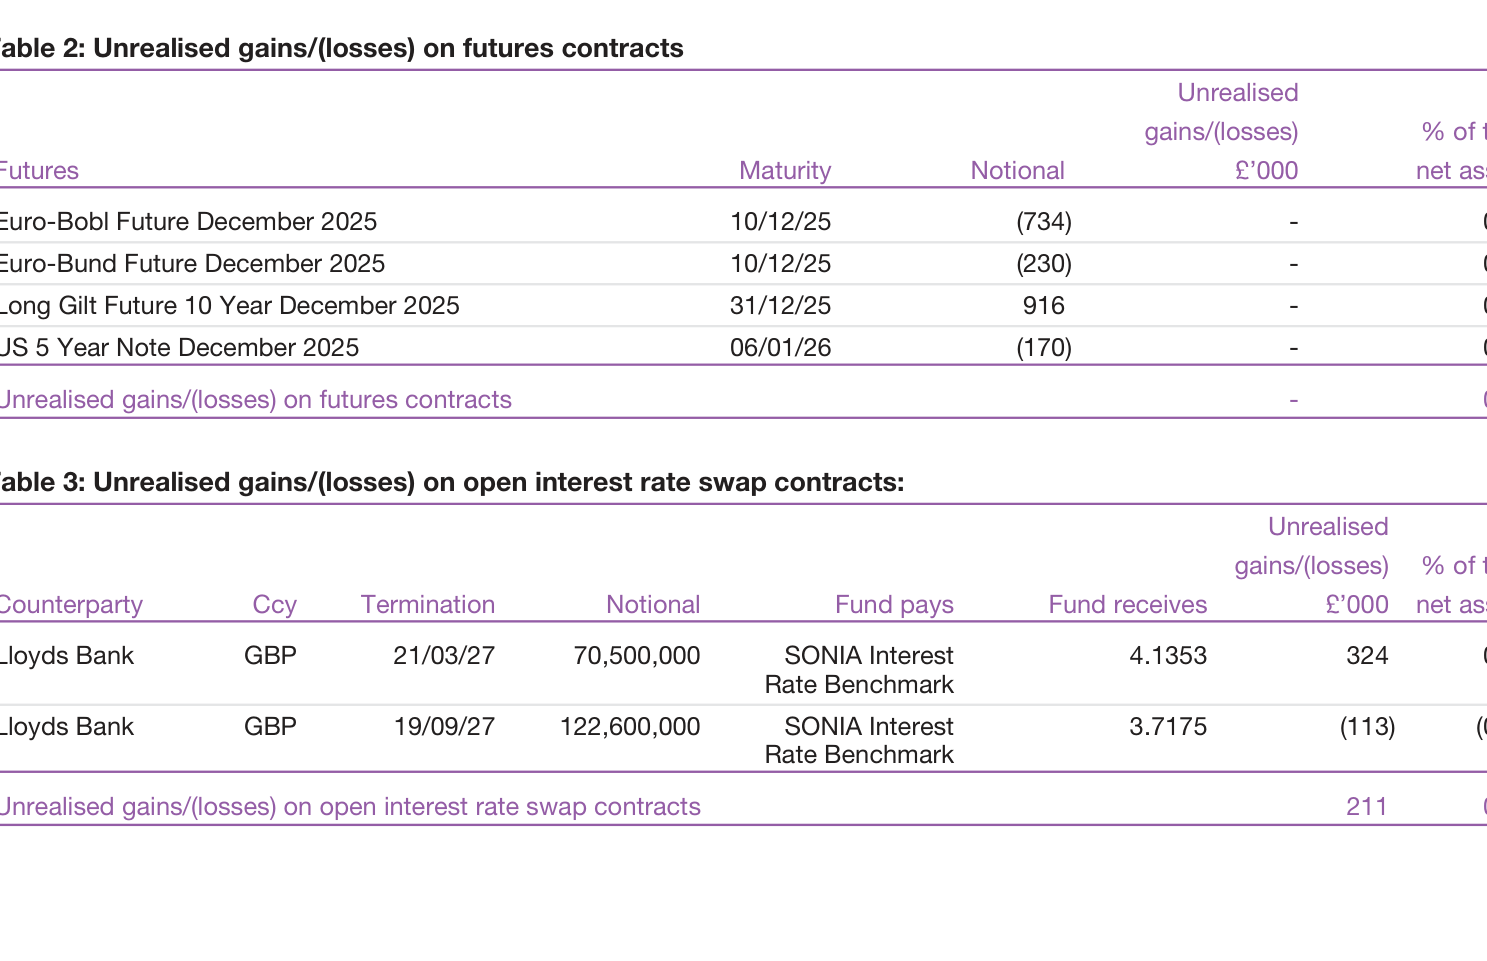
| Share Class | Operating Fee | FY2025 Return | Three-Year Return (Cumulative) | Period-End NAV (£'000) | Share Count Change (YoY) |
|---|---|---|---|---|---|
| A Income | 1.03% | 6.73% | 32.90% | 6,216 | -41.5% |
| B Accumulation | 0.38% | 7.58% | 36.17% | 172,815 | -15.6% |
| B Income | 0.38% | 7.39% | 35.16% | 103,858 | +1.8% |
| C Accumulation | 0.03% | 7.95% | 37.65% | 1,899 | -78.7% |
| C Income | 0.03% | 7.77% | 36.32% | 1 | 0 |
Several points are worth noting:
- Class A shares contracted 41.5%, the heaviest redemptions among the five classes, reflecting retail investors exiting during an off year for performance (6.73% vs. 7.58% for Class B). Class A assets fell from £11.7 million to £6.22 million, but the share count dropped from 9.76 million to 5.71 million—net asset value per share declined only from 109.58 to 108.82, indicating that redemptions were driven mainly by share cancellations rather than NAV declines.
- Class C Accumulation shares plunged from 1,873,086 to 398,643 units (-78.7%), with assets falling from £8.26 million to £1.9 million. This sharp redemption in an ultra-high-net-worth institutional share class is likely tied to a single institutional investor's asset allocation adjustment rather than a negative judgment on the fund itself—over the same period, Class C Income shares held steady at 500 units.
- Class B (institutional shares) totaled £276.7 million, representing 97.2% of total net assets, making it the absolute mainstay of the fund. Class B Income shares rose rather than fell (+1.8%), indicating that some investors chose to lock in income at elevated yield levels.
- On fee differentials: the 71-basis-point fee gap between Class A and Class C produced a cumulative return gap of roughly 4.75 percentage points over three years (32.90% vs. 37.65%). For investors with longer holding periods, the choice of share class can have a greater impact on final returns than even the beta of the underlying assets.
- The high/low price ranges across share classes reveal NAV volatility characteristics: Class C Acc exhibited a range of 440.8–480.1 (8.9%) and Class B Acc 285.2–309.7 (8.6%). In a bond market with persistently elevated yields, this level of volatility is moderate and manageable.
V. Overall Fund Shrinkage and Operating Efficiency
The fund's total net assets fell from approximately £3.11 billion in September 2024 (aggregated across comparable share classes) to £2.85 billion, a year-over-year contraction of approximately 8.4%. Based on changes in the individual share classes, total redemptions are estimated to have been in the range of approximately £20 million to £25 million, though continued inflows into the B Income class partially offset the redemption pressure.
Net redemptions, combined with unrealised derivative losses (-0.73%), left period-end net assets below the portfolio market value (277,141 vs 284,789). This structure itself indicates that pure market value movements contributed positive growth, but fund flows were negative — the typical mature-fund lifecycle stage of "decent performance but persistent redemptions".
Another notable detail: Direct transaction costs have been 0.00% for three consecutive years, indicating that the fund executes with exceptional efficiency in secondary bond market trading, or that a large portion of its holdings are obtained through primary issuance subscriptions, incurring no explicit transaction costs. This is relatively rare among high-yield bond funds and reflects Baillie Gifford's market-maker relationships and placement capabilities in the small/mid-cap high-yield bond segment.
Follow-Up Analysis: Deeper Signals of Fund Operations from the Financial Data
1. A Qualitative Shift in the Return Structure: From Capital-Driven to Solely Income-Driven
The composition of the fund's 2025 total return reveals a fundamental switch in the earnings engine. In 2024, capital gains accounted for 54.3% of total returns (31,416/57,837), but in 2025 this ratio plunged to 11.2% (2,834/25,369). Net income's share of total returns surged from 45.7% to 88.8%, leaving the fund's return source almost entirely dependent on coupon income.
More noteworthy is the deterioration in the internal structure of capital gains:
| Item | 2025 (£‘000) | 2024 (£’000) | Change |
|---|---|---|---|
| Non-derivative securities | 8,638 | 8,570 | +0.8% |
| Derivative contracts | (194) | 143 | -235.7% |
| Forward currency contracts | (5,675) | 22,683 | -125.0% |
| Currency gains | 69 | 24 | +187.5% |
| Total net capital gains | 2,834 | 31,416 | -91.0% |
Capital gains from non-derivative securities were essentially flat year-over-year (8,638 vs 8,570), showing that spread trading in the bonds themselves still contributed positively; but forward currency contracts swung from +22.7M to -5.7M, becoming the biggest black hole devouring capital gains. This suggests that the fund's FX hedging strategy encountered significant currency headwinds in 2025 (sterling appreciated against major currencies), rather than a fundamental deterioration in the portfolio's bond selection.
2. The Real Cost of Rising Derivative Exposure: Collateral Surges 431%
A hidden signal in the balance sheet warrants attention — `Collateral held by counterparties` surged from 585k to 3,110k, an increase of 431.6%. At the same time, `Collateral held on behalf of counterparty` fell from 4,245k to zero.
This combination of one rising and one falling means that the fund's net collateral position in derivative transactions shifted from net receiver to net payer. Combined with the 5,675k loss on forward currency contracts and the 194k loss on derivative contracts, it can be inferred that in 2025 the fund not only saw derivative market values move in an adverse direction, but counterparties also demanded more stringent collateral terms. For a bond fund with net assets of only 284.8M, the freezing of 3.1M in collateral means 1.09% of assets are locked up, undermining cash management flexibility.
3. Structural Divergence Behind the 'Halved' Improvement in Fund Flows
Net outflows narrowed from 190.8M to 43.7M, which on the surface suggests redemption pressure has eased substantially. But breaking down the structure, issuance and redemptions should be read separately:
| Item | 2025 (£‘000) | 2024 (£’000) | YoY |
|---|---|---|---|
| Issuance proceeds | 113,638 | 57,131 | +98.9% |
| Share cancellation payments | 157,335 | 247,942 | -36.5% |
| Net flows | (43,697) | (190,811) | -77.1% |
Issuance proceeds nearly doubled, indicating that contrarian capital entered the high-yield bond market in 2025 to bottom-fish — consistent with a market environment of widening high-yield spreads and upward repricing of credit risk. Yet within the same year, redemptions still significantly exceeded issuance. The divergence between `B Accumulation` and `B Income` shares is the most typical: B Accumulation shares net decreased by 10.4M, while B Income shares net increased by 1.5M — investors chose the latter between "accumulating" and "taking income", reflecting increasingly conservative expectations for future capital appreciation.
4. Quantitative Evidence of Liquidity Contraction: Spreads Widen 43%
The `Average portfolio dealing spread` rose from 0.37% to 0.53%, an increase of 43.2% — direct evidence of deteriorating market microstructure in the high-yield bond market. Rising market-maker risk aversion and declining market depth mean that trades of the same size carry a higher impact cost to NAV. Interestingly, the fund recorded zero transaction costs on bond purchases and sales (`There were no transaction costs on the purchase or sale of bonds`), indicating that this cost is not made explicit in the income statement but is implicitly passed through the bid-ask spread — the actual transaction cost is understated.
5. Distribution Resilience: Fee Capitalisation Strategy Keeps the Distribution Rate Rising Rather Than Falling
Total distributions in 2025 were 23,712k, down 14.9% from 2024, yet the distribution rate relative to opening net assets actually rose:
| Metric | 2025 | 2024 |
|---|---|---|
| Distributions / Opening NAV | 7.62% | 6.12% |
| Net income / Opening NAV | 7.24% | 5.80% |
| Total return / Opening NAV | 8.15% | 12.69% |
By capitalising all 1,178k of fees to capital (`Add expenses allocated to capital`), the fund increased net income available for distribution to above 22,535k, which, combined with the 10k of distributable income carried forward from the start of the year, ultimately supported distributions of 23,712k. In other words, the portion of 2025 distributions exceeding net income (1,177k) actually came from capital — a strategy that buys distribution stability at the expense of fund net assets. Given that the fund's net assets have already contracted due to redemptions and capital losses, the sustainability of this approach deserves attention: if the capital side continues to bleed, future distribution rates will eventually decline in tandem with NAV.
6. Overall Assessment: Judging the Health of Fund Operations
Taken together, the financial data show the fund exhibited classic "defensive contraction" characteristics in 2025: stable on the income side (interest income fell only 12.9%, far better than the capital side), compressed on the expense side (AMC down 21.9%), but under pressure on the asset side (net redemptions, capital losses and FX hedging losses resonating on three fronts). The most positive signals are the doubling of issuance proceeds and the sharp narrowing of net outflows, indicating that at elevated credit spread levels, incremental capital has begun to reallocate into high-yield bond assets; the most negative signals are the persistent drain from forward currency contracts and the swelling of derivative collateral — if these two items cannot be reversed in the coming year, they will continue to weigh on the fund's ability to generate positive returns.
Valuation Hierarchy: Heavy Reliance on Observable Market Data, Level 2 Asset Share Continues to Rise
The valuation basis in Section 13 shows that the fund's asset valuations are almost entirely concentrated in Level 2 (based on observable market data), reaching as high as 97.05% (271,550/279,804) at the end of 2025, up further from 94.94% (294,178/309,821) in 2024; while Level 1 (direct active market quotes) fell from 5.05% to 2.95%. Level 3 (unobservable data) assets and liabilities were both zero.
| Valuation Hierarchy | 2025 Assets (£'000) | Share | 2024 Assets (£'000) | Share |
|---|---|---|---|---|
| Level 1 | 8,254 | 2.95% | 15,643 | 5.05% |
| Level 2 | 271,550 | 97.05% | 294,178 | 94.94% |
| Level 3 | 0 | 0.00% | 0 | 0.00% |
| Total | 279,804 | 100% | 309,821 | 100% |
High-yield bonds are typically not traded centrally on major exchanges, and intraday quotes are sparse; using observable mid-prices, market-maker quotes, or model-based valuations is standard industry practice. However, it should be noted that Level 2 asset pricing can still produce valuation errors due to model parameter deviations or market liquidity evaporation. By contrast, the zero Level 3 is commendable — the portfolio contains no significant assets dependent on unobservable parameters, avoiding excessive reliance on the manager's subjective assumptions. On the liability side, Level 2 liabilities expanded from £543 thousand in 2024 to £2,662 thousand, mainly related to derivatives, reflecting an increase in unrealised losses, though the absolute amount remains small.
Credit Ratings: Investment-Grade Share Nearly Halved, Portfolio Credit Risk Systematically Elevated
The credit rating table in Section 14 clearly reveals a significant shift in portfolio risk appetite. Investment-grade assets fell from £21,839 thousand to £10,973 thousand in market value, with their share of total assets contracting from 7.02% to 3.85%; while high-yield assets rose from 91.03% to 94.40%. Meanwhile, Not rated/Other assets edged down from 1.95% to 1.75%.
| Rating | 2025 Market Value (£'000) | % of Total Fund | 2024 Market Value (£'000) | % of Total Fund |
|---|---|---|---|---|
| Investment grade | 10,973 | 3.85% | 21,839 | 7.02% |
| High yield | 268,831 | 94.40% | 283,365 | 91.03% |
| Other | 4,985 | 1.75% | 6,084 | 1.95% |
| Net assets | 284,789 | 100% | 311,288 | 100% |
This structural change arises from two possible overlapping effects: first, the fund manager proactively reduced investment-grade holdings and increased high-yield allocations in pursuit of higher coupons; second, some former investment-grade bonds were downgraded by rating agencies into the high-yield category (i.e., "fallen angels"), passively pulling down the investment-grade share. Notably, the investment-grade market value fell by 49.8%, far exceeding high yield's 5.1%, indicating that the selling or downgrades occurred mainly in the investment-grade segment. This means the fund is now more concentrated at the high-risk end of the credit curve, with heightened sensitivity to credit spread widening and potentially greater downgrade risk during an economic downturn.
Currency and Interest Rate Risk: Limited Non-Sterling Exposure, Fixed-Rate Dominance Drives Portfolio Duration Risk
Section 15 discloses the currency and interest rate risk distribution. On the currency side, net foreign currency exposure is not large: at the end of 2025, euro net liabilities were £2,591 thousand and US dollar net liabilities were £444 thousand, giving total net foreign currency liabilities of approximately £3,035 thousand, only 1.07% of net assets. In 2024, total net foreign currency liabilities were £3,346 thousand, equally negligible. This indicates that the fund broadly hedged foreign currency assets with sterling liabilities, so exchange rate fluctuations have limited impact on NAV.
On interest rate risk, after disaggregating by currency and interest-bearing type, the fund holds substantial fixed-rate interest-bearing financial assets. In 2025, fixed-rate assets totalled £261,863 thousand (142,829+62,211+56,823), accounting for 59.6% of all financial assets; adding non-interest-bearing assets of £217,099 thousand (mainly equity or derivative holdings), floating-rate assets were only £24,291 thousand. On the liability side, almost everything is fixed-rate (euro fixed £160,263 thousand), corresponding to the fixed-rate asset side, though the liabilities may be derivatives or other financial liabilities. The core conclusion is that the portfolio is highly sensitive to interest rate movements, especially in the current high-rate environment: if UK long-term rates rise further, the fund's net assets will face valuation pressure.
Derivative Exposure: Year-End Notional Exposure at Zero, but Collateral Exposure Shows Trading Is Still Underway
The derivative counterparty exposure table in Section 16 shows that at the end of 2025, all interest rate swaps, inflation swaps, forward FX contracts and credit default swaps had zero period-end exposure; in 2024, by contrast, there were still positive/negative exposures with HSBC, Merrill Lynch and NatWest counterparties. This means the fund significantly reduced its use of derivatives in 2025, or all exposures had been closed out by year-end or netted to zero.
However, Section 16 also discloses derivative collateral pledged: in 2025, four counterparties (Goldman Sachs 580, HSBC 1,430, NatWest 950, State Street Bank 150) held a total of £3,110 thousand in collateral, whereas in 2024 only Goldman Sachs held £585 thousand. This is an interesting contradiction — reported derivative exposure is zero, yet collateral has increased significantly. Possible reasons include: the derivative contracts are still within their term, but their fair value happens to be negative (becoming liabilities), requiring cash collateral to be pledged; or some trades were closed out just before period-end and the collateral had not yet been fully returned. Either way, the data indicates that the fund has not completely exited the derivatives market — the year-end exposure accounting merely happened to settle at zero. Investors should watch whether subsequent financial statements restore derivative disclosures, so as not to misjudge the continuity of the risk strategy.
Market Risk Quantification: VaR Declines Significantly, but Model Applicability Has Limits
The VaR data in Section 17, calculated at a 99% confidence level and a one-month holding period, show that the fund's market risk contracted notably versus the prior year:
| VaR Metric | 2025 (%) | 2024 (%) | Change (percentage points) |
|---|---|---|---|
| Maximum VaR | 3.88 | 4.40 | -0.52 |
| Minimum VaR | 2.33 | 3.18 | -0.85 |
| Average VaR | 3.38 | 3.86 | -0.48 |
Average VaR fell from 3.86% to 3.38%, a decline of 12.4%, reflecting lower overall market volatility over the past year and the portfolio's possible reduction in interest-rate-sensitive assets (for example, euro fixed-rate assets increased from £118,498 thousand to £142,829 thousand, but total holdings fell from £319,547 thousand to £286,526 thousand). However, it must be emphasised that the VaR model is based on the variance-covariance method, which assumes historical relationships persist and returns follow a normal distribution, so its ability to measure tail risk, liquidity evaporation and extreme market events is extremely limited. The report also proactively lists its limitations: VaR only reflects risk under "normal market conditions", and it only assesses positions at the daily close, unable to capture intraday changes in risk exposure. Therefore, a decline in VaR should not simply be read as "safer" or "more robust".
Contingent Commitment: Participating in Ardagh Group's Restructuring, Potential Gains and Execution Risk Side by Side
Section 18 discloses a significant contingent asset/liability: the fund has committed to purchasing $5,310,000 of Ardagh Group bonds at a price of 109.5, coupon 9.5%, maturity 1 December 2030, conditional on those bonds being issued under the Draft Restructuring Plan by 31 December 2025. Converted at the year-end exchange rate, the committed amount is £4,318,997, equivalent to 1.52% of the fund's net assets.
This commitment is essentially a "contingent mandatory transaction": once the bonds are issued before the deadline under the agreed terms, the fund must complete the purchase at the agreed price. It could be a potential value opportunity (a 9.5% coupon is significantly above the current average high-yield market yield), but it also carries obvious refinancing uncertainty and credit risk. Ardagh Group is deeply mired in financial distress; whether the "new bonds" in its restructuring plan can be successfully issued depends on creditor votes, regulatory approval and market conditions. If the restructuring fails, the fund will have no purchase obligation, so losses are limited; but if it succeeds, the fund will buy high-coupon bonds at a premium (109.5) and must bear the risk of price declines from subsequent credit deterioration. This transaction reflects the fund manager's active management style of deep involvement in distressed companies' restructurings, but the ultimate outcome of such positions is highly dependent on the restructuring process, making it a special scenario with considerable valuation uncertainty.
Distribution Record: Distributions Grow Substantially Across All Share Classes, Earnings Power Continues to Strengthen
The Distribution Tables cover the three interim distribution periods of the 2024/25 financial year. For ease of comparison, the net income distribution data for Group 1 (early holders) of each share class are set out below:
| Distribution Period | A Income | B Accumulation | B Income | C Accumulation | C Income |
|---|---|---|---|---|---|
| 2024-12-31 | 1.87000 | 4.88000 | 2.00000 | 7.55000 | 2.13000 |
| 2023-12-31 | 1.26000 | 3.07000 | 1.35000 | 4.70000 | 1.42000 |
| YoY Change | +48.4% | +58.9% | +48.1% | +60.6% | +50.0% |
| 2025-03-31 | 1.97000 | 5.21000 | 2.10000 | 8.08000 | 2.21000 |
| 2024-03-31 | 1.27000 | 3.11000 | 1.35000 | 4.80000 | 1.44000 |
| YoY Change | +55.1% | +67.5% | +55.6% | +68.3% | +53.5% |
All share classes recorded strong distribution growth of 48% to 68% at both the end of 2024 and Q1 2025, with the growth rates expanding quarter by quarter. This contrasts with the decline in the fund's NAV size — net assets shrank from £311.3 million to £284.8 million, down 8.5% — indicating that the improvement in per-unit income came mainly from existing assets with higher coupons and better spread performance, rather than from scale expansion. In addition, the distribution growth of B and C Accumulation shares was clearly higher than that of Income shares, reflecting the accelerating effect of compounding on accumulation-type returns. For C Income, Group 1 and Group 2 distributions were identical and Equalisation was zero, indicating no new subscriptions in that class during the distribution period, possibly because issuance of that share class has ceased or investors have made no new inflows.
The substantial growth in distributions has undoubtedly enhanced the fund's appeal to income-oriented investors, but investors should assess its sustainability: although high-yield bond coupons are high, any future defaults could erode principal and reduce distributable income. The rapid decline in the investment-grade share also suggests that the fund is trading higher current income for higher credit risk, which needs to be assessed in combination with risk indicators such as the falling VaR and reduced derivative usage. Overall, the fund's risk-adjusted performance over the reporting period presents a combined profile of "rising credit risk, lower market volatility, and strong income distributions".
Supplementary Analysis of the Performance Section
This section focuses on performance attribution and the deeper reasons for the deviation from target. First, note the dynamic change in the target benchmark: the chart notes for `Past Performance` show that the fund's target return was Index +0.5% before 16 September 2022, and +0.75% thereafter. This adjustment means that part of the three-year rolling assessment period (2022-2023) was still based on the old target, while the latest three years (October 2022 to September 2025) fully include the new target period. However, over these three years the fund's annualised return was 7.3%, below the adjusted target return (index annualised 6.9% + 0.75% ≈ 7.7%, with the actual target at 7.8%), a gap of about 0.5 percentage points. Although it beat the index by 0.4 percentage points, it missed the target, indicating that the raised performance target is not the only reason — more critical was the performance attrition during the 2022-2023 rate-hiking cycle, as the fund management team candidly acknowledged in the report that it had underestimated the speed and scale of rate increases.
From a contribution standpoint, bond selection became the primary source of excess returns. Table 1 lists several typical cases:
| Holding | Event Driver | Contribution Type |
|---|---|---|
| Annington Funding | Announced the sale of the Married Quarters Estate to the UK Ministry of Defence, triggering a debt buyback tender | Large-scale price revaluation |
| International Workplace Group | Operating performance exceeded market expectations | Fundamental improvement |
| CPI Property | Benefited from falling bond yields | Rate-sensitive |
The Annington case is particularly illustrative: the trade was essentially a credit event arising from a structural corporate change (sale of a core asset and repayment of debt). The fund had built a heavy position in advance and captured significant capital gains after the tender was announced. This demonstrates the fund's informational advantage in "credit-event-like" situations, but it also reveals the high concentration of return sources — should such opportunities diminish, the sustainability of future excess returns is questionable.
On trading behaviour, the report strikes a cautiously aggressive tone. On one hand, the fund "topped up" existing positions during intra-quarter volatility — such as Public Property Invest, a Nordic social infrastructure REIT — demonstrating its contrarian ability to exploit liquidity shocks; on the other hand, it actively participated in the new-issue market, such as the new paper of German residential property developer TAG Immobilien, acquiring credit exposure at valuations below peer levels. This "defensive yet offensive" strategy, in an environment of broadly tight investment-grade valuations, both offers an opportunity to improve the portfolio structure and increases dependence on further credit spread compression.
It is worth flagging that the report also describes market valuations as "relatively tight" and lists three core risks: US inflation getting out of control, geopolitical escalation, and sovereign bond volatility. This echoes the risk warnings in earlier sections, but adds a specific factor of government bond volatility driven by "fiscal deficits", suggesting that in an ultra-low spread environment, rising interest-rate hedging costs could erode returns. In addition, the report mentions "the Fund's large position in bonds issued by Annington"; given the size of that position, against a backdrop of historically low credit spreads, any policy reversal or corporate execution risk could have a significant impact on NAV.
On the dimension of long-term performance evaluation, although the three-year return missed the target, the fund still beat the index by 0.4 percentage points per annum. After accounting for fees (B share class management fee 0.25%), the net outperformance remains positive, indicating that the fund manager still possesses security selection ability in most market environments. However, setting the target at Index +0.75% is a relatively aggressive benchmark; without event-driven opportunities like Annington, that target would be difficult to achieve in a low-coupon environment. To meet the target in the future, the fund may need to take on greater risk by moving down in credit quality or through duration strategies, which in turn conflicts with the currently tight credit spreads — and this is the key information the next section, `Notable Transactions`, will reveal about how the fund balances this contradiction.
The 'Defensive' Narrative in the Introduction vs. the Reality of Holdings: Three Tensions to Be Unpacked
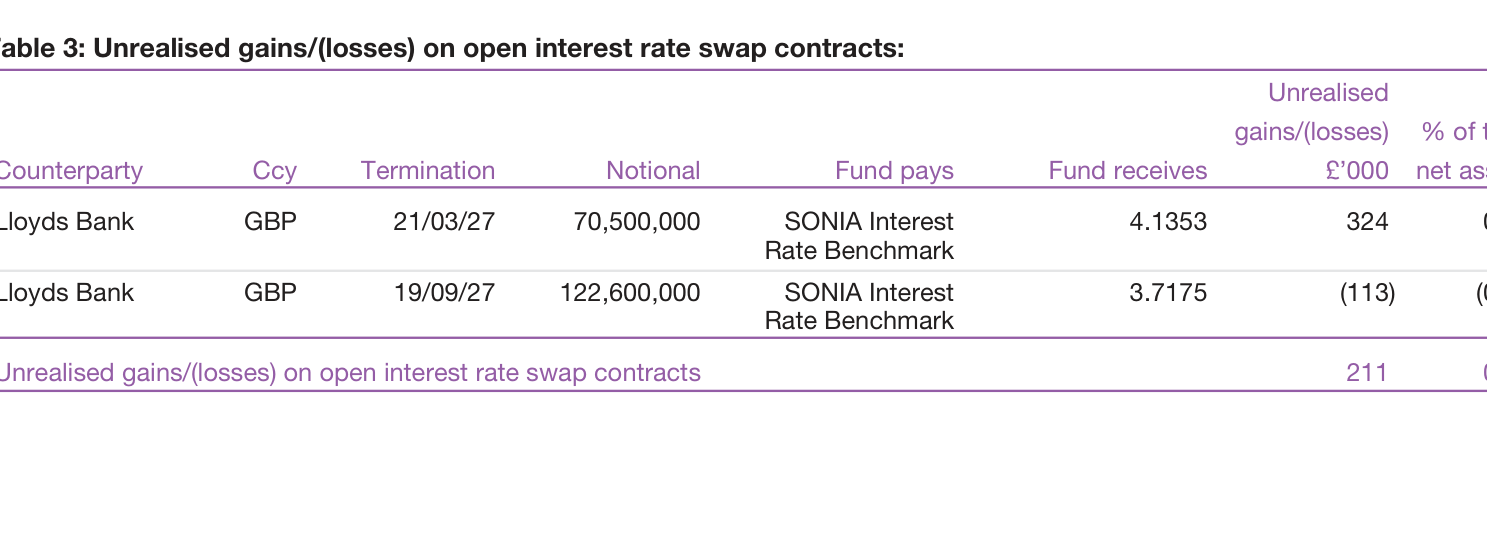
The most noteworthy aspect of this passage is the fairly deliberate "rhetorical management" the fund manager exercised in the description: first saying spreads have reached historical lows and price volatility risk is building, then describing his own stance as "increasingly cautious", "risk already reduced", and "defensively positioned" — yet the holdings data presented immediately afterwards tells a much more complex story. If one read only the introduction, one would think this is a fund that has already shrunk its positions into a corner; reading the holdings table line by line, one finds a considerable credit tilt and duration mismatch hidden within. Below are several layers of analysis that need to be unpacked.
1. The Truncated "Importantly" — the Key Argument Is Precisely Absent
The original text breaks off at "Importantly, the" and jumps directly into the position list. This looks like a typesetting truncation, but it happens to form a metaphor: the defensive evidence the fund manager truly wanted to emphasize never actually appears in the text. All we can see are the conclusive statements ("dry powder," "less volatile," "overweight front end") and an unannotated list of holdings. In the context of an investment report, this treatment means readers must verify the conclusions from the holdings data themselves — and the result of that verification does not fully support the three-character phrase "defensive" (防御性).
II. The Actual Direction of Sector Allocation Changes: Defensive Sectors Cut, Cyclical Sectors Added
A comparison of the prior-year figures in parentheses with this year's data in the `Portfolio Statement` reveals that the direction of the portfolio's sector adjustments clearly diverges from the "defensive" narrative:
| Industry | Prior-Year Weight | Current-Year Weight | Change (pp) | Direction |
|---|---|---|---|---|
| Real Estate | 7.69% | 13.00% | +5.31 | Significant increase |
| Financial Services | 6.94% | 10.75% | +3.81 | Significant increase |
| Media | 1.68% | 3.57% | +1.89 | Increase |
| Automotive | 0.95% | 2.41% | +1.46 | Increase |
| Banking | 16.16% | 17.12% | +0.96 | Increase |
| Supranational | 4.99% | 1.98% | -3.01 | Significant reduction |
| Insurance | 6.64% | 4.04% | -2.60 | Reduction |
| Technology | 2.42% | 0.00% | -2.42 | Liquidated |
| Health Care | 1.66% | 0.00% | -1.66 | Liquidated |
| Utilities | 9.40% | 7.86% | -1.54 | Reduction |
| Telecommunications | 4.04% | 2.74% | -1.30 | Reduction |
This table reveals a reality that cannot easily be dismissed in a single sentence: the heaviest reductions landed precisely in the traditional defensive sectors (insurance, utilities, health care, telecommunications, supranational institutions), while the sectors that received significant increases were those with higher interest-rate and economic-cycle sensitivity (real estate, financial services, media, automotive).
Among them, Real Estate rose from 7.69% to 13.00%, the largest single-industry position change of the year, with an increase of more than five percentage points. Real estate credit is considered a potential beneficiary in an interest-rate-cutting cycle, but its credit quality depends heavily on commercial real estate valuations, refinancing capacity, and rental cash flows — a far cry from the classic definition of "defensive." The increase in Financial Services also warrants closer examination: holdings such as Blackstone Private Credit, Blue Owl, and Burford Capital have credit quality deeply tied to capital market activity, making them typical high-beta credit instruments.
Therefore, a more factually accurate description might be: what the fund manager calls "defensive" means, on the same credit map, rotating from "sectors where spreads have already been compressed to very tight levels" into "sectors where spreads remain relatively wide." This is not an overall de-risking but a relative-value rebalancing.
III. The UK Gilt Revolving Door: Seemingly Large Trades, Actually Minor Net Exposure Adjustments
In `Material Portfolio Changes`, the most conspicuous activity is the large buying and selling of UK gilts:
| Bond | Buys (£’000) | Sells (£’000) | Net Change (£’000) |
|---|---|---|---|
| UK Treasury 4.75% 12/2030 | 37,350 | 27,112 | +10,238 |
| UK Treasury 4.25% 06/2032 | 24,741 | 25,437 | -696 |
| Total | 62,091 | 52,549 | +9,542 |
The two gilt trades combined had a notional turnover of over £110 million, yet the net position change was only about £9.5 million. This pattern of "large inflows and outflows with little net movement" is most likely a by-product of cash flow management, maturity rollover, or derivative hedging, rather than a directional asset allocation call. What actually reveals the portfolio's new direction is the other credit buys and sells:
- Buys: NatWest 3.632% 2034 (£20.6M), CCO Holdings 5.125% 2027 (£20.5M), Public Property Invest 4.625% 2030 (£18.3M), Virgin Money UK 5.125% 2030 (£16.5M);
- Sells: Annington Funding 2.924% 2051 (£16.6M), Legal & General 5.375% 2025/45 T2 (£18.4M), Nationwide 5.875% Perp AT1 (£14.6M), Burberry 1.125% 2025 (£15.1M).
Looking at the buy and sell columns together, the picture is clearer than "defensive": this is a process of rotating away from low-coupon, ultra-long-dated, callable/perpetual instruments into medium-to-short-dated, high-coupon fixed income securities. The Annington 2051 sold carries a coupon below 3%, and Burberry 2025 has a coupon of just 1.125%, while the bought bonds generally carry coupons in the 4%–6.5% range. The portfolio is maximizing coupon income, not minimizing total risk.
四、“干火药”的成色:高评级资产只有 13%,且当中混入了超长债
引言中的“dry powder in the form of very high quality securities”这句话,需要被量化检验。把 `Portfolio Statement` 中所有可归类为主权/准主权/超国家/政府担保的资产加总:
| 类别 | 占组合比例 |
|---|---|
| Sovereign(含 UK T-Bill) | 6.05% |
| Government Guaranteed | 3.49% |
| Supranational | 1.98% |
| Agency | 1.74% |
| 合计 | 13.26% |
也就是说,即便把“极高质量证券”宽泛地定义为主权及政府相关机构债,这一部分也只占组合的约 13%。一个防御性组合以所谓“干火药”为核心的资产占比,通常应当显著更高。 更关键的是,这 13% 并非都是低久期资产:
- UK Treasury 4.75% 12/2043、4.25% 12/2046、4.25% 12/2049、4.375% 07/2054 合计约 3.8%,全部集中在 2043~2054 年到期;
- Canada Pension Plan 1.625% 2071(0.64%)是剩余期限近 50 年的超长债;
- EIB 4.625% 2054、KFW 5% 2036 亦属于长端品种。
这些债券的信用质量无可挑剔,但它们不是“干火药”——在利率上行或流动性冲击中,超长国债同样会遭受显著的资本损失。真正接近现金的资产,只有那笔 1.24% 的 UK T-Bill,以及少量 2026~2027 年到期的债券。 所谓“dry powder”,在账面上被明显稀释了。
5. Shadow High-Yield Exposure Beneath the "Investment Grade" Label
The fund's full name is `Baillie Gifford Investment Grade Bond Fund`, but holdings that are clearly below investment grade are not isolated cases. From the publicly visible holdings alone, the following credit bonds clearly belonging to high-yield or quasi-high-yield can be listed:
| Bond | Portfolio Weight | Credit Characteristics |
|---|---|---|
| CCO Holdings 5.125% 2027 (144A) | 1.94% | Cable TV / LBO issuance, BB range |
| International Workplace Group 6.5% 2030 | 1.24% | Flexible workspace operator, B range |
| Mitchells & Butlers FRN 2033 | 1.46% | UK restaurant chain, rating near HY |
| Virgin Media RFN 4.875% 2028 | 0.49% | UK cable network, around B+ |
| Softbank 6.375% 2033 | 0.54% | Technology investment group, rating in BB range |
| Burford Capital 6.25% 2028 (144A) | 0.43% | Litigation finance, around B+ |
| Burford Capital 9.25% 2031 (144A) | 0.52% | Same as above |
| B&M European Value Retail 8.125% 2030 | 0.48% | Discount retailer, around B+ |
| Piraeus Financial 5.375% 2030/35 | 0.48% | Greek bank, rating still clearly below investment grade |
| Total | ≈ 7.6% |
If one also counts names on the BBB- borderline such as Worldline (0.86%) and CPI Property (1.45%), the share of assets in the portfolio with credit quality close to or even below the investment-grade threshold is around 9%–10%. For an investment-grade bond fund to hold close to 10% of non-investment-grade risk is not a violation, but it means the portfolio's credit beta has significantly deviated from the instinctive impression conveyed by the words "investment grade."
In 2025, with credit spreads at historic lows, the rationale for maintaining this positioning is that these bonds still offer relatively generous coupon compensation. But if spreads mean-revert, these are precisely the instruments with the most violent price swings. This directly undermines the persuasiveness of the narrative "tight credit spreads → the fund therefore remains cautious" — because the portfolio has used a larger position to embrace the most spread-sensitive area.
VI. The Liquidity Paradox: The Largest Position Is the Hardest Asset to Sell
The portfolio's largest position is `Blackstone Private Credit 4.875% 2026`, at 2.12%. As a bond issued by a private credit platform, it trades far less actively in the secondary market than ordinary corporate bonds, with wide bid-ask spreads and a limited holder list. Assets of a similar nature include Blue Owl Credit Income (0.67%) and several bonds issued under 144A terms (CCO Holdings, Burford Capital, James Hardie, Axon Enterprise, etc.).
A truly defensive portfolio prepared for price volatility would typically treat liquidity as a core consideration—because in a sell-off, what determines the size of losses is not credit quality but whether one can exit at a cost close to fair value. Yet this portfolio places its largest allocation in the least liquid assets. This is the most puzzling contradiction within a "defensive positioning" thesis. Perhaps the fund manager's judgment is that, although spreads are very narrow, no systemic sell-off will occur in the near term; but if that premise proves wrong, the least liquid parts of the portfolio will absorb the discount first—not the highly rated Treasuries.
7. Duration Structure: The "Ultra-Long-End Nail" Under the Front-End Overweight Narrative
"maintaining an overweight to bonds at the front end of the yield curve" is a relative concept and does not mean the portfolio's duration is short. Isolating the holdings with maturities of 2040 and beyond:
| Maturity Range | Major Holdings | Estimated Weight |
|---|---|---|
| 2040–2044 | AT&T 7% 2040 / 4.25% 2043 / 4.875% 2044, Anglian Water 5.75% 2043, EDF 5.5% 2041, UKT 4.75% 2043 | ≈ 6% |
| 2046–2049 | UKT 1.5% 2047, UKT 4.25% 2046/2049, Motability 6.25% 2045 | ≈ 2.5% |
| 2053–2055 | EDF 5.625% 2053, UKT 4.375% 2054, EDF 6% 2114, Centrica 6.5% 2055 | ≈ 3% |
| 2071 | Canada Pension Plan 1.625% 2071 | 0.64% |
| Total | ≈ 12%+ |
In other words, more than one-eighth of the portfolio's assets reside at the ultra-long end beyond 2040. Including the medium-to-long-end holdings between 2030~2039, the overall duration risk is far higher than the phrase "front-end overweight" implies.
This reveals a more complete but more complex strategy shape: a barbell structure—holding bonds with near-term maturities at the front end to provide reinvestment safety and potential downside protection, while retaining a batch of high-coupon bonds at the ultra-long end (such as AT&T 7%, EDF 6%, UKT 4.75% 2043) as income enhancement and curve-steepening trades.
Under a macro scenario in which the yield curve drifts modestly lower or steepens, this structure can simultaneously earn coupon income and capital gains; nevertheless, it is by no means a low-risk structure. The capital losses generated by the ultra-long-end positions when interest rates rise 50bp are sufficient to offset the defensive effect of the front-end holdings.
Summary: This Is Not a "Defensive" Fund, but a "Conditionally Optimistic" One
Based on the analysis above, there is a mismatch on at least four levels between the "defensive" narrative in the introduction and the facts of the holdings:
| Narrative | Facts |
|---|---|
| Reduced exposure to "less robust" credits | Real estate, non-bank financials, and marginal high-yield credits were significantly increased |
| Held "dry powder" | Ultra-high-quality assets are only ~13%, with substantial ultra-long bonds included |
| Overweight the front end to reduce volatility | Also holds large amounts of ultra-long bonds maturing after 2040 |
| Cautious amid tight credit spreads | The largest holding is instead the least liquid private credit |
A fairer assessment is that, within an active management framework, the fund manager executed a systematic credit swap — rotating out of sectors with excessively tight spreads into sectors with richer spread compensation, replacing low-coupon long bonds with high-coupon medium/short bonds, and swapping potentially callable perpetual/subordinated debt for fixed-maturity bonds. This is an aggressive strategy of "hunting for laggard plays within a credit bubble," not a defensive strategy for reducing overall risk exposure.
The real risk is that if credit spreads systematically widen from current historical lows, the real estate, non-bank financial, and shadow high-yield positions — the largest in the portfolio — would draw down far more than the "investment grade bond fund" label implies. Meanwhile, the ultra-long government bond positions would offer little effective buffer in an environment where rates and credit are both under pressure. At that point, the "balanced caution and optimism" cited in the introduction might prove to lean toward the overly optimistic side.
1. Share-Class Structure: How Fee Differentials Shape the Return Landscape
The newly added comparative table reveals a clear product-tiering logic — within the same fund portfolio, final returns can differ by more than 110 basis points purely because of share-class differences.
| Share Class | Operating Charges (2025) | 2025 Return | 2024 Return | 2025 Net Assets (£'000) | % of Fund's Total Assets |
|---|---|---|---|---|---|
| A Income | 1.02% | 3.43% | 10.32% | 303 | 0.03% |
| B Accumulation | 0.27% | 4.28% | 11.25% | 4,325 | 0.41% |
| B Income | 0.27% | 4.19% | 11.14% | 29,453 | 2.82% |
| C Accumulation | 0.02% | 4.55% | 11.53% | 1,009,797 | 96.73% |
| C Income | 0.02% | 4.46% | 11.43% | 0* | ~0% |
*C Income nominally retains 100 shares with zero assets, having effectively degenerated into a "shell" class.
Three key structural features merit attention:
First, the precise pass-through from fee differentials to return differentials. The fee gap between A- and C-class accumulation shares is 1.00 percentage point; the 2025 return gap is 1.12 percentage points (3.43% vs 4.55%), and the 2024 gap is 1.21 percentage points (10.32% vs 11.53%). The return gap slightly exceeds the fee gap because A-class shares have a relatively lower income distribution rate (4.02p vs C-class income of 4.56p), which erodes part of total return.
Second, the migration path of investors voting with their feet is clearly visible. A-class shares shrank steadily from 627,284 in 2023 to 387,153 in 2025, an average annual attrition of ~21%; B-class size was broadly stable; C-class accumulation shares rose from 413,372,757 in 2023 to 427,213,994 in 2025, with a modest dip to 412,680,616 in 2024 before net subscriptions resumed in 2025. The trend of capital concentrating into the lowest-fee C class has never reversed.
Third, the NAV growth of C-class accumulation shares has significantly outpaced other classes. Over three years, C-class accumulation NAV rose from 202.71p to 236.37p, a cumulative increase of 16.6%; over the same period, A-class income NAV rose from 75.97 to 78.30, just 3.1%, with nearly all returns distributed out. The gap will keep widening under compounding.
2. Derivatives Structure: Unrealised Losses Account for 99.9% of Capital Losses
The financial statements show a 2025 net capital loss of £5.698 million, while the four types of derivatives in the portfolio had total mark-to-market unrealised losses of £5.693 million (-0.55% × net assets). The two differ by only £5,000.
| Derivative Type | 2025 Unrealised Gain/(Loss) (£'000) | % of Net Assets | Primary Direction |
|---|---|---|---|
| Forward FX contracts | -1,861 | -0.18% | Long GBP, short USD/EUR |
| Futures contracts | ~0 | 0.00% | Long Gilt profits; losses on European/US bonds |
| Interest rate swaps | +211 | +0.02% | Pay SONIA vs receive fixed rate |
| Credit default swaps | -4,043 | -0.39% | Bought iTraxx Crossover protection |
| Total | -5,693 | -0.55% | — |
The implication of this data is telling: The fund's cash bond portfolio generated essentially no net capital gain or loss in 2025 (possibly slightly positive), and virtually the entire capital loss consisted of derivative hedging costs. In other words, this was a year in which returns were dragged down by hedging costs, not a loss caused by deteriorating portfolio credit quality.
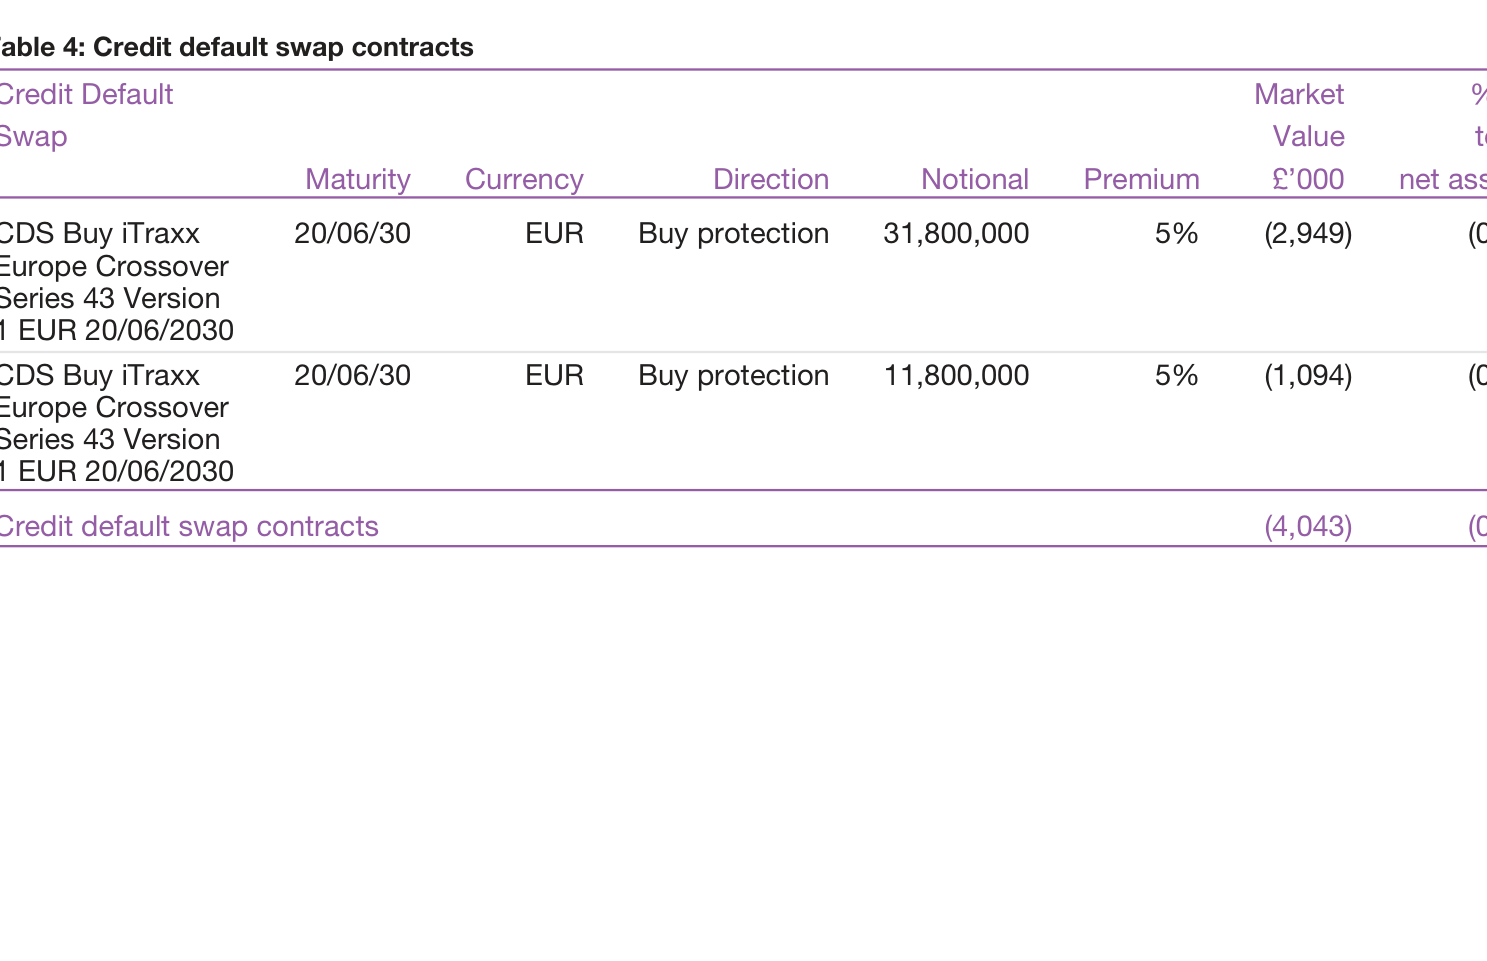
Item-by-item review:
Forward FX contracts — the sterling-appreciation episode. All contracts sell GBP and buy EUR/USD to hedge foreign-currency bond positions. Sterling strength in 2025 pushed all 14 forward contracts into loss, with the Deutsche Bank EUR contract contributing the largest single loss of £1.011 million, 54% of the total loss. JP Morgan Chase and Royal Bank of Canada together contributed another £584,000. These contracts are concentrated in 50–72-day tenors (maturing 20/11/25 and 11/12/25), indicating the fund runs a rolling short-term hedging strategy: every roll faces the actual shift in spot rates, and the cost is realised explicitly each quarter.
Credit default swaps — the premium payer's loss. Both CDS contracts buy protection on iTraxx Europe Crossover Series 43, with combined notional of €43.6 million and a 5% premium. Market value totals -£4.043 million, 71% of the fund's total derivative unrealised losses. This sends a clear market signal: in 2025 European credit spreads narrowed and the Crossover index fell, while the price of protection sold rose — in other words, the premium paid for credit risk insurance became "cheap." The fund, as the protection buyer, absorbed this time-value decay. Given that the underlying is a high-yield/crossover credit index while the fund itself is an investment-grade bond fund, this is more likely portfolio hedging than directional speculation.
Futures and swaps — small-scale fine-tuning. Profits of £916,000 on UK Long Gilt futures were offset by losses on eurozone (Bobl -£734,000, Bund -£230,000) and US (-£170,000) futures; interest rate swaps had a net unrealised gain of £211,000, of which the Lloyds Bank contract paying SONIA floating versus 4.1353% fixed gained £324,000, while another contract versus 3.7175% lost £113,000. Overall, net exposure in futures and swaps is minimal, reflecting the manager's conservative stance on rates in 2025.
3. The Disconnect Between Income Growth and Capital Losses
The Statement of Total Return presents a telling financial combination:
| Item | 2025 (£'000) | 2024 (£'000) | Change |
|---|---|---|---|
| Net capital gains/(losses) | -5,698 | +51,522 | Swing to loss |
| Income | 51,329 | 49,828 | +3.0% |
| Expenses | -240 | -238 | +0.8% |
| Net income | 51,089 | 49,590 | +3.0% |
| Distributions | -51,350 | -49,808 | +3.1% |
| Net change in net assets from investment activities | -5,959 | +51,304 | Sharply negative |
Income hit a record high in 2025, but the fund's overall net assets fell due to capital losses. Income growth was nearly in lockstep with 2024 (+3.0%), showing that the coupon income on the fund's holdings kept improving in a high-rate environment. However, distributions also rose 3.1% YoY, pushing 2025 distributions (£51.350 million) slightly above net income (£51.089 million), with the £261,000 shortfall covered by capital — 2024 had a similar gap of £218,000. In other words, even in a year of capital losses, the fund maintained and modestly increased total distributions — a strategy of topping up dividends from capital to stabilise the dividend rate.
It is worth comparing the quality of returns across the two years: roughly 98.5% of 2024's positive return (£51.304 million) came from capital gains and 1.5% from net income surplus; 2025's negative return (-£5.959 million) was entirely dominated by capital losses. Combined, the fund generated +£45.345 million of net asset change for investors over 24 months (51,304 - 5,959), still positive, but the directional shift in capital markets is fully reflected.
4. A Micro View of Special Holdings and Valuation Tiers
The newly added South West Water and Yorkshire Power bonds offer a window into the tail holdings of the portfolio:
| Bond | Par Value (£'000) | Market Value (£'000) | Premium/(Discount) to Par | Maturity | Valuation Tier |
|---|---|---|---|---|---|
| South West Water 6.375% 2041 | 6,700 | 6,676 | -0.36% | 2041 | Level 3 (single broker quote) |
| Yorkshire Power 7.25% 2028 | 10,300 | 10,901 | +5.83% | 2028 | — |
The South West Water 2041 bond is marked Level 3, one of the few holdings relying on a single broker quote. Despite the 2041 maturity, the 6.375% coupon still values at close to par, indicating that the market's required yield on this long-dated, medium-rated utility bond roughly matches the coupon. The Yorkshire Power bond, maturing 2028 with a 7.25% coupon, trades at a 5.83% premium, reflecting the scarcity value of high-coupon, short-duration bonds amid rate-cut expectations. Both positions are small (together ~1.68% of net assets), serving more as marginal additions to the portfolio's duration and credit tiers than as core strategic positions.
Overall, FY2025 presents a distinctive combination of "solid income, capital bleeding, and visible hedging costs": the fund relied on coupon income to sustain distribution growth, but the combined cost of FX hedging, credit protection purchases, and rate derivatives consumed capital returns, ultimately producing a negative return on net assets for holders. The structural fact that derivative unrealised losses nearly exactly match net capital losses is the key clue to understanding this year's performance.
Core Insights from the Financial Statements: Fragility Signals Hidden Behind Growth
This section starts from the annual financial statements to reveal the true drivers of the fund's asset growth, changes in investment quality, and potential risk points. These figures form a sharp contrast with the strategy description above and help in understanding the fund's actual operating condition.
1. The Primary Driver of Net Asset Growth Is Not Investment Returns
Annual net assets rose from £967.5m to £1,043.9m, an increase of 7.9%. But looking at the composition, the net change from investment activities was -£5.96m, the first negative reading in two years. What actually supported growth was:
| Item | 2025 (£'000) | 2024 (£'000) | Change |
|---|---|---|---|
| Net investor subscriptions (issuance - redemptions) | 31,854 | -5,093 | Turned positive; significant inflows |
| Retained earnings on accumulation shares | 50,258 | 48,207 | +4.3% |
| Net change from investment activities | -5,959 | 51,304 | Swing to loss |
Net subscriptions plus retained earnings exactly offset the investment loss, meaning the fund's size growth depended entirely on external inflows and retained earnings, not active investment appreciation. Investment activities contributed £51.3m in 2024 but consumed £6.0m in 2025 — a dramatic reversal in performance.
2. Divergence Between Capital Gains and Income: FX and Derivatives Are a Clear Drag
Bond interest income grew solidly (+7.9%), but total returns were eroded by derivative and FX losses:
```
Non-derivative bond gains +6.178m
Derivative contract losses -6.945m
Forward FX contract losses -4.691m
Currency losses -0.230m
Transaction costs -0.010m
Net capital gains -5.698m
```
Derivatives and FX together lost -11.9m, far exceeding the capital gains on the bonds themselves. This suggests the fund's costs/losses on rate hedging or currency hedging expanded significantly. The same items were net positive in 2024, indicating a reversal in the direction of currency or rate moves.
3. A Detailed Breakdown of the Relationship Between Income Growth and Distributions
| Income Component | 2025 (£'000) | 2024 (£'000) | YoY |
|---|---|---|---|
| Bond interest | 53,774 | 49,830 | +7.9% |
| Bank deposit interest | 423 | 350 | +20.9% |
| Swap interest | -2,868 | -352 | Loss widened 715% |
| Total income | 51,329 | 49,828 | +3.0% |
Swap interest swung sharply from a small negative to -£2.87m, possibly due to higher net payments on interest rate swaps or rising hedging costs. Although total income grew only 3%, total distributions reached £51.35m (up 3.1%), a payout ratio near 100%, with retained earnings coming mainly from automatic reinvestment in accumulation shares.
4. Credit Quality Deteriorated Notably: Investment-Grade Share Fell
Despite the fund's "investment grade" name, the share of non-investment-grade assets in the actual portfolio rose notably:
| Credit Rating | 2025 Share | 2024 Share | Change |
|---|---|---|---|
| Investment grade | 83.44% | 86.34% | -2.90pp |
| High yield | 13.10% | 10.11% | +2.99pp |
| Other | 3.46% | 3.55% | -0.09pp |
High-yield assets rose nearly 3 percentage points, while investment grade fell nearly 3 percentage points. This indicates the fund actively moved down the credit spectrum to address yield pressure. Meanwhile, the average bid-ask spread widened from 0.29% to 0.33%, reflecting higher liquidity discounts on lower-rated bonds.
5. Valuation Tiers and Asset Observability
| Valuation Tier | 2025 (£'000) | 2024 (£'000) | % of Total Assets |
|---|---|---|---|
| Level 1 (quoted) | 63,171 | 62,442 | 5.96% |
| Level 2 (observable inputs) | 934,572 | 864,744 | 88.1% |
| Level 3 (unobservable inputs) | 10,338 | 9,320 | 0.97% |
Level 3 assets (holdings lacking observable inputs) grew 10.9%; although still under 1% of the portfolio, the continued increase means the portfolio now contains harder-to-value instruments, possibly linked to unlisted securities or highly illiquid alternative assets.
6. Liquidity Pressure: Cash Position Shrank Notably
The liquidity buffer on the balance sheet is tightening:
| Item | 2025 (£'000) | 2024 (£'000) |
|---|---|---|
| Cash and bank deposits (total) | 23,377 | 28,191 |
| Bank overdrafts | (9,740) | (4,026) |
| Net cash | 13,637 | 24,165 |
| Receivables | 28,858 | 43,212 |
| Payables (excl. distributions) | (248) | (33,214) |
Net cash fell 43.6%, mainly because bank overdrafts widened from £4.0m to £9.7m. At end-2024 there was a large "pending purchase settlement" liability of £30.1m, which fell to £32k in 2025, reflecting very different year-end trading positions. In 2025 the fund made greater use of overdraft facilities, deploying capital more aggressively.
7. Impact of Subscriptions/Redemptions on the Investor Base
Looking by share class, fund flows show a clear structural preference:
| Share Class | Opening Shares | Issued | Redeemed | Net Change | Closing Shares |
|---|---|---|---|---|---|
| A Income | 551,990 | 17,489 | (182,326) | -164,837 | 387,153 |
| B Accumulation | 2,010,716 | 265,841 | (403,023) | -137,182 | 1,873,534 |
| B Income | 34
Overall Conclusion: This disclosure reveals a fund in a "contraction and adjustment phase"—shrinking scale, rigid fees, credit upgrades, derivative simplification, and capital migration toward lower-cost share classes. All data jointly point to a new posture of conservatism, low-cost orientation, and low risk appetite, preparing the fund for possible market volatility in the next phase. The subsequent VaR analysis will further quantify this risk preference in concrete terms.
I. VaR Risk Measurement: From Numerical Changes to the Deeper Implications of Model Assumptions
1. 2025 VaR Figures Declined Across the Board: A Signal of Risk Contraction
Based on the disclosed data, all three of the fund's 2025 VaR metrics were below 2024 levels, as follows:
| VaR Metric | 2025 | 2024 | Change |
|---|---|---|---|
| Maximum VaR | 4.10% | 4.99% | -17.8% |
| Minimum VaR | 3.67% | 3.68% | -0.3% |
| Average VaR | 3.87% | 4.26% | -9.2% |
The marked decline in maximum VaR (-17.8%) indicates that the portfolio's potential loss under the most extreme risk scenario during the year narrowed significantly year on year. The 9.2% decline in average VaR suggests that the fund's overall risk exposure is decreasing. This change may stem from two reinforcing dimensions: first, the global bond market underwent a repair in interest-rate expectations during 2024–2025, with rate volatility retreating from the elevated 2024 levels; second, the portfolio may have proactively adjusted duration or credit-risk parameters. It should be emphasized that the minimum VaR was almost flat (3.67% vs. 3.68%), meaning that even in the "calmest" market range, the portfolio's underlying risk did not materially improve—possibly related to the persistent liquidity premium in credit and emerging-market bonds.
2. Decay Factor of Zero: Lagged Risk Under a Long-Term Average Perspective
The report explicitly states that the APT model uses a 180-week historical observation period with a decay factor of zero—that is, all historical data enter the variance-covariance calculation with equal weight. The direct consequence of this design is that the model's predicted risk is essentially a linear extrapolation of the "average risk" of the past 3.5 years, rather than a rapid response to current market conditions.
When market volatility was high in 2024 (e.g., average VaR of 4.26%), a decay factor of zero means that 2025 forecast values will still incorporate the high-volatility year's data, potentially overestimating current risk. Conversely, if the market enters a period of sharp turbulence (such as a sudden credit event), equal-weighted historical data will dilute the short-term risk shock, causing the model to underestimate actual risk. Of particular concern, the 2025 maximum VaR has fallen to 4.10%, well below the 2024 level of 4.99%, but because the model does not differentiate data recency, its assumptions about future risk remain influenced by the 2022–2024 volatility range. This implies that if a black-swan event occurs in the second half of 2025, VaR's practical early-warning capacity could be significantly weakened.
3. The Special Implications of VaR Limitations for Strategic Bond Funds
The fund's investment scope covers equity, interest-rate, inflation, and foreign-exchange risk, and bond assets generally exhibit fat-tailed distribution characteristics. The report acknowledges that VaR is based on normal-distribution assumptions and historical correlations, yet the substantial credit and emerging-market bond holdings of a strategic bond fund have default risks that do not follow a normal distribution. Particularly in a low-rate environment, sudden widening of credit spreads tends to occur in jumps, and such tail risk is systematically underestimated under a 99% confidence, 1-month holding period framework.
Another latent issue is that VaR only captures daily closing risk, but the over-the-counter nature of the bond market prevents some assets from being exited intraday; under a high-liquidity shock, actual losses may exceed VaR estimates. The report mentions that stress testing is used as a supplement, but it does not disclose the specific stress scenarios and results—leaving room for improvement in the completeness of information disclosure.
II. Distribution Tables: Micro-Level Evidence of Distribution Growth and Fund Inflows
1. Distribution Amounts Generally Rose Year on Year, with Increments Arriving in Pulses
Taking Class A Accumulation shares as an example, the following table compares month-by-month distributions with the corresponding prior-year periods:
| Period | 2025 Distribution (pence/share) | Prior-Year Distribution | YoY Change |
|---|---|---|---|
| Jan 31 | 1.170 | 0.660 | +77.3% |
| Feb 28 | 0.870 | 0.660 | +31.8% |
| Mar 31 | 1.030 | 0.660 | +56.1% |
| Apr 30 | 1.090 | 0.970 | +12.4% |
| Dec 31 (2024) | 0.920 | 0.650 | +41.5% |
| Nov 30 (2024) | 1.180 | 0.650 | +81.5% |
It can be seen that November 2024 and January 2025 saw two distinct distribution peaks, with increases exceeding 75%. These two points coincided with a phase of strengthened expectations for global rate cuts and rising bond prices, during which the fund may have realized additional distributions through capital gains. By April 2025, the increase (12.4%) had returned to a moderate level, more consistent with natural growth in coupon income. Notably, the February distribution amount (0.87) declined month on month, possibly related to fluctuations in global capital flows around the Chinese New Year, but it still maintained year-on-year growth.
2. The Share of Equalisation Reveals the Pace of New Inflows
The ratio of Group 2 (subscribed during the period) equalisation to total distributions directly reflects the intensity of new investor inflows. Taking several typical months as examples:
- On January 31, 2025, Class A Accumulation Group 2 equalisation was 0.86405, representing 73.8% of the total distribution of 1.170, indicating that the majority of investors that month had newly purchased during the period.
- On April 30, 2025, Class A Accumulation Group 2 equalisation was 0.39600, accounting for 36.3%, down sharply from January, showing that subscription pace slowed during the period and the share of existing investors recovered.
- On February 28, 2025, Class B Income Group 2 equalisation was 0.21288, with total distribution of 0.300, representing 71.0%, likewise confirming significant net inflows at the start of the year.
The dynamics of the equalisation data portray a fund that attracted strong market interest in Q1 2025, with substantial capital entering near high interest-rate levels. This inflow forms an interesting contrast with the decline in VaR: new investors generally tend to enter when volatility falls, and their participation itself may increase portfolio liquidity, but it may also prompt the fund manager to allocate more to liquid assets, thereby lowering overall risk—offering a behavioral-level supplementary explanation for the VaR decline.
3. Share Class Differences: The Direct Erosion of Distributions by Fee Structures
A horizontal comparison of total distributions over the same period shows that Class C was significantly higher than Class A and Class B. Taking November 30, 2024 as an example:
| Share Class | Accumulation Distribution (pence/share) | Income Distribution (pence/share) |
|---|---|---|
| Class A | 1.180 | 0.390 |
| Class B | 1.320 | 0.420 |
| Class C | 1.560 | 0.460 |
Class C accumulation shares were 32.2% higher than Class A, and income shares were 17.9% higher. This reflects the tiered fee schedule across share classes; Class C is typically oriented toward institutional or higher-net-worth clients, with lower fees, so each unit of investment receives a larger income distribution. This difference is particularly critical in bond funds—because coupon income is thin, even a 0.5 percentage point fee differential can, through long-term compounding, create a substantial distribution gap. When selecting a share class, investors should incorporate management fees, custody fees, and distribution costs into their assessment rather than simply comparing distribution figures.
4. Distribution Table Mechanics: The Equalisation Mechanism and the Principle of Fairness
The distribution table divides investors into Group 1 (holding before the period) and Group 2 (subscribing during the period), and splits Group 2's distribution into net revenue and equalisation. This is not additional fund return, but rather an allocation of accrued income generated during the period between buyers and sellers—the purchase price paid by new investors includes net income that has accrued but not yet been declared for distribution, so the fund returns it at distribution time, avoiding dilution of existing investors' interests.
This is particularly evident in the Class C Income shares on March 31, 2025: Group 2's equalisation was 0.39000, exactly equal to net revenue of 0.39000, and the total distribution was also 0.39000, indicating that subscribers to Class C Income shares that month paid a price that fully covered accrued income, and the distribution was returned entirely in equalisation form. This mechanism ensures that capital inflows and outflows do not undermine the fairness of net asset value distribution, but it also means that frequent subscribers will see a higher equalisation ratio, which can easily be misread as "increased fund distributions."
III. Overall View: The Separation of Risk and Distributions
On the surface, the coexistence of lower fund risk (VaR) and higher distributions in 2025 is not contradictory. VaR measures the potential loss from fluctuations in market factors, while distribution growth relies more on coupon income and realized capital gains. A plausible explanation is that the fund moderately shortened portfolio duration in 2024–2025 while increasing allocations to higher-coupon bonds with acceptable credit quality, thereby reducing sensitivity to interest-rate volatility (lower VaR) while maintaining cash-flow income (higher distributions). In addition, the peak months in the distribution table (such as November and January) often corresponded to periodic rate cuts, and capital gains from bond appreciation may be released by the fund in the form of income. However, this part is not sustainable recurring income. When evaluating the fund's long-term distribution capacity, investors should exclude equalisation and focus on the stability of the net revenue component.
Continued Analysis: Key Findings from Distribution Tables and Dilution Adjustment
I. Distribution Trends by Share Class: September "Final Distribution" Declined Notably
Based on the available monthly data, cumulative distributions across all share classes from May to September 2025 were generally lower than in the prior-year period. Taking A Accumulation as an example, cumulative distributions over the five months (Group 1) totaled 5.30 pence, versus 5.99 pence in the prior-year period, a year-on-year decline of approximately 11.5%. Comparable figures by class are shown below:
| Share Class (Group 1) | 2025 May–Sep Cumulative (p) | 2024 May–Sep Cumulative (p) | YoY Change |
|---|---|---|---|
| A Accumulation | 5.30 | 5.99 | -11.5% |
| B Accumulation | 5.97 | 6.63 | -10.0% |
| C Accumulation | 7.08 | 7.72 | -8.3% |
| A Income | 1.65 | 1.97 | -16.2% |
| B Income | 1.82 | 2.12 | -14.2% |
| C Income | 1.97 | 2.37 | -16.9% |
Core view: The September "Final Distribution" is the largest distribution of the year, but in September 2025, distributions across all classes were only about 60% of the prior-year level (e.g., A Accumulation at 1.19p vs. 1.99p). This significantly dragged down the May–September cumulative figures. Income share classes generally posted larger declines than Accumulation classes, indicating that the fund's distributable income contracted markedly by the end of fiscal 2025, possibly reflecting lower underlying bond coupons, narrower high-yield credit spreads, or dilution effects from changes in fund size.
II. Anomaly in Monthly Distribution Rhythm: Class C July Distributions Entirely Returned as Equalisation
Of particular note is the performance of C Accumulation in July (period ended 31 July 2025):
- Group 1 showed a normal distribution of 1.32000p
- Group 2 showed Net Revenue as `-`, Equalisation as 1.32000p, and total distribution also of 1.32000p
This means that during July, all holders of C Accumulation shares were classified into Group 2, and the distribution came entirely from equalisation (capital return), with no net revenue whatsoever. This is highly unusual in practice and may represent: the share class experienced large-scale subscriptions or redemptions in July, leaving very little or even zero stock outstanding at the start of the period, with all existing shares newly subscribed during the period; or the sub-share class underwent a "liquidation and reopening" event. By contrast, in August and September, C Accumulation's Group 2 returned to being fully consistent with Group 1 (equalisation of zero), showing that the anomaly was confined to July and warranting investor attention to possible liquidity or subscription/redemption concentration issues in Class C during that month.
III. Equalisation Amounts Reveal Subscription Timing and Scale
The Group 2 equalisation data can be used to infer the time distribution of new capital inflows:
- September (final distribution): B Accumulation's equalisation was as high as 1.08490p, while net revenue was only 0.24510p, indicating that most of the "distribution" received by investors subscribing in September was actually the return of accumulated income embedded in their purchase price, with very little true income contribution. Over the same period, A Income's equalisation (0.26182p) also far exceeded net revenue (0.10818p).
- May: For A Accumulation Group 2, equalisation of 0.47343p vs. net revenue of 0.57657p were close, suggesting more dispersed subscription timing.
These data help determine that new capital was mainly concentrated near the distribution record date (i.e., September), which also explains why the equalisation share was extremely high in September. For long-term investors, equalisation is not incremental return; more importantly, it indicates that the fund attracted substantial capital in September, potentially causing some dilution of interests for existing shareholders—but the Dilution Adjustment mechanism is precisely designed to mitigate such effects.
IV. The Practical Significance of the Dilution Adjustment Policy
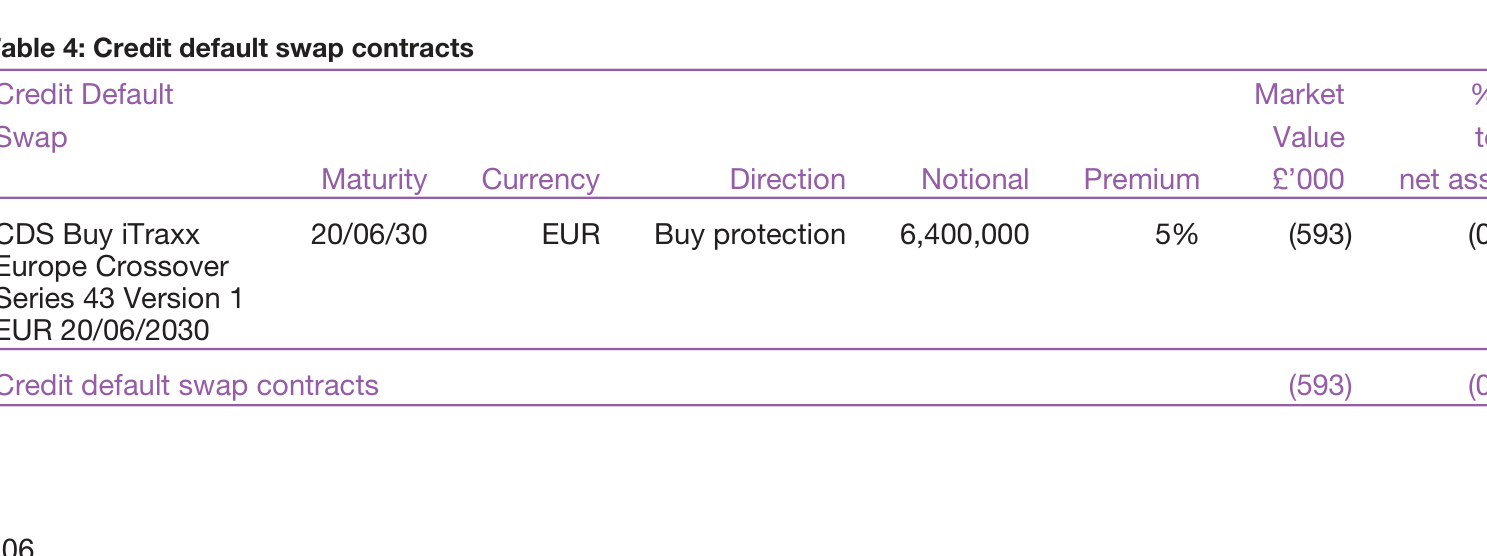
The General Information section details the volatility adjustment mechanism adopted by the ACD (Authorised Corporate Director). Its core points:
1. Opaque trigger conditions: The ACD has the right to raise the dilution adjustment when net subscriptions or redemptions exceed a threshold, but the threshold "varies by fund and market conditions" and the specific number is not publicly disclosed. Investors cannot predict in advance whether a higher adjusted price will be applied on a given trading day.
2. Small transactions are equally affected: The document explicitly states that when the threshold is triggered, all transactions on that day (including small transactions) will be executed at the higher adjusted price. This may cause small investors to bear additional costs similar to those borne by large institutional investors.
3. Clear long-term direction: The ACD believes that applying a dilution adjustment "will not result in significant dilution," and the current policy treats all sub-share classes equally. This is in effect a swing pricing mechanism, which is increasingly common in open-ended funds.
Combining the September 2025 distribution data with this policy, if net inflows increased substantially in that month (as the equalisation figures suggest), the dilution adjustment may already have been in effect, and investors subscribing in September could have executed at prices above the unadjusted "mid price." This is consistent with the high Group 2 equalisation, indicating that new capital bore adjustment costs upon entry and subsequently received only capital returns in the distribution—two factors that together reduced the actual yield for new investors.
V. Cross-Share-Class Comparison: Class C Fee Advantage and Distribution Gap
Class C shares are typically aimed at institutional investors and carry lower fees, so under the same portfolio, Class C net income distributions should be higher than Class A. From the May–September cumulative distributions:
- C Accumulation cumulative 7.08p vs. A Accumulation 5.30p, approximately 33.6% higher.
- C Income cumulative 1.97p vs. A Income 1.65p, approximately 19.4% higher.
However, Class C's September distribution declined approximately 39% year on year, slightly less than Class A's roughly 40% decline, and the July anomaly occurred only in C Accumulation. This suggests that although Class C has a clear fee advantage, its fund-flow structure is more concentrated, and institutional subscription/redemption behavior may amplify distribution volatility in any single month.
VI. A Forward-Looking View on Distribution Sustainability
Given that the September final distribution declined sharply year on year, and the Dilution Adjustment section emphasizes that "the adjustment may be larger when market liquidity is constrained," it is reasonable to infer:
- The distributable income from the fund's underlying assets is declining, likely because shifts in the interest-rate cycle have lowered coupon reinvestment yields.
- If subsequent net inflows continue to exceed the threshold, the dilution adjustment will be triggered more frequently, further compressing new investors' net returns.
- For income-oriented investors who rely on distributions, the near-40% year-on-year decline in Income shares in September means annual cash returns will shrink noticeably, warranting consideration of asset allocation adjustments or a reassessment of the fund's yield expectations.
(This section does not repeat the fund overview and investment strategy analysis previously discussed; it focuses on the Distribution Tables and General Information portions provided this time.)
The following is additional analysis of the continuation content, focusing on clause details, tax implications, and share class design logic not previously addressed.
Tax Information Reporting and CRS Compliance
The ACD is required to collect and report to HMRC shareholders' identity, tax residency, tax status, and financial information related to shareholdings, and HMRC may exchange the information with tax authorities in other jurisdictions. This is essentially the fund-level implementation of the Common Reporting Standard (CRS) and the Foreign Account Tax Compliance Act (FATCA). For investors, this means:
- Upfront reporting obligations: Shareholders must not only provide identification, but also submit self-certification and tax reference numbers. If they refuse to cooperate, the ACD retains the right to refuse their subscription (original: “reserves the right to refuse an...”).
- Cross-border transparency: Even if investors do not proactively disclose overseas tax residency, the ACD remains obligated to report to HMRC, which will automatically exchange the information. This significantly reduces the possibility of concealing overseas assets through UK fund structures.
Notably, this requirement applies to shareholders and “controlling persons,” meaning that the ultimate beneficial owners behind institutional investors (such as trust settlors and corporate beneficial owners) may also be looked through and reported at the holder level.
Dilution Adjustment Policy Flexibility and Investor Uncertainty
The terms are clear: dilution adjustment decisions will be reviewed periodically, and the ACD may make different decisions in similar circumstances in the future. This means that dilution adjustments are not a fixed rule but a discretionary liquidity management tool. Its potential implications:
- Price unpredictability: Investors cannot know in advance whether a dilution adjustment fee will be charged upon subscription/redemption, nor can they determine the adjustment magnitude. Even under identical market conditions, the ACD may change its decision.
- One-sided protection mechanism: Raising transaction prices on net inflows and lowering them on net outflows effectively uses incoming or outgoing capital to compensate remaining shareholders for the "dilution costs" (e.g., bid-ask spreads, transaction fees) arising from trading. However, policy flexibility allows the ACD to forgo adjustments in some cases, in which remaining shareholders may bear adverse effects (original text: "adverse impact on the value of the Scheme Property").
- Fairness across classes: Although each share class is priced separately, dilution adjustments affect each class on a percentage basis, ensuring that the relative burden across holders of different classes is consistent and preventing any particular class from being systematically favored.
Comparison of Share Class Access Restrictions and Fee Structures
The follow-up discloses the specific share class eligibility criteria, which are more granular than the broad "retail/institutional" distinction:
| Share Class | Access Conditions | Typical Fees (using Strategic Bond Fund as an example) | Minimum Investment (excluding Emerging Markets) |
|---|---|---|---|
| Class A | Written agreement with the ACD or its affiliates required (from 1 March 2022; existing holders before 28 February are exempt) | 1.00% | £1,000 |
| Class B | No explicit restrictions; typically aimed at institutional or high-net-worth investors | 0.50% | £100,000 |
| Class C | Limited to investors for whom the ACD's affiliates provide investment management services, or who have a separate fee arrangement | Nil (but separate charges may apply) | £250,000 |
Key interpretation:
1. Class A's substantive transformation: From 1 March 2022, new Class A investors must sign a written agreement with the ACD. This effectively shifts Class A, originally intended for direct retail subscriptions, toward an "authorised channel" via financial advisers, platforms, or institutional intermediaries, while exempting existing holders—reflecting the regulatory practice of a "grandfather clause".
2. The "zero-fee" illusion of Class C: Class C's AMC is Nil, but the access conditions require a "separate fee arrangement", indicating that fees are not collected through the fund, but rather investors pay service fees directly to the affiliate. This "free shell" model is common in separately managed accounts or bundled-fee platforms.
3. Class B is the category that actually carries institutional money: the £100,000 minimum investment and lower AMC (0.25%-0.50%) are consistent with the institutional share class conventions of UK OEICs.
4. All share classes of the closed fund (Emerging Markets Bond Fund) are marked n/a, indicating that the fund has ceased new subscriptions and conversions, but may still be in liquidation or under continuing management.
Equalisation Mechanism: Tax Treatment and Capital Nature
The follow-up adds key tax details: for Group 2 share holders, the equalisation payment received at the first distribution is a capital return, not income:
- Tax impact: It is not included in taxable income, but the amount must be deducted from the share cost to compute the cost basis for future capital gains tax (CGT). This aligns with UK tax law's treatment of capital returns.
- Impact on long-term investors: Equalisation is allocated evenly among all new subscribers in the same distribution period, aiming to eliminate the tax unfairness of new shareholders "buying accrued income". However, this mechanism may cause Group 2 shareholders who redeem early to exit before the first distribution, leaving the equalisation unrecovered — effectively bearing a capital loss.
- Conversion mechanics: The ACD will also apply an "income equalisation-like" mechanism to share class conversions, ensuring that converters neither take ownership of others' accrued income nor have their own entitlement stripped away. However, the specific algorithm has not been disclosed, leaving room for discretion.
Trigger Condition for SDRT: Non-Pro Rata In Specie Redemption
The provisions clearly state that ordinary redemptions/transfers of shares do not give rise to Stamp Duty Reserve Tax (SDRT), but non-pro rata in specie redemptions may trigger SDRT. The legal logic here is as follows:
- When a fund satisfies a redemption with portfolio assets directly rather than in cash, if the asset allocation ratio does not correspond to what all shareholders would be entitled to on a pro rata basis (for example, a specific shareholder selects specific bonds), it may be deemed a "chargeable transfer" of assets, thereby attracting SDRT at 0.5%.
- This provision implies that when institutional investors carry out large in specie redemptions, poor structuring may generate additional transaction costs. However, pro rata in specie redemptions are generally exempt, because no substantive change in ownership occurs.
- The impact on ordinary retail investors is minimal, since their redemptions are typically settled in cash.
Legal Validity of Conflict Management and Third-Party Data Disclaimers
- Conflict management: The ACD acknowledges that it and the investment adviser may simultaneously serve other clients and face potential conflicts of interest, but commits to prioritizing the company's best interests ("so far as practicable"), and has arranged organizational and administrative measures (firewalls, decision records, disclosure mechanisms). This aligns with the principles on conflict management in Chapter 10 of the FCA's Senior Management Arrangements, Systems and Controls (SYSC). The depositary may also serve other funds, further highlighting that the custodian's independence relies on internal controls rather than organizational segregation.
- Third-party data disclaimer: ICE Data explicitly states that it does not warrant the accuracy, completeness, or suitability of the index data, and provides it on an "as is" basis. This is a typical "data substitution" clause—the fund manager is not liable to investors for errors by the index provider. For investors, this means: for valuation errors, tracking errors, or benchmark distortion caused by index changes, the only party that can be claimed against is the fund itself, and the fund, in turn, shifts the risk to investors through the disclaimer clause, excluding the data provider. This risk is particularly critical in passive tracking strategies, but as this ICVC is an actively managed bond fund, the specific impact is limited.
Supplementary Data: Minimum Investment Amounts and AMC Cross-Comparison
| Fund Name | Class A AMC (%) | Class B AMC (%) | Class C AMC (%) | Class B Minimum Investment (£) | Class C Minimum Investment (£) |
|---|---|---|---|---|---|
| High Yield Bond Fund | 1.00 | 0.35 | Nil | 100,000 | 250,000 |
| Investment Grade Bond Fund | 1.00 | 0.25 | Nil | 100,000 | 250,000 |
| Strategic Bond Fund | 1.00 | 0.50 | Nil | 100,000 | 250,000 |
It is evident that the Investment Grade Bond Fund has the lowest Class B fee (0.25%), reflecting that its credit risk and management complexity are lower than those of the high yield and strategic bond funds. Although Class C has zero AMC, its actual fee structure depends on external arrangements. When comparing total expense ratios (TER), investors should include the separately paid management fee; otherwise, the true cost of holding may be underestimated.
Fund Cluster and Product Line Planning
At the end of the follow-up article, a full landscape of the group's funds is laid out: in addition to the Bond Funds ICVC, it also includes the Overseas Growth Funds ICVC, the Investment Funds ICVC, and the UK & Balanced Funds ICVC, covering geographic, thematic, multi-asset, and other strategies. It specifically notes that the Emerging Markets Bond Fund has been closed to new subscriptions, indicating that this fund previously belonged to this ICVC but is now frozen—which may be part of product lifecycle management, namely closing sub-funds that are uncompetitive or insufficient in scale while retaining existing shares to preserve existing exposure.
The list also offers a lesson for investors: different funds managed by the same ACD may follow similar investment processes, but cross-holdings and trading coordination among funds could give rise to conflicts of interest—which is precisely the rationale behind the conflict management provisions discussed earlier in the report.
Summary
The legal details in this follow-up reinforce the "informed but not protected" characterization of investors in fund governance: clear tax transparency obligations, retained dilution adjustment rights, tiered fees across share classes, scheme-specific SDRT risk, and comprehensive data disclaimers. Investors should pay particular attention to the written agreement threshold for Class A shares, the tax treatment basis of Equalisation, and the potential costs of non-pro rata in-kind redemptions—provisions that are easy to overlook on first reading yet may have a material impact at critical investment decision points.
Based on the provided follow-up content, this section is no longer the main body of the "Introduction" but rather the fund product appendix, footnotes, and client contact information. Drawing on the earlier analysis of Baillie Gifford's product line and investment philosophy, this appendix offers several new analytical dimensions worth adding, particularly regarding dynamic product adjustments and brand naming strategy.
Product Lifecycle Management: The Rhythm of Discontinuations, Renames, and New Launches
The footnotes in the text explicitly disclose multiple fund status changes, reflecting the fund company's proactive adjustments in response to changing market conditions and client preferences. The details are summarized below:
| Fund Name (Former) | Final Status | Effective Date | Change Type |
|---|---|---|---|
| Emerging Markets Bond Fund | Closed to new subscriptions | Not specified | Termination |
| Multi Asset Growth Fund | Closed to new subscriptions | Not specified | Termination |
| Health Innovation Fund | Closed to new subscriptions | Not specified | Termination |
| Sustainable Multi Asset Fund | Renamed Defensive Growth Fund | 2024-12-02 | Rename |
| Sustainable Income Fund | Renamed Monthly Income Fund | 2025-01-31 | Rename |
| — | Cautious Managed Fund (new launch) | 2025-07-31 | Launch |
This series of actions reflects three key strategies:
1. Trimming Inefficient or Ambiguously Positioned Products: Three funds were closed to new subscriptions. Among them, the Health Innovation Fund and the Emerging Markets Bond Fund are thematic/regional products that may have been consolidated due to insufficient scale or underperformance; the Multi Asset Growth Fund, meanwhile, overlapped with other funds in the multi-asset category.
2. From "Philosophy Labels" to "Functional Labels": The two funds whose original names carried "Sustainable" were renamed "Defensive Growth" and "Monthly Income" respectively, removing the sustainable investing theme emphasis and instead highlighting risk-return characteristics. This may be because clients now focus more on a fund's actual function (defensive attributes, cash flow generation), while "sustainable" as a selling point no longer attracts capital as it did in previous years.
3. A New Product Fills the Conservative-Demand Gap: The Cautious Managed Fund, launched in July 2025, precisely fills the "cautious/defensive" positioning vacancy left after the Defensive Growth Fund's renaming, forming a seamless link within the product spectrum.
Geographic and Asset-Class Coverage Reflected in the Fund List
The 16 funds listed in the appendix (including duplicate spelling errors) can be roughly categorized:
| Region | Fund Name |
|---|---|
| Global | Global Alpha Growth, Global Income Growth, International, Managed, Global Alpha Paris-Aligned, Responsible Global Equity Income, Sustainable Growth, UK and Worldwide Equity |
| Japan | Japanese Income Growth |
| UK | UK Equity Core, UK Equity Alpha |
| Multi-asset | Defensive Growth, Monthly Income, Cautious Managed, Multi Asset Growth (discontinued) |
| Bonds | Sterling Aggregate Bond |
| Thematic | Health Innovation (discontinued), Positive Change |
This arrangement shows that Baillie Gifford, while maintaining its core global growth style, is attempting to attract investors with different risk preferences through segmented products such as "income", "defensive", and "Paris-aligned" offerings. However, relative to its strength in active equities, bond and multi-asset products are limited in number; the discontinuations and renames in the appendix precisely corroborate the company's contraction in non-core areas.
Details of Client Service Information and Compliance Presentation
The contact section provides the Edinburgh office address, toll-free telephone number, website, email, and fax. Notably, the recorded telephone message notice—"for training or monitoring purposes"—is standard compliance wording in the UK financial services industry and conforms to FCA regulatory requirements. In addition, the footer copyright notice reads "© Baillie Gifford & Co 2009", while the report is dated September 2025; such a long-standing copyright year is likely merely a legal template convention rather than an annual update.
Connections to the Earlier "Introduction" Analysis
If the investment philosophy in the earlier analysis letter emphasized "long-term growth and active management", then the product renaming direction in this appendix (from sustainable to defensive/income) appears to deviate slightly from the core philosophy—defensive and income typically skew toward shorter-term needs. However, this may also be a deliberate complement: enabling the product line to cover a more complete range of lifecycle needs rather than a single growth style. The discontinuation of the Health Innovation Fund hints at the risks of thematic-style bets, which is not inconsistent with Baillie Gifford's preference for long-term concentrated investing—it is simply that the chosen track is not favored by the market at present.
The above are the additional analytical points from this appendix segment. Through the footnotes and the fund list, one can gain a more granular understanding of Baillie Gifford's product strategy adjustments and the evolution of its market positioning.
Position Moves
| Instrument | Direction | Author's Stance in One Sentence | Key Data |
|---|---|---|---|
| Baillie Gifford Emerging Markets Bond Fund | Liquidation | Terminated liquidation, reported on a non-going-concern basis; the audit "ring-fenced" its impact via an emphasis of matter paragraph. Expected to fully exit the fund structure by 2026. | Closure date: 22 April 2024; report date: 28 November 2025; liquidation costs borne by the ACD |
| Baillie Gifford Strategic Bond Fund | Hold / Observe | A monthly distributor among the going-concern sub-funds; cash flow needs dictate the portfolio's coupon structure. Audit opinion was unqualified. | Distribution frequency: monthly; type: interest distribution |
| Other going-concern sub-funds (not individually named) | Hold / Observe | Prepared on a going-concern basis, quarterly distributions, overall unqualified audit opinion. However, attention should be paid to the transition to the new SORP and deeper risk disclosures. | Distribution frequency: quarterly; type: interest distribution |
| Baillie Gifford Bond Funds ICVC (overall legal entity) | Not stated | Sub-funds under the same legal entity run in parallel on a "segregated basis"; the auditor makes separate judgements at the company level and the sub-fund level. The liability segregation mechanism is notable. | OEIC structure, 4 sub-funds; the audit report cites CIS sourcebook paragraph 4.5.12 and OEIC Regulations 2001 paragraph 67(2) |