A Tale of Two Neighbours: The Tiger and the Lion
Hosking Partners is a London boutique founded in 2013 by Jeremy Hosking, a portfolio manager at Marathon Asset Management for over 25 years. It runs a single global equity strategy built on the capital-cycle, supply-side approach — contrarian, long-term, and unusually diversified (350+ holdings) under a multi-counsellor model, managing around $5.5bn.
In plain words
This report compares two neighboring stock markets: India's is expensive (24 times earnings) while Sri Lanka's is cheap (10 times). The author warns that India may be overvalued and risky, while Sri Lanka, despite a recent debt default and crisis, is recovering and deeply undervalued. For regular investors, this means don't chase hot markets blindly—look for overlooked places with improving fundamentals. The report uses simple metrics like market value vs. GDP and per-person market cap to show why this gap might not last.
Hosking Partners report contrasts extreme valuation divergences between Indian and Sri Lankan stock markets: India's SENSEX trades at 24x P/E, the Nifty 500 has risen 383% cumulatively over the past 15 years (11% annualized), the market-cap-to-GDP ratio stands at 144%, approaching the 2007 highs and
Theme and Background
This chapter focuses on the extreme valuation divergence between the Indian and Sri Lankan stock markets. The author argues this is one of the most striking contrasts in emerging markets — and indeed globally — today: India's SENSEX trades at 24x P/E, while Sri Lanka's CSE index sits at just 10x P/E, representing two poles of market euphoria versus deep undervaluation.
Core Argument
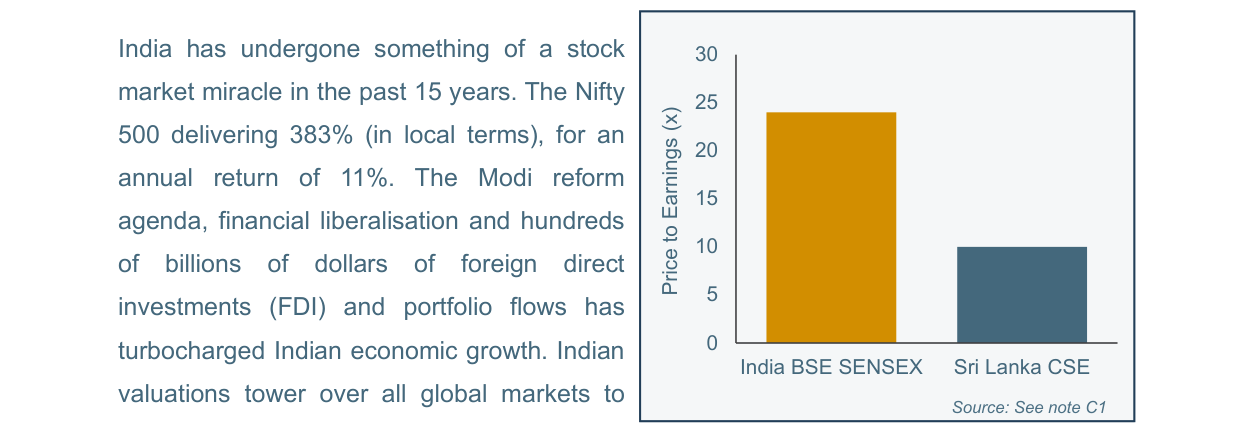
India's BSE SENSEX P/E ratio is approximately 24x, significantly higher than Sri Lanka's CSE at 10x
The author's core thesis is that, within the capital cycle framework, investors should be wary of a potential valuation bubble in India while focusing on the opportunity presented by Sri Lanka's crisis-depressed valuations. This is a contrarian view — India has been the star of emerging markets over the past 15 years, whereas Sri Lanka has suffered a sovereign default and a 70% decline in USD terms.
Key Arguments and Data
- India's "Miracle" and Bubble Signals: The Nifty 500 has risen 383% over the past 15 years (11% annualized), but the market-cap-to-GDP ratio has reached 144%, close to the 2007 peak, more than double that of China, and above the 100% threshold of the "Buffett Indicator."
- Sri Lanka's Crisis and Recovery: A series of shocks — the 2019 terrorist attacks, the COVID-19 pandemic, and the 2022 sovereign default — caused a 70% decline in USD terms. However, following IMF-backed reforms, GDP growth has exceeded 5%, inflation has fallen to 1%, and the country has recorded three consecutive years of current account surpluses (the first time since independence in 1948).
- Extreme Valuation Divergence: Sri Lanka's GDP per capita ($4,500) is 1.6x that of India ($2,700), but Sri Lanka's stock market capitalization per capita is only about half of India's ($1,200 vs $3,200), resulting in an overall valuation gap of 2.5x.
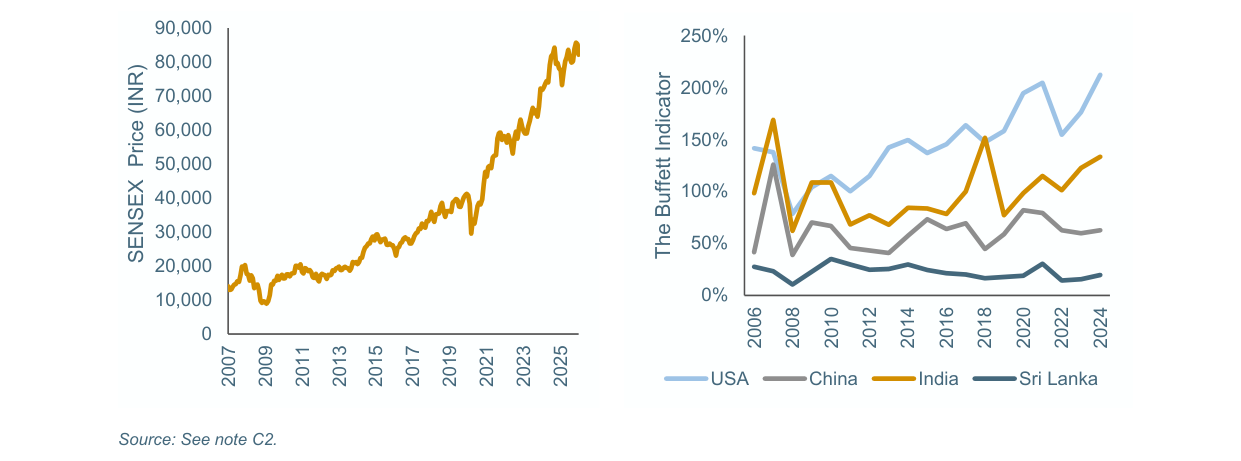
India's SENSEX index has risen steadily from around 20,000 in 2007 to approximately 85,000 in 2025
Comparative Data Table:
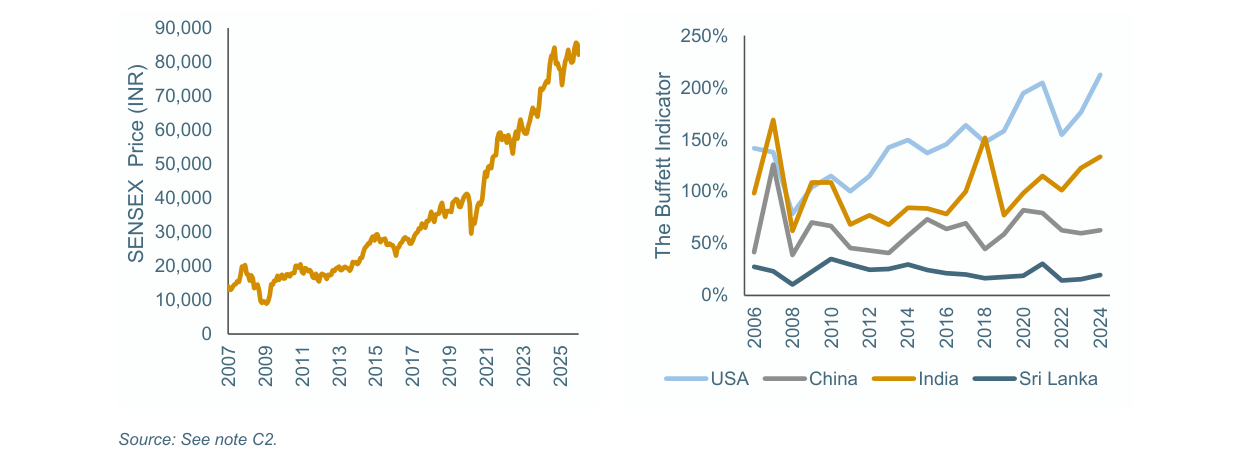
India's Buffett Indicator is about 140%, the US over 200%, China around 60%, and Sri Lanka below 20%
| Indicator | India | Sri Lanka |
|---|---|---|
| Market P/E | 24x | 10x |
| Market Cap / GDP | 144% | 26% |
| GDP per capita (USD) | $2,700 | $4,500 |
| Market Cap per capita (USD) | $3,200 | $1,200 |
| 2025 GDP growth (est.) | 4.4% | 6.8% |
| 5-year USD return | 69% | 107% |
| 10-year USD return | 163% | 48% |
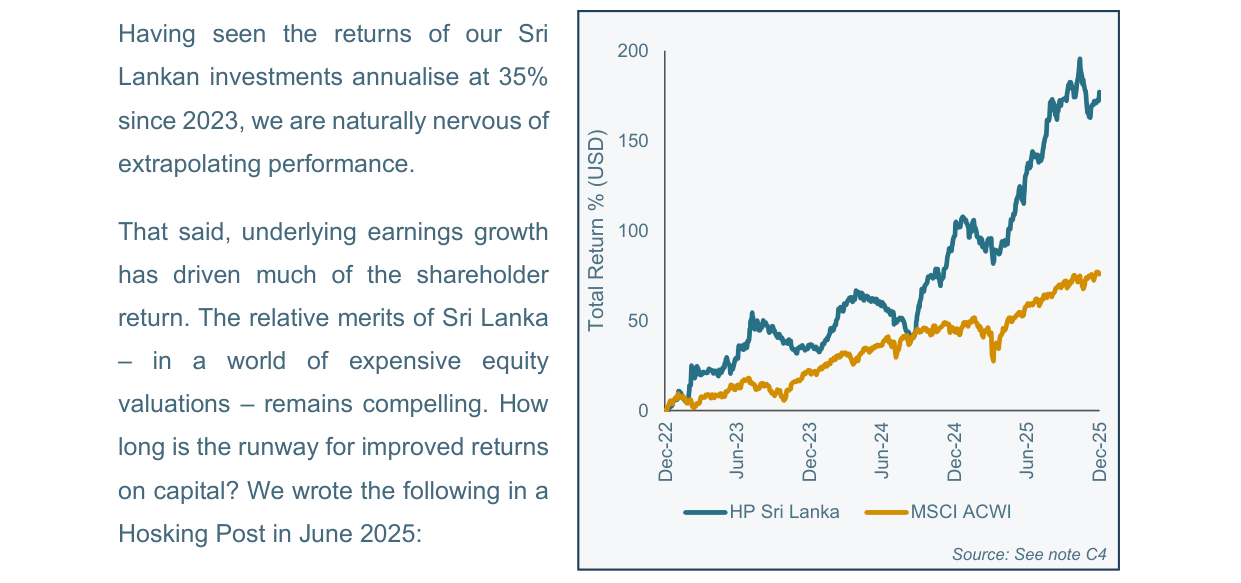
HP Sri Lanka portfolio has delivered a total return of approximately 180% since December 2022, significantly outperforming the MSCI ACWI's roughly 75%
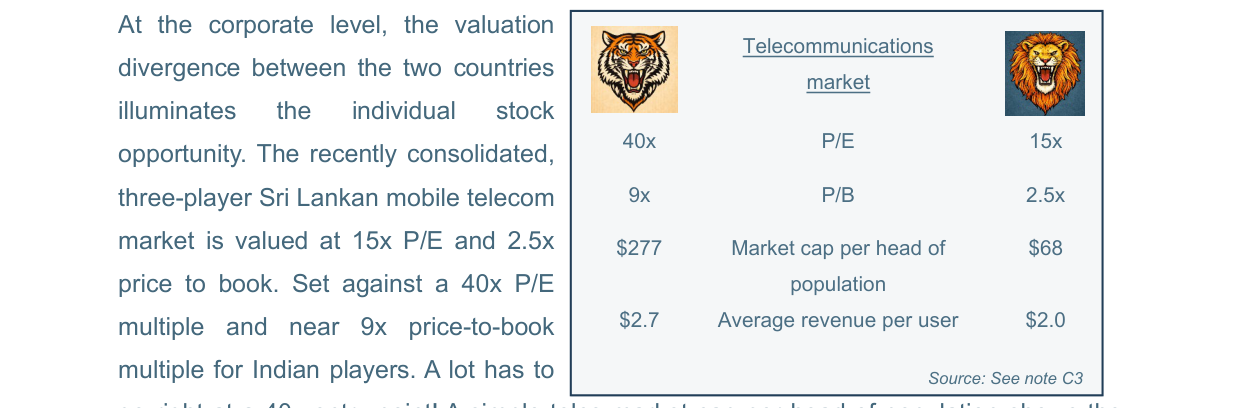
India's telecom sector: P/E 40x, P/B 9x, market cap per capita $277; Sri Lanka: P/E 15x, P/B 2.5x, market cap per capita $68
Companies / Assets Discussed
- Sri Lanka holdings (Hosking bullish): Dialog Axiata (telecom), John Keells (conglomerate), Aitken Spence (tourism/logistics), Lion Brewery (consumer). The report argues that these companies have strengthened their market dominance through M&A and capacity rationalization during the crisis, improving forward returns.
- India telecom sector (bearish thesis): As an example, Indian telecom companies trade at 40x P/E, nearly 9x P/B, and a market-cap-to-population ratio of $277; Sri Lanka's telecom trades at just 15x P/E, 2.5x P/B, and $68 per capita. Although India's ARPU is higher ($2.7 vs $2.0), the author believes Sri Lanka has greater room for ARPU and penetration growth (4G data traffic growing nearly 20% per year).
- Indian investment giants: Reliance, Adani, and Bharti are investing in Sri Lankan infrastructure, and Indian tourists (expected to reach 500,000 in 2025) are a key incremental driver of Sri Lanka's tourism economy.
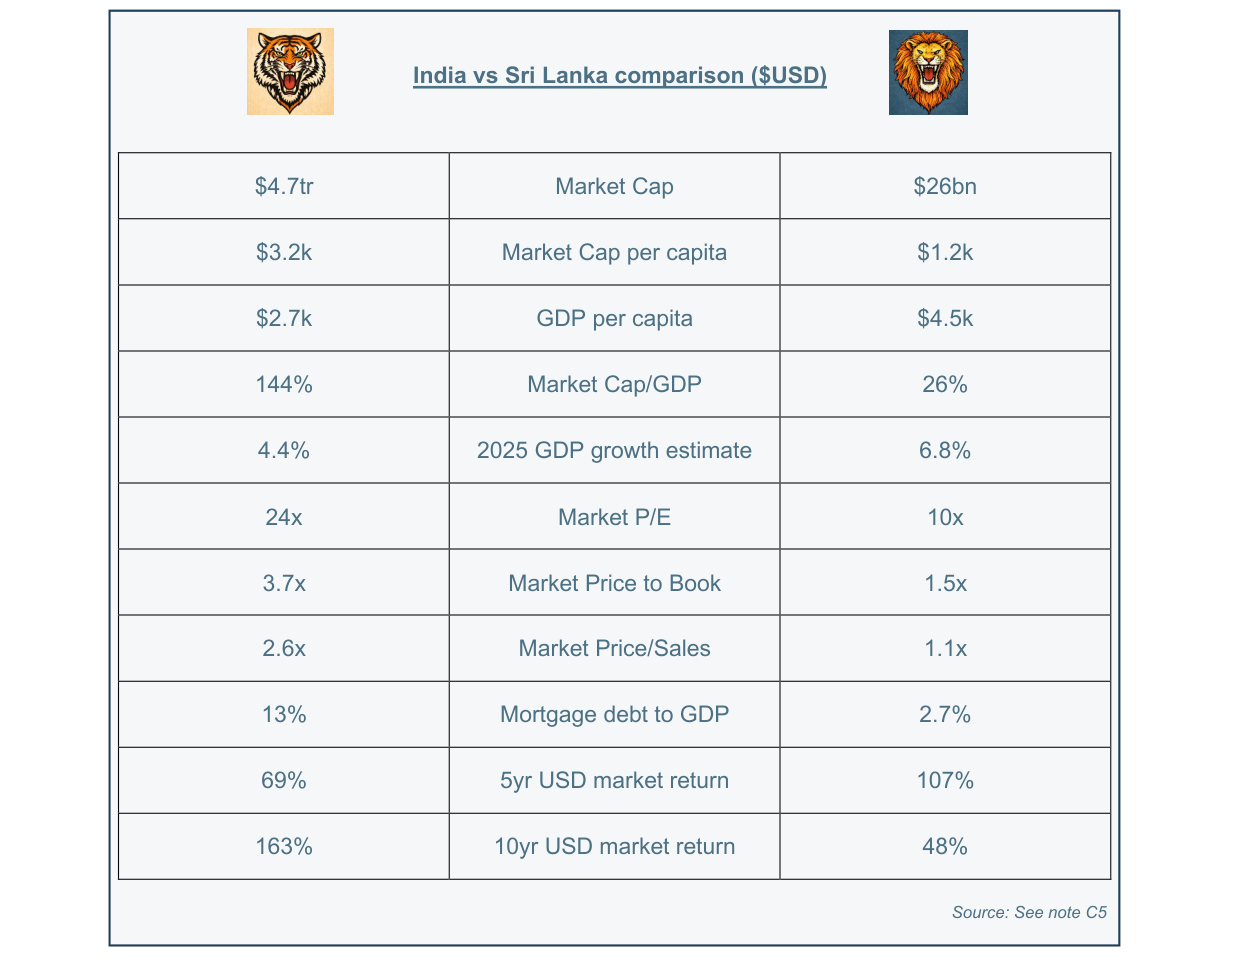
India: market cap $4.7 trillion, P/E 24x, GDP per capita $2.7k; Sri Lanka: market cap $26 billion, P/E 10x, GDP per capita $4.5k
Investment Implications
- Long Sri Lanka "survivor" companies: The author believes Sri Lanka is in the mid-phase of a cyclical recovery, with GDP growth from a low base, mortgage lending (only 2.7% of GDP vs India's 13%), and huge room for consumer expansion. Holding high-quality dominant companies should continue to deliver valuation recovery and earnings growth.
- Be wary of India's bubble: India's valuations have already priced in substantial growth expectations, especially in sectors like telecom, with high potential for downside. Investors should avoid chasing the "star" market at elevated valuation levels.
- Focus on mean reversion: In 2010, Sri Lanka's P/E reached 20x (higher than India's 17x), indicating that the current 2.5x valuation gap is extreme and unsustainable, likely to converge over time.