Q4 2025 - Quarterly Report Commentary
Hosking Partners is a London boutique founded in 2013 by Jeremy Hosking, a portfolio manager at Marathon Asset Management for over 25 years. It runs a single global equity strategy built on the capital-cycle, supply-side approach — contrarian, long-term, and unusually diversified (350+ holdings) under a multi-counsellor model, managing around $5.5bn.
In plain words
This report explains how Hosking Partners beat the market in 2025 by using a 'capital cycle' strategy—buying unloved companies with improving fundamentals and avoiding overhyped stocks. They earned 33.5% vs. the market's 22.4%. Key moves: underweighting US tech giants (like the Mag-7) and overweighting emerging markets, Japan, and old-economy stocks (mining, banks). They argue that AI's massive spending on data centers will hurt tech firms' returns, while traditional sectors are recovering. For regular investors, the takeaway is to avoid chasing hot trends and diversify across regions and industries.
Hosking Partners achieved a net return of 7.2% in Q4 2025, outperforming the MSCI All Country World Index's 3.3%; full-year net return was 33.5%, with excess returns of 1114 bps. The report emphasizes the advantages of its diversified contrarian investment strategy (Capital Cycle): underweighting th
Theme and Background
This chapter is the Q4 2025 and full-year investment review of Hosking Partners. The report focuses on the standout performance of its capital cycle contrarian strategy in 2025, analyzing in detail how structural positioning—underweighting the US, overweighting Emerging Markets/Japan/UK, underweighting tech (IT at 8% vs. index 27%), and overweighting old-economy sectors such as metals and mining and financials—delivered excess returns. The author also discusses the potential inflection point in growth/value style rotation driven by the surge in AI capital expenditure.
Core Views
The author explicitly judges that the 2025 performance (net return 33.5%, excess return 1,114 bps) is not accidental, but a reflection of the long-term advantages of a diversified contrarian strategy under the capital cycle investment framework. Key views include:
- Contrarian judgment: The market's singular focus on "American exceptionalism" and AI is approaching extremes. Extreme valuation dispersion (the largest approximately 100x price-to-sales) signals that mean reversion is imminent and could be a multi-year process.
- Long value/old economy vs. short Mag-7 growth: Surging capital intensity among IT industry leaders (McKinsey estimates $5.2 trillion in physical asset investment) will depress their ROA, thereby justifying valuation compression.
- Emerging Markets and Japan are long-term winners: A weak US dollar outlook and improving ROA in Japan (driven by activist investors) provide long-term upside.
Key Arguments and Data
Performance comparison (the author believes contributions from overweights/underweights):
| Sector/Region | Strategy Weight | Index Weight | Q4 Stock Contribution | Full-Year Contribution |
|---|---|---|---|---|
| US | 35% | 64% | Overall +9% vs. Index +2% | Stock selection excess contributed approximately 1,000 bps |
| IT | 8% | 27% | Positive (Mag-7 underperformed) | Strategy IT stocks +83% vs. Index +26% |
| Metals & Mining | 12% | 2% | Platinum stocks gained 28%–24% in Q4 | South African PGM stocks +243% to +360% full year |
| Financials | 26% | 18% | Stocks +16% to +43% | Positive full-year contribution |
| Japan | 14% | 5% | Slight drag in Q4 (yen weakness) | Positive full-year contribution (multiple stocks +41% to +117%) |
| Emerging Markets | Overweight | / | Positive contribution | Full year +69% vs. Index +34% |
Extreme valuation data:
- EV/Sales spread: Value trap bottom about 0.33x annual sales, growth stock top above 30x, a gap of approximately 100x, which the author believes is a record in capitalist history.
- Capital expenditure: McKinsey estimates the AI arms race will lead to $5.2 trillion in physical asset investment, compressing IT giants' ROA.
Macro drivers:
- A weak US dollar boosted returns in Q4 and could continue to benefit Emerging Markets.
- Expectations of a 2026 rate hike in Japan may strengthen the yen, benefiting Japan positions.
Companies/Assets Involved
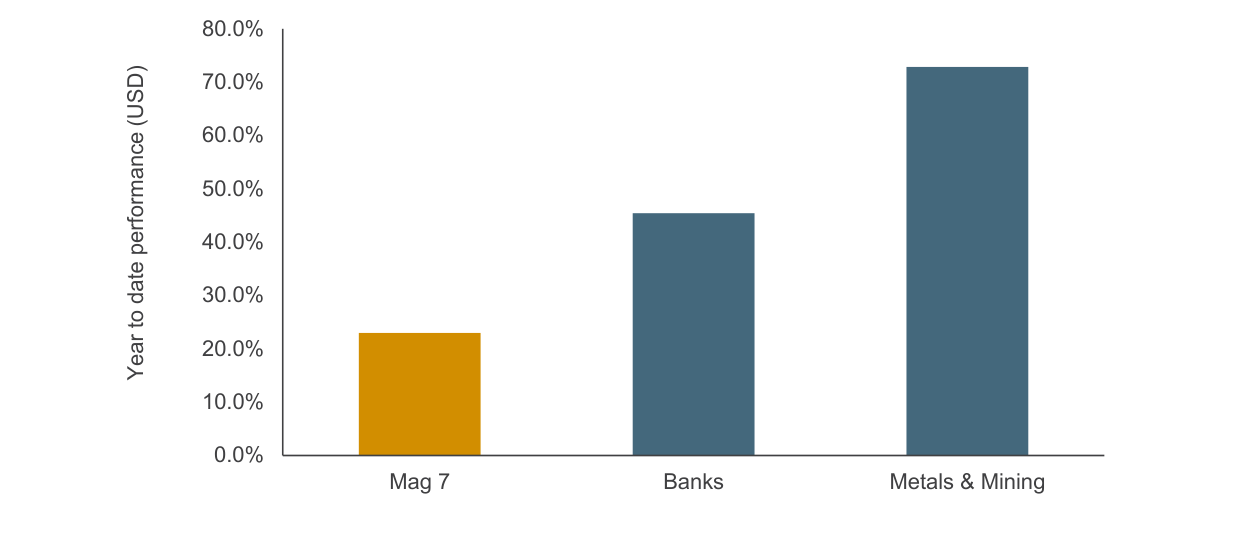
Year-to-date 2025, Mag 7 rose approximately 23%, banks approximately 45%, metals & mining approximately 72%
US stocks (long):
- Micron: Q4 +71% (full year +240%)
- Freeport-McMoRan: Q4 +30%
- Warrior Met Coal: Q4 +39% (full year +63%)
- Alcoa: Q4 +62%
- Seagate: Full year +225%
- Citigroup: Full year +70%
- Millicom International: Full year +121%
- Synchrony Financial: Q4 +18%
- Barclays: Q4 +25%
Emerging Markets/South African PGMs:
- Impala Platinum: Q4 +24% (full year +243%)
- Sibanye Stillwater: Q4 +28% (full year +360%)
- Northam Platinum: Full year +298%
- SK hynix: Full year +287% (South Korea)
- Samsung: Full year +111% (South Korea)
- Shinhan Financial Group: Full year +71% (South Korea)
Japan:
- Toyo Seikan Group: Full year +65%
- Fuji Media Holdings: Full year +117%
- Aichi Financial Group: Full year +90%
- Tosei Corporation: Full year +41%
Other financials:
- Saga: Q4 +43%
- Aichi Financial Group: Q4 +39%
Not held but used as negative reference: Mag-7 (Microsoft, Apple, etc.) underperformed in Q4 and full year; the author believes their valuation compression has just begun.
Investment Implications
- Underweight US still has room: The US accounts for 64% of the index, the strategy only 35%; under a weak dollar, continuing to underweight the US is the direction.
- Overweight Emerging Markets (ex-tech and especially Asia): Disappointing performance over the past 15 years; current valuations and corporate earnings have room to rise; a weak dollar is a catalyst.
- Overweight Japan: Yen weakness is a short-term distraction; corporate reform (rising ROA) is the long-term logic. Watch for exchange rate benefits from rising interest rates.
- Underweight IT and overweight old economy (metals & mining, financials): AI capital expenditure will reduce IT giants' ROA, while value stocks (banks, miners) are at an upward inflection point. Mean reversion could last for years.
- Avoid concentrated holdings: Diversification (the strategy holds 50+ Japanese stocks) is key to capturing structural reversals.