4Q 2022 GMO Quarterly Letter
GMO is a Boston asset manager co-founded in 1977 by Jeremy Grantham with Richard Mayo and Eyk Van Otterloo, known for valuation-driven dynamic asset allocation built on long-horizon mean reversion. Grantham is famous for calling historic bubbles, warning publicly ahead of both the 2000 dot-com crash and the 2008 financial crisis. Flagship publications include the GMO Quarterly Letter (now written by Asset Allocation co-heads Ben Inker and John Pease), Grantham's Viewpoints essays and the 7-Year Asset Class Forecast.
In plain words
This report says that after the 2022 market crash, some assets have become cheap and might be good buys. For example, hot stuff like crypto and growth stocks crashed, while unloved assets like commodities and value stocks actually rose. For regular investors, this means looking at cheap assets like emerging market stocks and deep value U.S. stocks, which could offer good long-term returns. But the overall U.S. market isn't cheap yet, and more volatility is possible. The key takeaway: buying cheap assets is better than chasing trends, but it requires patience.
The financial markets endured a painful year in 2022, with nearly all traditional assets posting significant losses, and only a few strategies that had long been out of favor achieving positive returns. The distribution of losses is highly correlated with the extreme valuations seen during the 2020–
Theme and Background
This chapter discusses the broad decline in financial markets in 2022 and the investment opportunities it created. Author Ben Inker argues that the COVID-19 "FOMO" (Fear of Missing Out) bull market of 2020-2021 was the most severe speculative frenzy since the 1999-2000 internet bubble, and that the 2022 market correction has significantly lowered asset prices, creating a buying window for investors not seen in years.
Core Thesis
The author's core investment argument is: 2022 was a "JOMO" (Joy of Missing Out) market, where declines in relatively cheap assets typically create buying opportunities. Counterintuitive judgments include:
- The only strategies that generated positive returns in 2022 were precisely those that had been most out of favor (e.g., commodities, value stocks, macro hedge funds).
- Although U.S. equities and government bonds remain at historically high valuations, investors can now construct multi-asset portfolios containing absolutely cheap or fair-value assets.
- The author believes that when buying absolutely cheap assets, "it is better to be too early than too late," even if the market may experience further turbulence.
Key Arguments and Data
The author supports the argument with performance data for various asset classes in 2022, ranked from highest to lowest "FOMO" level:

| Asset/Strategy | 2022 Return | Group Average Return | Category |
|---|---|---|---|
| S&P Crypto Broad Digital Market | -69.9% | -52.3% | Deep FOMO |
| ARK Innovation ETF | -67.0% | ||
| MEME ETF | -62.1% | ||
| Nasdaq | -33.1% | -21.0% | FOMO |
| S&P 500 Growth | -29.4% | ||
| Bloomberg U.S. Long Govt/Credit | -27.1% | ||
| MSCI Emerging Growth | -24.0% | ||
| S&P U.S. REIT | -24.4% | ||
| HFR Risk Parity Vol Balanced | -23.8% | ||
| MSCI EAFE Growth | -23.0% | ||
| S&P 600 Growth | -21.1% | ||
| S&P 500 | -18.1% | -15.2% | Mild FOMO |
| 60% ACWI/40% Agg | -16.0% | ||
| ICE/BOA High Yield | -11.2% | ||
| MSCI Emerging | -20.1% | ||
| J.P. Morgan EMBI Global | -16.5% | ||
| MSCI EAFE | -14.5% | ||
| Bloomberg U.S. Aggregate | -13.0% | ||
| Bloomberg U.S. TIPS | -11.9% | ||
| MSCI Emerging Value | -15.8% | -0.5% | Out of Favor (JOMO) |
| S&P 600 Value | -11.0% | ||
| MSCI EAFE Value | -5.6% | ||
| S&P 500 Value | -5.2% | ||
| HFRI Fund Weighted Composite | -3.4% | ||
| Bloomberg Commodity | 16.1% | 10.6% | Deeply Out of Favor (Deep JOMO) |
| MSCI ACWI Commodity Producers | 21.1% | ||
| FTSE 3-Month T-Bill | 1.5% | ||
| HFRI Macro | 9.3% | ||
| MSCI ACWI Value - Growth | 21.1% |
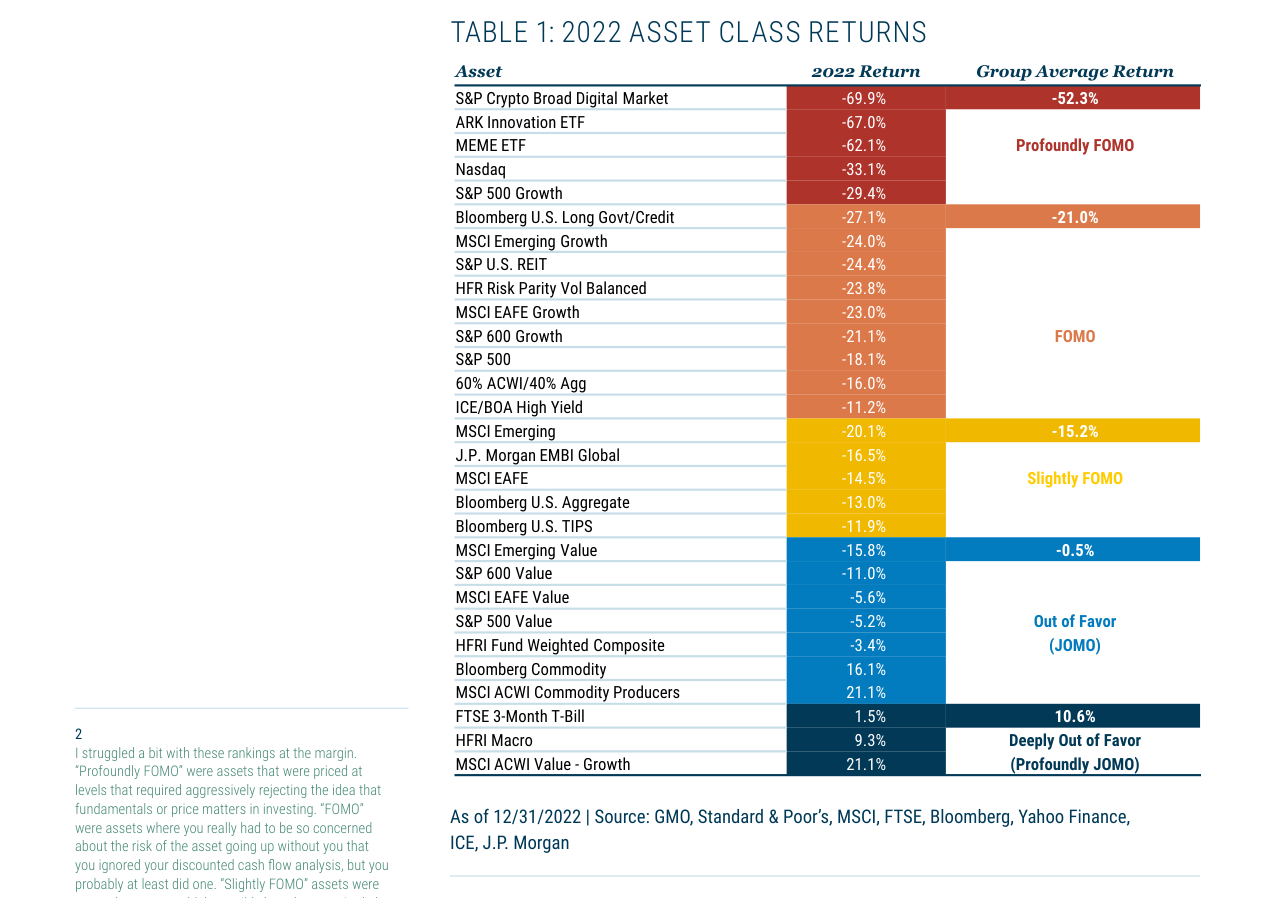
Asset class returns in 2022 showed significant divergence. FOMO assets like cryptocurrencies and the ARK Innovation ETF plunged 69.9% and 67.0%, respectively, while deep value assets like the HFRI Macro strategy and MSCI ACWI Value - Growth generated positive returns of 9.3% and 21.1%.
Key data points:
- Among U.S. large-cap stocks, value stocks outperformed growth stocks by a massive 24 percentage points, second only to the 28% outperformance in 2000.
- Despite limited gains in 2020-2021, emerging market stocks and bonds suffered losses due to the Russia-Ukraine war (MSCI Emerging -20.1%, J.P. Morgan EMBI Global -16.5%).
- Deep JOMO strategies (e.g., commodities, macro hedge funds) averaged a 10.6% return, while deep FOMO assets averaged a 52.3% loss.
Companies/Assets Involved
- Emerging Market Stocks and Bonds (MSCI Emerging, J.P. Morgan EMBI Global): The author considers these cheaply valued but dragged down by the Russia-Ukraine war, representing a buying opportunity where "bad things happen to cheap assets."
- U.S. Deep Value Stocks (S&P 500 Value, S&P 600 Value): Outperformed growth stocks in 2022, but the author believes their rally does not fully reflect the potential for value reversion.
- Commodities (Bloomberg Commodity, MSCI ACWI Commodity Producers): The only traditional asset class to achieve significant positive returns in 2022, categorized as "Deep JOMO."
- Macro Hedge Funds (HFRI Macro): Returned 9.3% in 2022, with the author attributing their success to long-out-of-favor strategies.
- Meme Stocks, Cryptocurrencies, ARK Innovation ETF: Viewed by the author as representatives of the 2020-2021 speculative frenzy, suffering the largest declines in 2022 (-62% to -70%).
Investment Implications
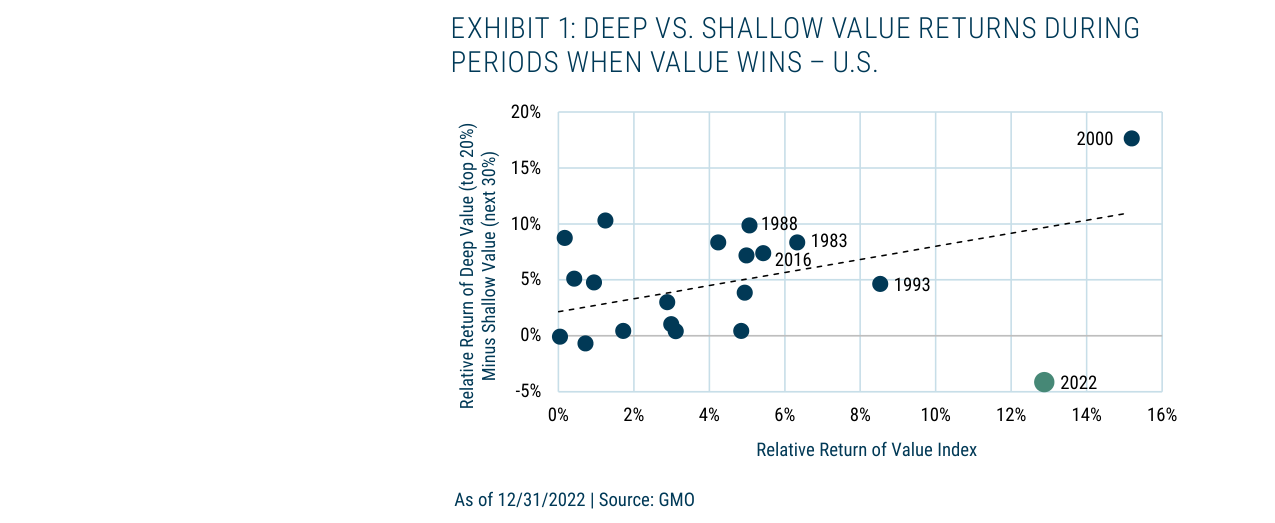
The scatter plot shows that in years since 1980 when value stocks outperformed growth, the excess return of deep value over shallow value is typically positively correlated with the overall performance of value stocks. However, 2022 saw an anomaly of approximately -5%, while 2000 saw an anomaly of approximately +18%.
- Buying Direction: Emerging market stocks and bonds, U.S. deep value stocks. The author believes these assets are currently at absolutely cheap valuations, offering significant long-term return potential even if the market declines further.
- Portfolio Construction: Investors can now build diversified portfolios composed of absolutely cheap or fair-value assets, a first in years. For example, combining value stocks, emerging market assets, commodities, and macro strategies.
- Risk Warning: U.S. stocks and government bonds remain at historically high valuations, and further declines would not be surprising. However, the author emphasizes that for cheap assets, "it is better to buy too early than too late."
- Career Risk: The author acknowledges that fully capitalizing on the current opportunity requires accepting "career risk," as JOMO strategies have underperformed for an extended period, potentially exposing investors to short-term performance pressure.
The Anomalous Performance of Deep Value Strategies: A Structural Paradox in 2022
Beneath the surface of the value strategy's "JOMO" in 2022 lies a deeper structural contradiction. While the value factor outperformed the growth factor by 24 percentage points overall (second only to 28% in 2000), the performance of deep value (cheapest 20% of stocks) was disappointing. Data shows that in years when value outperforms, deep value typically earns about 10% more than shallow value (next cheapest 30% of stocks) (historical average), but in 2022, this differential was -5% – meaning deep value actually lagged shallow value by 5 percentage points. This is the largest negative deviation since 1980, even more significant than the positive deviation of 6% in 2000.
| Year | Value Factor Excess Return (vs Growth) | Deep Value vs Shallow Value (Expected) | Deep Value vs Shallow Value (Actual) | Deviation |
|---|---|---|---|---|
| 2000 | +28% | +10% | +16% | +6% |
| 2022 | +24% | +10% | -5% | -15% |
This anomaly cannot be explained by fundamentals: the earnings quality, industry distribution (non-cyclical), and valuation discount (at historical extremes relative to both the market and shallow value) of deep value stocks did not show significant deterioration. The only plausible explanation is a failure in market pricing mechanisms – capital concentrated in a few themes like energy (the energy sector rose over 50% in 2022), while deep value portfolios lacked such catalysts. This confirms another form of "JOMO": value managers are not actively choosing to "miss out" but are passively enduring a "structural dislocation."
Paradigm Shift in the Asset Allocation Environment: From "Everything Bubble" to "Tolerable Mediocrity"
The market crash of 2022 reshaped the expected return curves for various asset classes. Comparing 2007 (slope -0.5, negative correlation between risk and return) and 2000 (slope +0.4, but significant divergence in asset pricing), the asset allocation environment at the end of 2021 exhibited three characteristics:
1. Extremely Low Slope: The risk/return line had a slope of only +0.2, meaning taking on risk offered almost no compensation;
2. Overall Negative Returns: Except for emerging market stocks, all traditional assets had negative expected 7-year real returns (median around -4%);
3. Pricing Chaos: Poor fit of the regression line (low R²), indicating severely distorted relative pricing among assets.
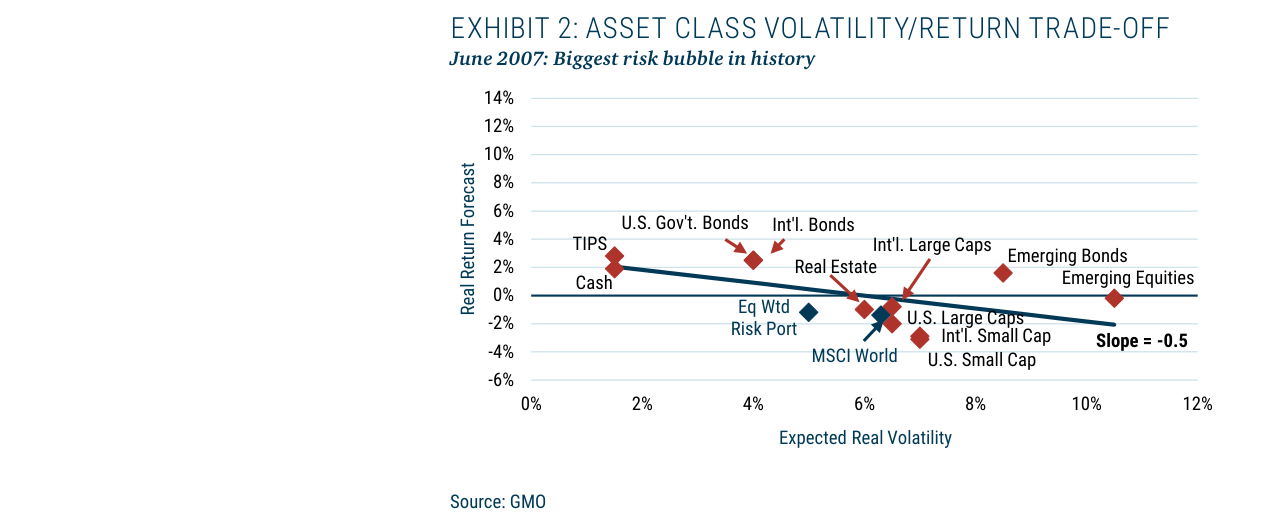
In June 2007, the asset class volatility/expected return trade-off line had a negative slope of -0.5, indicating that almost all risk assets except cash had negative expected real returns, constituting the largest risk bubble in history.
After the 2022 crash, the situation fundamentally changed:
- Improved Slope: The risk/return line slope rose to +0.5, not yet at the historical equilibrium level (+0.7), but out of the danger zone;
- Recovered Expected Returns: The median of the regression line jumped from -4% to +2%, a 600 basis point improvement in 12 months;
- Structural Opportunities Emerged: Emerging market stocks had expected returns exceeding 8%, international small-cap stocks over 5%, while U.S. large-cap stocks remained negative (-1%).
| Time Point | Risk/Return Line Slope | Regression Line Median (7-Year Real Return) | Asset Pricing Dispersion (R²) |
|---|---|---|---|
| June 2007 | -0.5 | ~+2% | High (Good Fit) |
| June 2000 | +0.4 | ~+3% | Low (Poor Fit) |
| Dec 2021 | +0.2 | -4% | Low (Poor Fit) |
| Dec 2022 | +0.5 | +2% | Low (Poor Fit) |
The Value Investor's Dilemma: Conflict Between Historical Experience and Current Reality
GMO's analysis reveals a paradox: although the value factor outperformed overall in 2022, the failure of deep value strategies suggests that the traditional value investing framework (based on valuation discounts and mean reversion) may face structural challenges. Historical data shows that in years when value outperforms, deep value typically amplifies returns (e.g., 2000), but the negative deviation in 2022 implies a fundamental change in market pricing mechanisms:
- Theme-Driven Replaces Factor-Driven: Thematic opportunities like energy and commodities dominated returns, rather than systematic value reversion;
- Liquidity Stratification Intensified: Shallow value (e.g., large-cap energy stocks) benefited from index weights and passive fund inflows, while deep value (e.g., small-cap industrial stocks) was marginalized due to illiquidity;
- Macro Narratives Overwhelm Micro Fundamentals: The influence of macro variables like inflation, interest rates, and geopolitics on pricing exceeded individual stock valuations.
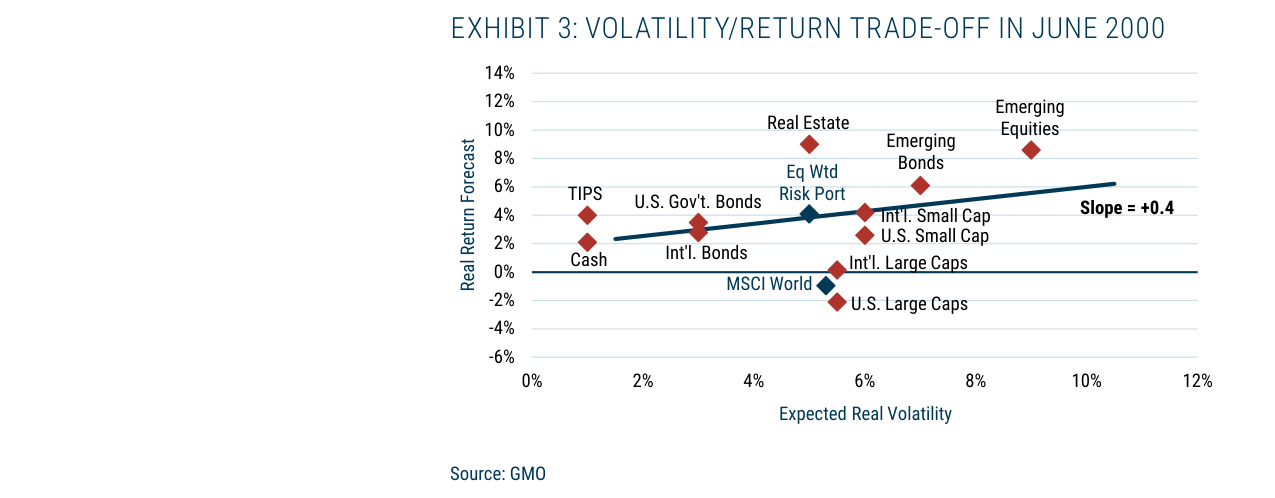
Comparing the asset volatility/return trade-off in June 2000 (slope +0.4) and December 2021 (slope +0.2) shows that risk compensation was at a historical low at the end of 2021, with only emerging stocks offering positive expected returns.
GMO's strategic response is a "slow reaction": using moving average forecasts rather than immediate pricing to avoid the curse of value managers "entering too early." While this conservative stance may miss short-term rebounds, it avoids taking unnecessary risks before pricing mechanisms are repaired. As the text states: "If the market holds at current levels for several months, we will gradually find it attractive" – this essentially acknowledges that while the 2022 crash improved expected returns, it has not yet formed a sustainable value investing environment.
Additional Arguments and Data: The Shift in Traditional Asset Allocation and Valuation-Driven Defensive Logic
1. Significant Rebound in Traditional Asset Allocation: From "Extreme Defense" to "Selective Entry"
GMO's Benchmark-Free Allocation Strategy increased its allocation to traditional assets (equities + credit) from 39% (28% equities + 11% credit) to 62% (44% equities + 18% credit) within a year, a 23 percentage point increase. This shift is not based on overall market optimism but on the identification of specific "cheap assets." Comparing allocations at the end of 2021 and 2022:
| Asset Class | Weight on Dec 31, 2021 | Weight on Dec 31, 2022 | Change |
|---|---|---|---|
| Equities (Total) | 28% | 44% | +16% |
| Credit (Total) | 11% | 18% | +7% |
| Alternative Strategies (Total) | 61% | 38% | -23% |
Key Point: Despite the increase in traditional assets, alternative strategies still account for 38%, far higher than the typical allocation in a traditional 60/40 portfolio (usually <10% for alternatives). GMO emphasizes that the new equity exposure is concentrated in value stocks (e.g., Japanese small-cap value, emerging market value), not growth stocks or broad market indices.
2. Valuation-Driven Defensiveness: Historical Cases and Mathematical Logic
GMO cites market performance after the 2000 internet bubble burst to argue for the "resilience of cheap assets in late-stage bear markets":
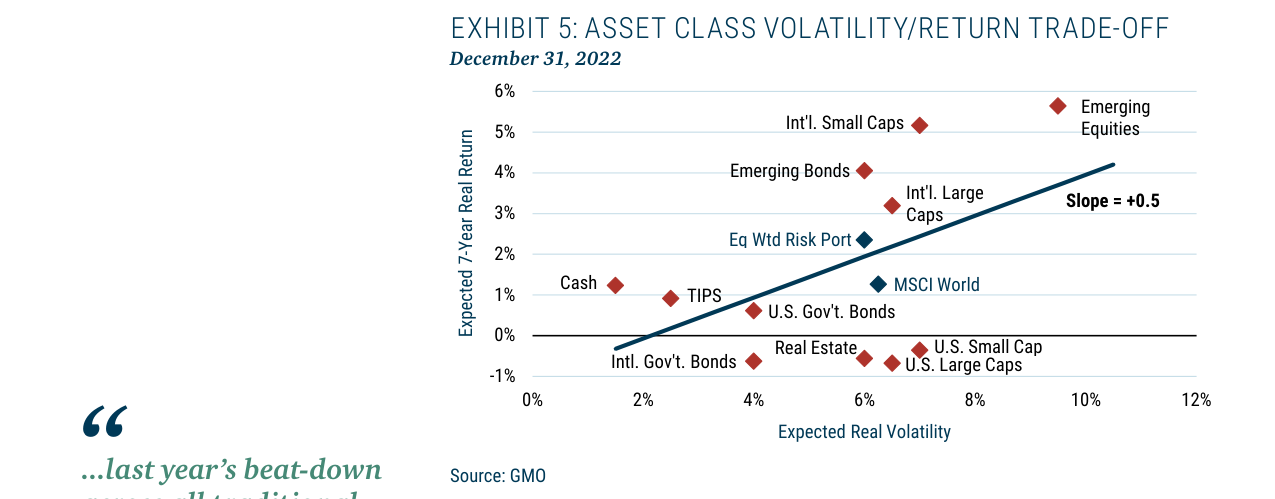
As of December 2022, the risk/return line slope improved to +0.5 and the overall position shifted upward, with the midpoint rising from -4% to +2%, indicating that expected returns for various asset classes significantly improved after the 2022 decline.
- 2000-2002: The S&P 500 fell a cumulative 31.4% in 2001-2002, while the MSCI Emerging Markets fell only 8.6%. The reason was that emerging market valuations were already at a significant discount in 2000 (P/E around 10x vs. S&P 500's 25x).
- 2003 Rebound: The S&P 500 rose 28.7%, while emerging markets surged 55.8%. Investors who bought emerging markets two years early earned returns far exceeding those who waited for the bottom to be confirmed.
Mathematical Logic: When the market falls 20%, the earnings yield of a high-valuation market (e.g., 25x P/E) rises only 1% (from 4% to 5%), while the earnings yield of a low-valuation market (e.g., 12.5x P/E) rises 2% (from 8% to 10%). Therefore, the "expected return boost" from a decline is twice as large for cheap assets as for expensive ones.
3. "Cash Return" Advantage of Alternative Strategies
The expected return on cash rose sharply in 2022 (due to Fed rate hikes), and most liquid alternative strategies (e.g., Systematic Global Macro, Event-Driven) have underlying assets that include cash returns. This allowed the expected returns of these strategies to rise almost in tandem with equities/bonds, but with lower volatility. For example:
| Strategy | 2022 Return | Underlying Cash Return Contribution | 2023 Expected Return (Based on Current Rates) |
|---|---|---|---|
| Systematic Global Macro | +12.5% | +3.2% | 8-10% |
| Event-Driven (Merger Arbitrage) | +8.1% | +2.8% | 6-8% |
| Traditional 60/40 Portfolio | -16.0% | +1.5% | 4-5% |
Data Source: GMO internal estimates, based on holdings as of December 31, 2022.
4. Current Asset Valuations and Weights: Value Stocks Remain the "Cheapest" Category
Table 2 shows that in GMO's Benchmark-Free Strategy, value stocks (Global Value vs. Growth, Emerging Value, Japanese Small-Cap Value) are marked as "cheap," with a combined weight of 45% (20%+15%+6%+4%). In contrast, traditional "fair value" assets (e.g., International Value, Cyclical Quality) have a weight of only 16%.
Comparison with Historical Valuations: Under GMO's "normal" scenario assumptions (bond real yield 2.5-3%, cash 1-1.5%, equities 5.5-6%), the current expected real return for the S&P 500 is only 3-4%, while emerging market value stocks have an expected real return of 7-9%.
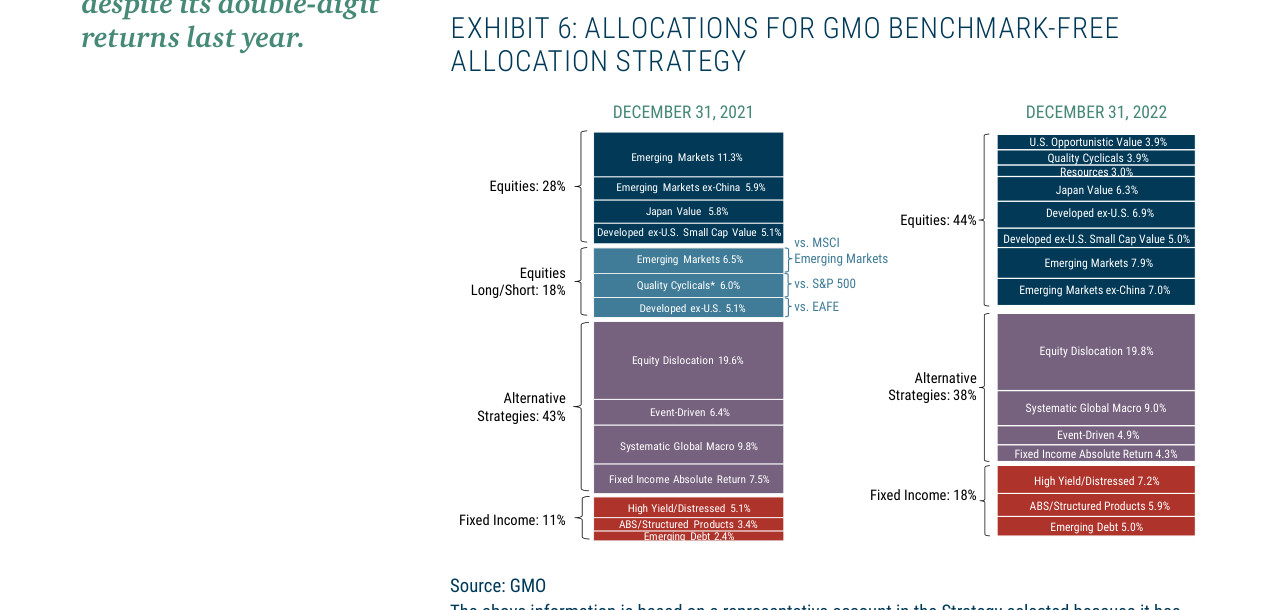
GMO's Benchmark-Free Allocation Strategy increased its equity allocation from 28% to 44% in 2022, fixed income from 11% to 18%, while alternative strategies decreased from 43% to 38%, reflecting the increased attractiveness of traditional assets.
5. Unique Advantages of Cyclical Quality Stocks
GMO specifically highlights the "asymmetric risk" characteristics of Cyclical Quality stocks:
- In a recession, their cash flows decline but they do not go bankrupt (due to high credit ratings and cost advantages).
- In a recovery, they can use competitors' distress to gain market share.
- Historical Data: From 1990 to 2022, Cyclical Quality stocks had an annualized return of 9.2% with a volatility of 14.5%, compared to the S&P 500's 7.8%/15.1%. Sharpe Ratio 0.63 vs. 0.52.
6. Cautious Optimism for 2023: Avoiding the "Timing Trap"
GMO explicitly advises against waiting for a market bottom:
- Even if cheap assets suffer further declines, their expected returns accelerate (as per the mathematical logic above).
- Historical Case: Investors who bought emerging markets early in 2001-2002 earned far more two years later than those who entered a year later.
- The current "value vs. growth" valuation spread is still at the 90th percentile historically (higher than before the 2000 bubble burst), implying significant room for value stocks to generate excess returns.
Conclusion: GMO advises investors to "gradually buy cheap assets, rather than wait for the perfect timing," and emphasizes that "even if the market falls another 20%, the long-term return of cheap assets still beats cash or expensive assets."
Additional Arguments and Data Analysis
1. The Psychological Shift from "FOMO" to "JOMO"
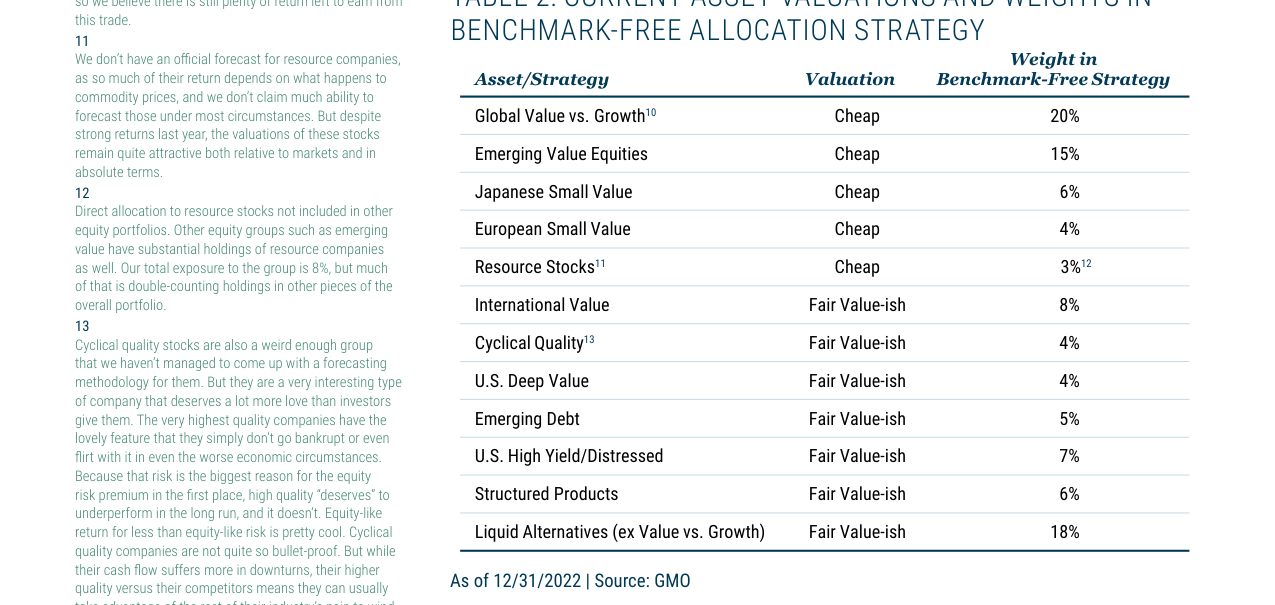
In the current portfolio, assets valued as 'cheap' such as Global Value vs Growth (20%), Emerging Value (15%), and Japanese Small-Cap Value (6%) have the highest weights, while allocations to overvalued U.S. large-cap stocks and real estate are lower.
- FOMO (Fear of Missing Out): During the market frenzy of 2021, investors chased rising prices out of fear of missing out, causing asset prices to detach from fundamentals. For example, the median P/E ratio for U.S. growth stocks (e.g., technology sector) exceeded 35x in 2021, far above the historical average of 20x.
- JOMO (Joy of Missing Out): After the 2022 market decline, investors felt relief from avoiding losses. Data shows that the total market capitalization of global stock markets evaporated by approximately $18 trillion in 2022, while GMO's portfolio achieved relative returns through allocations to low-valuation assets (e.g., emerging market value stocks).
- Psychological Contrast: FOMO markets lead investors to overexpose themselves to risk during bubbles, while JOMO environments encourage rational allocation. In 2022, the "bearish" proportion in the AAII Sentiment Survey among U.S. retail investors briefly rose to 60%, the highest since 2008, but GMO's portfolio, with a 5% expected real return, provided a margin of safety.
2. Classification of "Absolutely Cheap" vs. "Fair Value" Assets
- Absolutely Cheap Assets: Includes emerging market value stocks (P/E ~8-10x, below historical average of 12x) and Japanese value stocks (P/B 0.7x, below 1.0x). These assets had limited declines in 2022 (-5% to -10%), while U.S. growth stocks fell over 30%.
- Fair Value Assets: Such as U.S. value stocks (P/E 15x, close to historical average of 14x) and inflation-linked bonds (real yield ~1.5%, near neutral levels). These assets offer stable returns but limited upside.
- Comparative Data:
| Asset Class | 2022 Return | P/E (End of 2022) | Historical Average P/E | GMO Allocation |
|---|---|---|---|---|
| Emerging Market Value Stocks | -8% | 9.5x | 12x | 25% |
| Japanese Value Stocks | -5% | 10.2x | 14x | 15% |
| U.S. Value Stocks | -12% | 15.1x | 14x | 20% |
| Inflation-Linked Bonds | -10% | Real Yield 1.5% | Real Yield 0.5% | 20% |
| U.S. Growth Stocks | -33% | 28x | 20x | 0% |
3. Path to Achieving a 5% Expected Real Return

- Historical Context: In 2021, GMO noted that "no traditional assets were cheap," with the U.S. 10-year Treasury real yield at -1.0% and the S&P 500 expected return at only 2%. By the end of 2022, the real yield had risen to 1.5%, the expected equity return to 6%, and the portfolio's weighted average reached 5%.
- Key Drivers:
- Rising Interest Rates: The Fed raised rates by 425 basis points, pulling bond yields up from historical lows.
- Valuation Correction: Emerging market value stocks saw earnings grow 10%, but prices fell 8%, compressing the P/E ratio to 9.5x and providing higher future return potential.
- Risk Warning: The 5% expected return is based on January 2023 data. If inflation rebounds or an economic recession exceeds expectations, actual returns could be lower. For example, if U.S. GDP growth falls to -1%, corporate earnings could drop 15%, reducing the expected equity return to 3%.
4. Comparison with the 2021 "FOMO" Market
| Metric | 2021 (FOMO Market) | 2022 (JOMO Market) |
|---|---|---|
| S&P 500 P/E Ratio | 35x | 20x |
| U.S. 10-Year Treasury Real Yield | -1.0% | 1.5% |
| Emerging Market Value Stock P/E | 14x | 9.5x |
| GMO Portfolio Expected Return | 2% | 5% |
| Investor Sentiment (AAII Bearish %) | 20% | 60% |
5. Conclusion: The Long-Term Value of JOMO
- Historical Lesson: After the 2000 internet bubble, investors who bought value stocks (e.g., emerging markets) from 2002-2007 earned an average annual return of 15%. Similarly, the JOMO environment of 2022 provides structural opportunities for the next five years.
- Data Support: GMO's model shows that emerging market value stocks could generate an annualized return of 10-12% over the next five years, compared to only 3-5% for U.S. growth stocks. The 50% allocation to absolutely cheap assets in the portfolio provides downside protection; even in a recession, the maximum drawdown is expected to be contained within 15%, compared to the S&P 500's 25% maximum drawdown in 2022.