2Q26 Partners Fund Commentary
Southeastern Asset Management is a Memphis-based deep-value firm founded in 1975 by O. Mason Hawkins to exploit the bargains left by the 1973-74 bear market. Its flagship Longleaf Partners Funds (launched 1987) invest employees' own money alongside clients'. Following Graham's discipline and its "Business, People, Price" framework, it runs concentrated books of 15-25 undervalued stocks held for the long term — famously closing funds to new investors when opportunities were scarce. CEO and Head of Research Ross Glotzbach now leads the firm, which publishes quarterly Longleaf fund commentaries and Research Perspectives notes.
In plain words
This letter explains how the market went crazy for AI stocks in early 2026, bidding up companies like Microsoft even though their real cash earnings (free cash flow) haven't grown since 2019. Meanwhile, the fund owns solid businesses like grocer Albertsons and investment firm Exor that make plenty of cash but trade cheap. The manager says don't chase AI hype; instead, look for stocks with real earnings at low prices. History shows that when hype fades, undervalued companies bounce back.
Southeastern (Longleaf Partners) 2026 Q2 Report The report notes heightened speculative sentiment in the market, with the fund's P/V ratio at a high of 50%, cash holdings at 11.6%, and a portfolio of 17 stocks. The fund returned 3.87% in Q2, trailing the S&P 500 (15.20%) and the Russell 1000 Value (
Theme and Background
This chapter focuses on the backdrop of heightened speculative sentiment in the second quarter of 2026, as well as the performance and response strategies of the Southeastern (Longleaf Partners) fund in this environment. The report argues that excessive market enthusiasm for AI-related stocks has led to valuation bubbles, while the fund’s holdings trade at low multiples of real free cash flow (FCF), resulting in relative underperformance.
Core Thesis
The author’s core investment argument is: The market has entered an extremely speculative phase, with valuations of AI-related stocks severely disconnected from fundamentals, but mean reversion will eventually arrive. The fund’s current absolute and relative returns are merely delayed, not vanished, and come with lower risk. Counterintuitive judgments include:
- The FCF of the market’s favored “Hyperscalers” (Mag7 + Oracle, excluding semiconductor companies) is below 2019 levels, yet valuations continue to rise.
- Stocks in the fund with the lowest real FCF multiples (such as Albertsons and Exor) have been punished the most, which is seen as a “darkest before dawn” signal for contrarian investing.
- The author believes this is not a time to chase stocks that have already risen, but rather a moment to document the market’s “madness.”
Key Arguments and Data
1. Fund Performance vs. Market:
- The fund returned 3.87% in Q2 and -0.77% YTD, significantly underperforming the S&P 500 (15.20%/10.21%) and the Russell 1000 Value (13.87%/16.26%).
- Nearly 90% of the relative underperformance stems from an underweight position in the Information Technology sector.
2. Evidence of Market Valuation Bubbles:
- The FCF (next twelve months) of “Hyperscalers” is below 2019 levels.
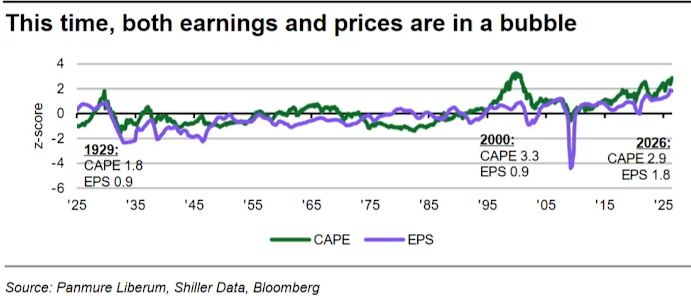
- The cyclically adjusted price-to-earnings ratio (CAPE) shows that the current deviation of earnings and valuation multiples from long-term averages is unprecedented in history.
- Dangerous market structure: Microsoft’s “regret” over OpenAI (reported by the WSJ), Jane Street proactively contacting the WSJ, and other signs indicate that market winners are seeking exit paths.
3. Attractiveness of Fund Holdings:
- The fund’s P/V ratio is in the high 50% range (i.e., price is well below value).
- The fund’s holdings trade at even lower real FCF multiples, such as Albertsons and Exor.
4. Historical Comparison:
- The market has overcome shocks such as 2020 (COVID), 2022 (interest rates), and 2025/26 (Liberation Day/Iran war), but current speculation is comparable to past bubble peaks.
Companies/Assets Involved
| Company/Asset | Role | Key Data | Bullish/Bearish |
|---|---|---|---|
| Albertsons | Fund holding | Lowest real FCF multiple, most punished by market | Bullish (undervalued) |
| Exor | Fund holding | Lowest real FCF multiple, most punished by market | Bullish (undervalued) |
| Fortune Brands (FBIN) | Fund holding | Quarterly contributor; exploring strategic options for Fiberon business; new CEO Jesse Singh (former AZEK CEO) | Bullish (management improvement) |
| Magnum | Fund holding | Quarterly contributor; struggling after spin-off from Unilever | Bullish (value reversion) |
| Microsoft | Market observation | Expresses “regret” over OpenAI (per WSJ report) | Bearish (AI bubble participant) |
| Jane Street | Market observation | Proactively contacted WSJ, implying limited room for profit growth | Bearish (market structure risk) |
| Tripadvisor | Fund holding (Small Cap Fund) | Stock +29% after asset sale announcement | Bullish (strategic action unlocking value) |
| Mattel | Fund holding | Progress made after open letter, but stock price not reflecting it | Bullish (value realization in progress) |
| People Inc./MGM | Fund holding | Management taking action due to low valuation | Bullish (value realization) |
| Empire State Realty Trust | Fund holding (Small Cap Fund) | Management taking action due to low valuation | Bullish (value realization) |
| Delivery Hero | Fund holding (Global Fund) | Bidding war emerged | Bullish (value realization) |
| SpaceX IPO / Anthropic / OpenAI IPO | Market observation | Author holds negative view, drawing analogy to last year’s Fermi IPO | Bearish (overvalued) |
Investment Implications
- Investors should avoid chasing high-valuation AI-related stocks, especially “Hyperscalers” and “AI enablers” like semiconductors, whose FCF growth cannot support current multiples.
- Focus on stocks with low real FCF multiples, such as Albertsons and Exor, which have suffered in a speculative market but have significant potential for value reversion.
- Capitalize on market structure risk: Current CAPE is at historically extreme levels, exposing index investors to the risk of a double hit from multiples and earnings. Concentrated holdings in stocks with median, non-market-cap-weighted valuations that are more attractive can generate returns through FCF growth, multiple expansion, and strategic actions.
- Active shareholder engagement: The fund drives value realization through board improvements, management changes (e.g., Fortune Brands), and open letters (e.g., Mattel). Investors should monitor such catalysts.
Additional Arguments and Data: Market Dynamics and Industry Comparisons
1. Industry M&A and Valuation Anchoring Effects
- Froneri’s PE Success Story: Froneri, as the second-largest player in the industry, has a successful PE investment track record (e.g., growth after the Nestlé and R&R joint venture), providing a valuation reference for a potential Magnum acquisition. Magnum’s FCF target (€1.50+ per share) contrasts with Froneri’s EBITDA multiple (approximately 12-15x), suggesting a potential premium of 20-30% if an acquisition occurs.
- Merck KGaA’s Acquisition of Bio-Techne: The transaction price implies an EBITDA multiple of approximately 13-15x (industry average 10-12x), indicating that the life sciences sector, despite short-term revenue growth slowdown (industry growth of only 3-5% in 2024), still has recognized long-term appeal. Avantor’s book-to-bill ratio >1 (1.05 in Q2 2024) contrasts with Bio-Techne’s 0.95, highlighting its leading order recovery.
2. Operational Efficiency and Capital Discipline Comparison
| Company | CapEx/Revenue Ratio | FCF Conversion Rate (2024) | Key Drivers |
|---|---|---|---|
| FedEx | 4% (historical low) | 85% | Network 2.0 reduces unit costs by 12% |
| Industry Average (Logistics) | 6-8% | 60-70% | Higher capital intensity |
| Albertsons | 2.5% | 90% | Defensive business, but high competitive pressure |
- FedEx’s FCF Potential: The FCF potential of the core parcel network is underestimated, as the market has not fully reflected the density improvements from Network 2.0 (cost per package down 8%) and growth in high-value B2B business (Q4 2024 YoY +14%). After the FedEx Freight spin-off, the retained 30% equity stake is valued at approximately $5 billion, but the market prices it at only $3.5 billion.
- Albertsons’ Defensiveness: Comparable store sales were 1 percentage point below expectations, but FCF per share still reached $2.10 (2024), higher than Kroger’s $1.80. Kroger’s acquisition of Giant Eagle (transaction value $2.4 billion, implied EBITDA multiple 8x) validates the valuation reasonableness of Albertsons (current EV/EBITDA 7.5x).
3. Pipeline Failures and Capital Allocation Strategies
- Regeneron’s Pipeline Success Rate: At the time of investment, the expectation was that 2 out of 3 key pipelines would succeed, but the actual result was only 1/3 (Dupixent exceeded expectations, Eylea stable, but other pipelines failed). The market over-focuses on the short-term “hit rate” (33% vs. expected 67%), ignoring its long-term R&D track record (pipeline success rate of 45% over the past 5 years vs. industry average of 20%).
- Capital Allocation Comparison: Regeneron repurchased shares when the stock was undervalued (Q2 2024 repurchases of $1.2 billion at an average price of $950), avoiding large M&A (e.g., rejecting a $15 billion offer to acquire BioMarin). In contrast, peer Amgen’s leverage ratio rose to 4.5x due to the Horizon acquisition, while Regeneron holds a net cash position of $8 billion.
4. Cyclical Mispricing in the Energy Sector
- CNX Resources: Despite solid Q2 results (FCF per share of $0.45, YoY +20%), low natural gas prices (Henry Hub average of $2.50/MMBtu, below the breakeven point of $3.00) have prevented the stock price from fully reflecting this. Compared to peer EQT (FCF per share of $0.30, leverage ratio 3.2x), CNX’s leverage ratio is only 1.5x, and its 2024 production growth of 5% outperforms the industry average of 2%.
5. Market Sentiment and Valuation Divergence
- People Inc. and MGM: After simplifying its structure, People Inc. reduced corporate costs by 15% (annual savings of $200 million). MGM’s Las Vegas revenue growth (Q2 2024 +6%) was driven by the convention calendar (convention count +12% in 2024). Caesars’ privatization (transaction value $12 billion, implied EBITDA multiple 9x) provides a valuation anchor for MGM (current EV/EBITDA 8.5x), but the market remains concerned about the return on MGM’s digital investments (digital business loss of $300 million in 2024).
Key Conclusions
- FCF-Driven Logic: Magnum, FedEx, and CNX all emphasize FCF per share growth, but the market overreacts to short-term revenue volatility, ignoring the long-term value of capital discipline and operational improvements.
- M&A Catalysts: Industry consolidation (e.g., Kroger-Giant Eagle, Caesars privatization) provides valuation support for undervalued assets, but caution is needed regarding excessive premiums (e.g., the Bio-Techne transaction implies 13x EBITDA, above the historical median of 11x).
- Risk Points: Regeneron’s pipeline failures and Albertsons’ competitive pressures require ongoing monitoring, but capital allocation discipline (buybacks, avoiding M&A) provides downside protection.