3Q23 Asia Pacific Commentary
Southeastern Asset Management is a Memphis-based deep-value firm founded in 1975 by O. Mason Hawkins to exploit the bargains left by the 1973-74 bear market. Its flagship Longleaf Partners Funds (launched 1987) invest employees' own money alongside clients'. Following Graham's discipline and its "Business, People, Price" framework, it runs concentrated books of 15-25 undervalued stocks held for the long term — famously closing funds to new investors when opportunities were scarce. CEO and Head of Research Ross Glotzbach now leads the firm, which publishes quarterly Longleaf fund commentaries and Research Perspectives notes.
In plain words
This report from an investment firm looks at Asia-Pacific markets in Q3 2023, focusing on China. It argues that investors are too pessimistic—many Chinese companies like Alibaba, Tencent, and Macau casino MGM China are already growing revenues above 2019 levels, yet their stocks are deeply discounted. For ordinary investors, this suggests a potential opportunity to buy quality assets at bargain prices. Worth reading because it backs up its case with hard data, not just opinions.
Southeastern (Longleaf Partners) Asia Pacific UCITS Fund returned 0.69% in the third quarter of 2023, outperforming the FTSE Asia Pacific Index by nearly 3% (relative return of +2.93%), primarily driven by the NYSE listing of SharkNinja, a subsidiary of JS Global held in the Hong Kong/China portfoli
Theme and Background
This section discusses the investment environment in the Asia-Pacific market for the third quarter of 2023, focusing on the context of the continued weakness in China's capital markets and the intensifying crisis in the real estate sector, as well as how funds seek investment opportunities amidst this pessimism. The report notes that Western media portray China as being in a state of "collapse," but the author, through field research and macroeconomic data, believes the market is overly pessimistic.
Core Thesis
The author's core investment argument is: Pessimism towards the Chinese market is excessively amplified; the actual economic recovery trend is ongoing, and current valuations present contrarian investment opportunities. Counter-intuitive judgments include:
- The Chinese real estate crisis is not a systemic risk. By positioning in low-leverage CK Asset (CKA), the fund can instead capitalize on industry distress to acquire distressed assets.
- Revenue growth for Chinese internet and consumer companies (e.g., Alibaba, Tencent, Tongcheng Travel) is robust, starkly contrasting with the negative macro narrative.
- The recovery in Macau's gaming and tourism sectors has far exceeded market expectations, with MGM China's EBITDA already surpassing 2019 levels.
Key Arguments and Data
The author supports their views with extensive specific data, primarily categorized into three types:
1. Macro and Industry Data (Refuting Excessive Pessimism)
- New home sales in China are down 40-50% compared to 2019, but the real estate developer index has fallen below its October 2022 low, indicating the market has fully priced in the risks.
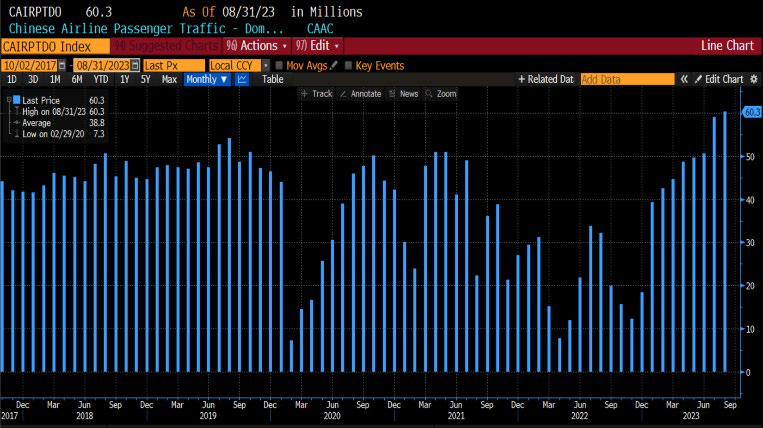
- Domestic air passenger traffic during the National Day Golden Week recovered to 115% of 2019 levels, while international flight operations recovered to 91%.
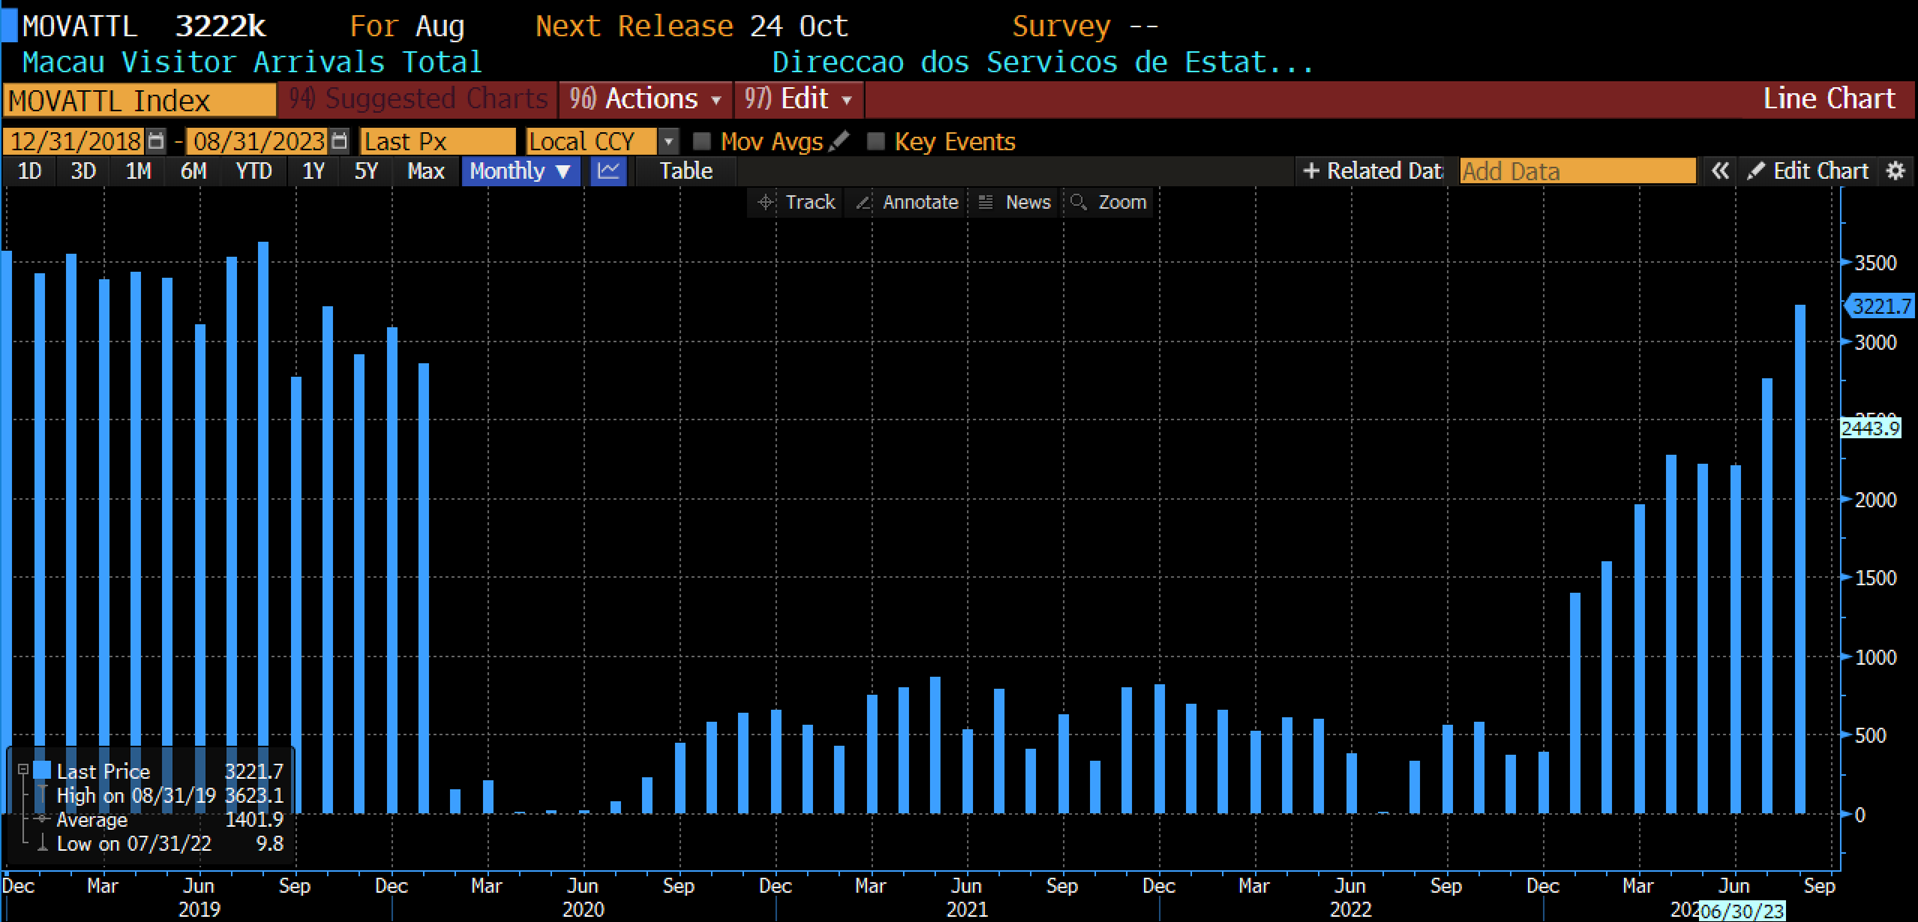
- Average daily visitor arrivals in Macau during the October Golden Week recovered to 89% of 2019 levels, with hotel occupancy reaching 88%.
- Per capita tourism spending during the National Day holiday recovered to 98% of 2019 levels (compared to only 85% during the Labor Day holiday).
2. Company-Level Data (Validating the Recovery)
| Company | Key Data | Period |
|---|---|---|
| Alibaba | Revenue YoY growth of 14% | June quarter 2023 |
| Baidu | Revenue YoY growth of 15% | June quarter 2023 |
| Tencent | Revenue YoY growth of 11% | June quarter 2023 |
| Tongcheng Travel | Domestic air ticket volume +40% vs Q2 2019; Domestic room nights +130% vs Q2 2019 | Q2 2023 |
| Samsonite | China revenue: Q1 -10% vs 2019, Q2 turned positive +10%, July +18% | 2023 |
| MGM China | Adjusted EBITDA 20% higher than Q2 2019; Golden Week GGR 50% better than May holiday, 80% better than same period 2019 | Q2 2023 & October |
3. Valuation and Margin of Safety Data
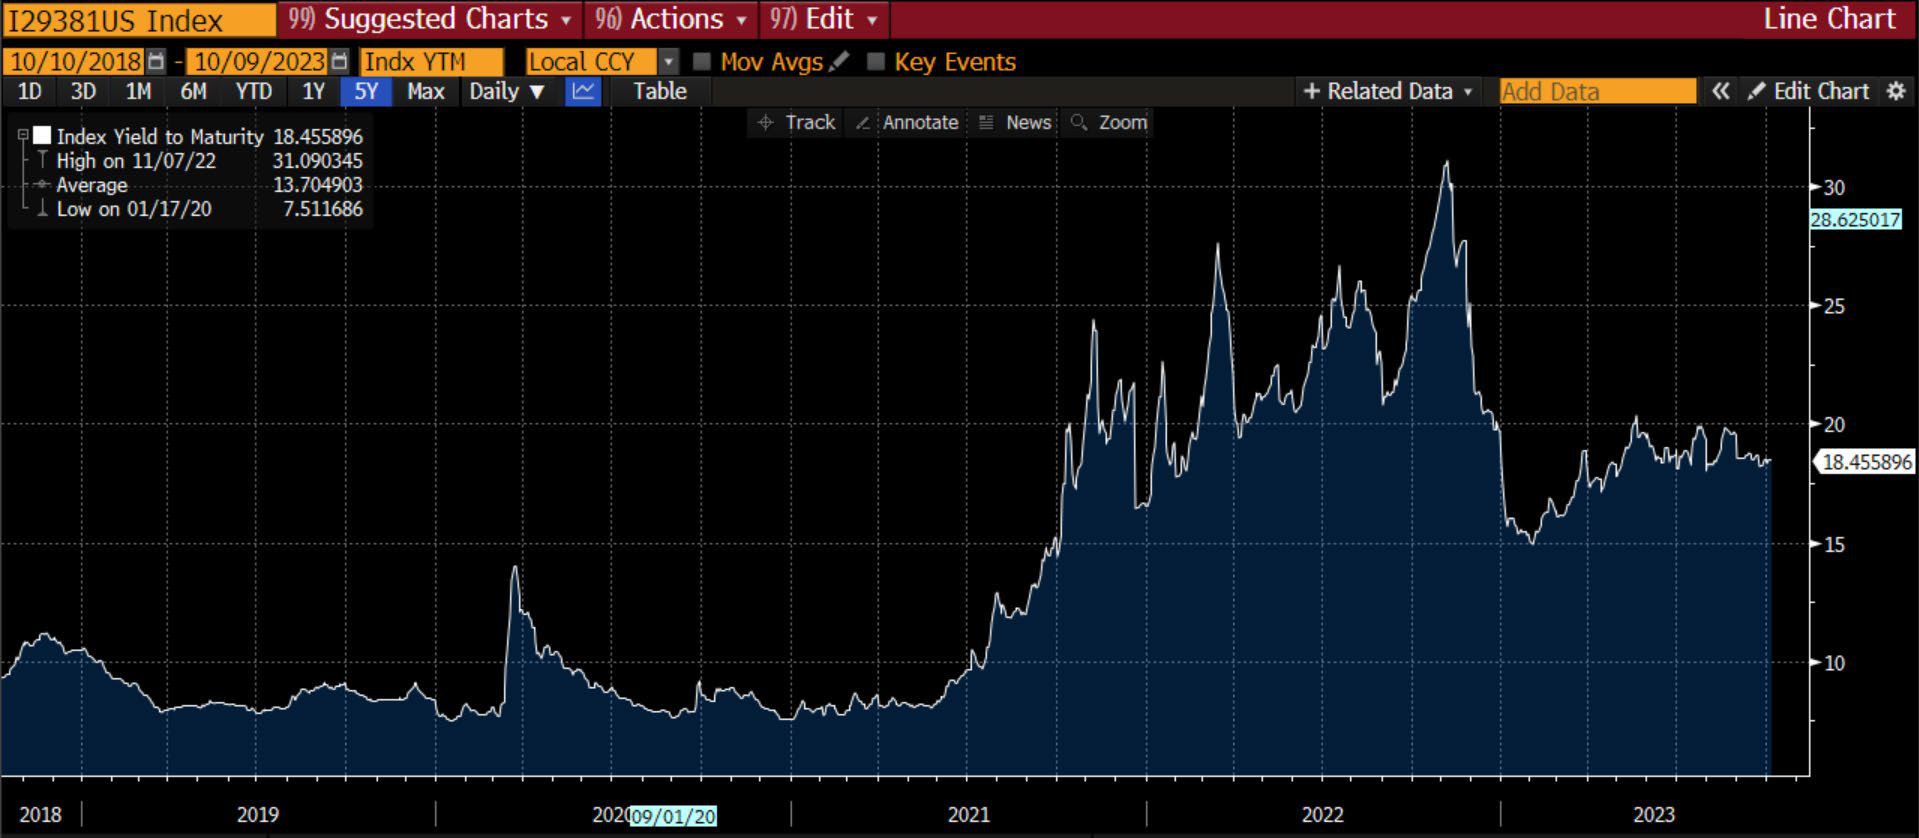
- China MeiDong Auto's 14.8% yield-to-maturity implies a credit spread of 1000 basis points, reflecting extreme panic. However, the company is close to a net cash position and can easily cover the CNY 2.7 billion convertible bond put option due in January 2025.
- CK Asset is the fifth-largest stock repurchaser in Hong Kong (as of October 10) and the only large-scale repurchaser among Hong Kong-listed residential developers, reflecting management's view that the stock is severely undervalued.
Companies/Assets Involved
- CK Asset (CKA): Core holding, low leverage, using the real estate crisis to acquire land reserves in Hong Kong, actively buying back shares. Bullish.
- MGM China: Macau gaming leader, EBITDA already above 2019 levels, strong recovery in the premium mass market. Bullish.
- China MeiDong Auto (MeiDong): Porsche/BMW dealer, stock price has fallen sharply but business hasn't deteriorated, close to net cash, convertible bond risk manageable. Bullish.
- Samsonite International: New investment, accelerating revenue recovery in China, strong sales in July-August. Bullish.
- Oisix: Japanese organic food e-commerce company, user growth below expectations, rising churn rate, weak performance. Bearish (short-term).
- Man Wah: Chinese sofa manufacturer, over 60% of China revenue from replacement demand, international business expanding, founder increased holdings by over USD 10 million. Bullish.
Investment Implications
For investors, the current extreme pessimism in the Chinese market creates contrarian buying opportunities, specifically in the following directions:
1. Focus on low-leverage, cash-flow-rich consumer and internet leaders (e.g., Alibaba, Tencent, Tongcheng Travel), whose revenue growth is decoupled from the macro narrative.
2. Position in Macau gaming and tourism stocks benefiting from China's consumption recovery (MGM China, Samsonite), as the recovery trend is already validated by data.
3. Avoid high-leverage real estate developers, but consider low-leverage companies (e.g., CK Asset) that can acquire distressed assets by exploiting industry difficulties.
4. Be cautious of the Japanese market, as Oisix's weakness suggests Japan's consumption recovery may be weaker than expected, and yen depreciation weighs on USD-denominated returns.
New Arguments and Data: Structural Divergence in Consumption Recovery and Hong Kong Market Discount Opportunity
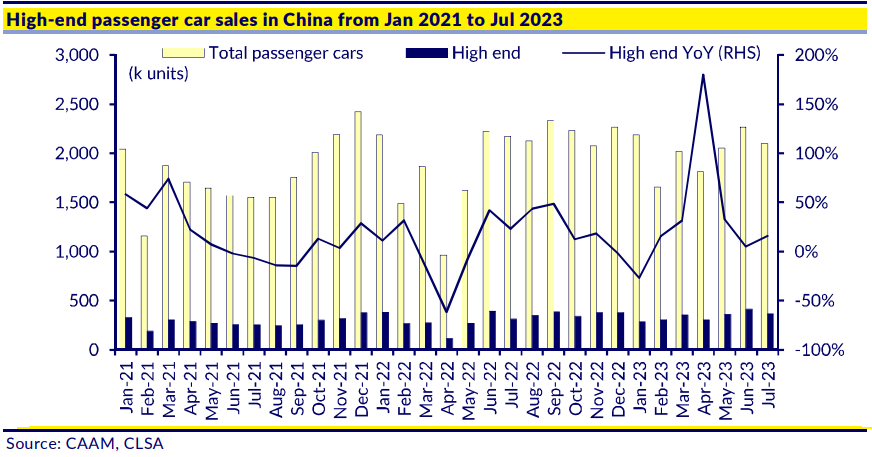
1. "K-shaped Divergence" in Consumption Recovery: Staples vs. Discretionary
- Strong Staples Consumption: Meituan data shows that during the holiday, average daily online consumption grew 153% compared to 2019, and dine-in consumption grew 254%, hitting a five-year high. Food orders from non-local consumers in remote areas surged 500%, and average cycling distance per user for shared bikes increased 100%. This indicates that low-ticket, high-frequency "instant gratification" consumption has fully surpassed pre-pandemic levels.
- Struggling Discretionary Consumption: Porsche and BMW dealer China MeiDong Auto faces greater headwinds, as automobiles, being large-ticket discretionary items, are significantly impacted by consumer confidence and interest rates. This starkly contrasts with platforms like Meituan, highlighting the "lipstick effect"—consumers are more generous with low-cost experiences but more cautious with high-priced goods.
2. Hong Kong Market Discount: A Divergence Between Historic Undervaluation and Structural Improvement
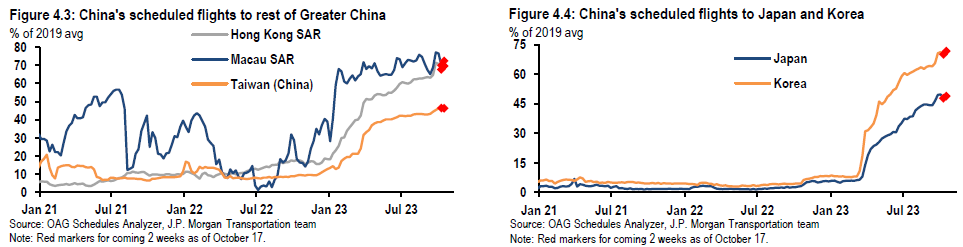
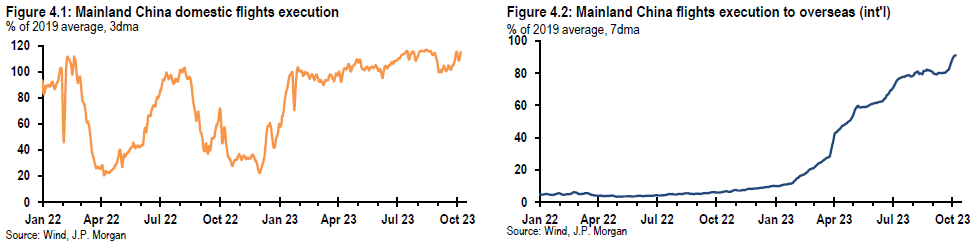
- Index Performance vs. Company Earnings Disconnect: The Hang Seng Index is down 37% from end-2019, yet many Hong Kong-listed companies have seen revenues recover and exceed 2019 levels. For example:
| Company | Metric | vs. 2019 | Current Valuation | 2019 Valuation |
|---|---|---|---|---|
| Samsonite | Adjusted Q2 Revenue | +14.6% | 8x Forward EBITDA | 9.2x Forward EBITDA |
| Samsonite | Adjusted Net Profit | +28% | EBITDA Margin +540bps | - |
| MGM China | EBITDA | +20%+ | 8.5x Forward EBITDA | Historical low |
| MGM China | Market Share | 9% → Mid-teens | - | - |
- Reasons for Discount: The Hang Seng Index has posted negative returns for the fourth consecutive year (a historical first), leading to compressed valuations across the Hong Kong market. However, individual company fundamentals have significantly improved. For instance, Samsonite achieved structural margin improvement by closing 23% of stores and cutting 30% of SKUs, while MGM China's market share jumped from 9% to the mid-teens.
3. Management Response: Accelerated Buybacks, Privatizations, and Business Restructuring
- Surge in Buyback Scale: In 2023 YTD, 212 companies conducted buybacks in Hong Kong, far exceeding the 152 in 2019. The buyback amount shows a negative correlation with the Hang Seng Index trend (see chart), indicating management believes stocks are undervalued.
- Privatization Trend: The number of privatizations in 2020-2021 doubled compared to 2019. However, in 2022-2023, as the 3M HIBOR rate rose to 5.2% (approximately 10 times higher than 2020), high LBO financing costs slowed privatization. For example, L'Occitane Chairman Reinold Geiger abandoned a takeover offer due to financing costs.
- Insider Buying: In 2023 YTD, insider buying volume reached 12 billion shares, a record high, contrasting sharply with the decline in the Hang Seng Index (see chart). This signals management's confidence in company value.
4. Portfolio Performance: Value Release Driven by Restructuring
- SharkNinja Spin-off Case: After SharkNinja listed on the NYSE and was fully distributed to shareholders, its combined market cap with JS Global was more than double JS Global's pre-spin-off market cap. This proves the "spring effect" in the Hong Kong market—significant value can be unlocked through actions like spin-offs and buybacks.
- Holdings Contribution:
| Holding | 3Q23 Contribution | 2023 YTD Contribution |
|---|---|---|
| SharkNinja | +4.53% | +4.53% |
| L'Occitane | +0.90% | - |
| MGM China | +0.81% | +1.24% |
| China MeiDong Auto | -1.33% | -3.19% |
- Performance divergence: Tourism, hospitality, and internet sectors benefited from the consumption recovery, while discretionary sectors like auto dealers dragged on the portfolio.
5. Samsonite New Holding Logic: Structural Improvement and Regional Recovery
- Business Restructuring: During the pandemic, the company closed 23% of loss-making stores, cut 30% of SKUs, and reduced non-revenue management expenses, boosting the EBITDA margin by 540bps compared to 2019.
- Growth Engine Tumi: Targeting a FY22-FY27 revenue CAGR of 25% (gross margin 70%+). The payback period for new stores in China is only 4-5 months (vs. 1.5 years in the US). In India, American Tourister/Samsonite accounts for 90%/10% of the market, offering significant upgrade potential.
- Lagging Regional Recovery: Asia (the highest profit region) is still affected by visa bottlenecks, high airfares, and Russian airspace restrictions, but domestic tourism has already exceeded 2019 levels. Once outbound travel recovers, operating leverage should drive further margin expansion.
- Valuation Margin of Safety: The current 8x forward EBITDA is below the 2019 level of 9.2x, but with higher margins and faster growth, and dividends are expected to resume next year.
6. Key Chart Interpretation (Data Source: webb-site.com / Factset / 2iqresearch.com)
- Hang Seng Buybacks vs. Valuation Multiple: From 2004-2023, the buyback amount (bar chart) shows a negative correlation with the Hang Seng Index NTM P/E (line chart). The 2023 YTD buyback amount has reached a historical peak (~USD 18,000mm), while the NTM P/E has fallen below 10x, the lowest since 2008.
- Number of Hong Kong Buyback Companies: 212 in 2023 YTD, a 39% increase from 152 in 2019, hitting a record high. The Hang Seng Index closing price (line) has declined concurrently, highlighting a "buy more as it falls" trend.
- Insider Buying Volume: 2023 YTD buying volume reached 12 billion shares, far exceeding the 2020-2022 levels (~4-6 billion shares), and diverging from the Hang Seng Index trend. This is often seen as a market bottom signal.
7. Risks and Outlook
- Interest Rate Risk: The high-interest-rate environment suppresses LBO financing, potentially delaying privatization processes, but buybacks and insider buying can still support stock prices.
- Regional Recovery Pace: A slower-than-expected recovery in Asian outbound travel could weigh on the short-term performance of companies like Samsonite, but the long-term structural improvement thesis remains intact.
- Policy Risk: The effectiveness of China's consumption stimulus policies needs monitoring. If the economic recovery falls short of expectations, the discretionary consumption sector may continue to face pressure.
Summary: The Hong Kong market is experiencing an extreme divergence of "improving fundamentals vs. compressed valuations." Management is proactively unlocking value through buybacks, privatizations, and spin-offs. The investment portfolio focuses on Hong Kong-listed stocks benefiting from the consumption recovery with structural advantages, such as Samsonite (travel recovery + margin improvement) and MGM China (market share growth + industry rebound), while using the market discount opportunity to increase holdings in undervalued quality assets.
New Arguments and Data Analysis
1. Valuation Discount and Geographic Premium: Quantifying Samsonite's "China Discount"
- Data Comparison: Samsonite currently trades at a forward PE of 10.7x with expected EPS growth of 16%, but China contributes only about 10% of sales. If listed on another market (e.g., US or Europe), its valuation could rise to 15-20x (comparable to consumer goods peers like Tumi or LVMH brands).
- Market Logic: The "China discount" for Chinese-listed companies stems from geopolitical risks, capital controls, and investor sentiment. For example, the MSCI China index forward PE has historically been 30-40% lower than the MSCI World index (2023 data: MSCI China at 9.8x vs. MSCI World at 16.2x). Samsonite's discount magnitude (10.7x vs. industry average 15x) reflects this systematic bias.
2. SharkNinja's Operational Efficiency and Cost Turnaround
- Inventory and Cost Cycle: The end of destocking by North American retailers (sell-in matching sell-out), combined with freight cost normalization, led to a 400bps YoY GPM improvement to 43.5%. Compared to the same period in 2022, freight costs as a percentage of revenue were about 8-10%, dropping to 4-5% in 2023, directly contributing ~3-4% margin improvement.
- Regional Growth Differences: European revenue growth (79.5%) far outpaced North America (7.6%), though North America has a larger base (~60% of revenue). European growth is driven by channel expansion (e.g., entering retail networks in Germany, France), while North American growth relies on new product launches (e.g., air purifiers, smart kitchen appliances).
3. L'Occitane's Brand Portfolio and Channel Penetration
- New Brand Contribution: Sol de Janeiro revenue grew 171% YoY, increasing its share of group revenue from 5% in 2022 to 12% in 2023. Elemis grew 24%, primarily benefiting from online channel expansion in the Asia-Pacific region, especially China.
- Regional Performance: Americas revenue grew 57% (constant currency), far exceeding Asia-Pacific (11%) and EMEA (6%). Growth in the Americas is driven by the US market (80% of Americas revenue), with the Sephora channel contributing about 30% of the increment.
- Future Catalysts: Sol de Janeiro plans to enter China in 2024, and Elemis plans to enter the US Sephora channel. The Chinese premium beauty market was approximately USD 60 billion in 2023 (Euromonitor), and L'Occitane's current market share is less than 1%, indicating significant growth potential.
4. Tongcheng Travel's Post-Pandemic Recovery and Market Share
- GMV and Profit Elasticity: GMV grew 146% YoY to RMB 59.7 billion, and adjusted net profit increased 4x YoY. Compared to 2019, accommodation revenue grew 91%, and transportation revenue grew 60%, indicating a strong rebound in post-pandemic travel demand.
- National Day Golden Week Data: Hotel room nights grew 100% vs. 2019, air ticket volume grew 30%, and ticket prices rose 16%. Train ticket revenue grew 90% (benefiting from monetization optimization, such as dynamic pricing and value-added services). This performance outperformed the industry average (Ctrip's National Day hotel bookings grew about 70% vs. 2019).
- Market Share: Tongcheng's penetration in lower-tier cities (downstream markets) increased from 15% in 2019 to 25% in 2023, primarily benefiting from WeChat ecosystem traffic (which accounts for about 70% of its MAU).
5. Alibaba's Valuation Discount and Buyback Actions
- Cash Flow and Buybacks: In Q2 2023, free cash flow was USD 5.4 billion, with buybacks of USD 3.1 billion (57% of free cash flow). The current free cash flow multiple is about 5x, far below the industry average (e.g., Amazon ~20x, PDD ~15x).
- Competitive Landscape: Alibaba's e-commerce market share fell from 55% in 2020 to 45% in 2023 (primarily eroded by PDD and Douyin), but its cloud services market share remained stable at 35% (IDC data). Aggressive management restructuring (e.g., spinning off Alibaba Cloud, Hema, Cainiao) aims to unlock valuation, but the market remains concerned about regulatory risks and growth slowdown.
6. MGM China's Macau Recovery and Policy Risks
- Visitor Flow and Gaming Revenue: During the National Day holiday, Macau visitor arrivals recovered to 86% of 2019 levels, and gaming revenue recovered to 70% of 2019 levels (Macau Gaming Inspection and Coordination Bureau data). MGM China's market share rose from 9% in 2019 to 12% in 2023, primarily benefiting from premium mass-market customers (average bet size up 40% vs. 2019).
- Policy Impact: The Macau government is considering criminalizing illegal currency exchange, causing sector volatility. However, similar policy discussions occurred in 2021 and 2022 with limited actual enforcement. MGM China's EBITDA margin (28% in Q2 2023) is higher than the industry average (25%), demonstrating operational resilience.
7. Oisix's Weak Japanese Consumption and Cost Optimization
- ARPU Decline: ARPU for the three major B2C subscription businesses (Oisix, Daichi, Radish Boya) fell 3-5% YoY, mainly due to inflation (Japan's 2023 CPI YoY +3.2%) causing consumers to shift to discount channels. The subscriber churn rate rose from 8% in 2022 to 11% in 2023.
- Cost Improvement Measures: A food recycling center (converting food waste into feed/fertilizer) is expected to contribute JPY 200-300 million in profit in 2024; new logistics facilities (automated sorting) are expected to reduce unit delivery costs by 10-15%. If execution is successful, the operating margin could recover to 4.5-5.0% in 2024.
8. China MeiDong's Porsche Oversupply and Cash Flow Risks
- New Car Sales Margin: Plunged from 5.2% in H1 2022 to 0.2% in H1 2023, mainly due to weak demand for Porsche (40% of its revenue) in China (Porsche China sales down 15% YoY in H1 2023). The increasing penetration of BMW EVs (BMW EVs accounted for 12% of its China sales in H1 2023) further compressed margins on traditional fuel vehicles.
- Convertible Bond Risk: The convertible bond maturing in January 2025 (~USD 230 million) is already covered by overseas cash (~RMB 2.3 billion). However, if new car sales margins remain depressed, free cash flow in 2024 could fall below RMB 500 million (H1 2023 was RMB 314 million), increasing refinancing pressure.
Comparative Data Table
| Company | Key Metric | Current Value | Industry Average/Peer | Difference Analysis |
|---|---|---|---|---|
| Samsonite | Forward PE | 10.7x | 15x (Consumer Goods) | China discount leads to 29% valuation discount |
| SharkNinja | GPM | 43.5% | 38% (Home Appliances) | Freight normalization contributes 400bps improvement |
| L'Occitane | Sol de Janeiro Revenue Growth | 171% | 20% (Group Total) | New brand drives high growth |
| Tongcheng Travel | National Day Hotel Room Nights vs 2019 | +100% | +70% (Ctrip) | Downstream market penetration advantage |
| Alibaba | Free Cash Flow Multiple | 5x | 15x (PDD) | 67% valuation discount |
| MGM China | Market Share vs 2019 | +3pp | -1pp (Sands China) | Successful premium customer strategy |
| Oisix | ARPU YoY Change | -3% | +2% (Japan E-commerce Avg) | Inflation and consumption shift |
| China MeiDong | New Car Sales Margin | 0.2% | 3.5% (Luxury Car Dealer Avg) | Porsche oversupply |
Core Thesis Supplement
- Geographic Premium and Discount: The valuation differences between Samsonite and Alibaba highlight the systemic impact of listing location. If Samsonite were to list in the US, its PE could rise above 15x (comparable to Tumi's 18x), increasing market cap by about 30-40%.
- Cost Cycle Reversal: SharkNinja's GPM improvement validates the shift in freight costs from a headwind to a tailwind, a similar logic applicable to other consumer goods companies reliant on shipping (e.g., home appliances, toys).
- New Brands vs. Mature Brands: L'Occitane's Sol de Janeiro and Elemis show that new brands in low-penetration regions (e.g., Asia-Pacific, Americas) can contribute over 50% of incremental growth, while mature brands (L'Occitane original brand) grow only 5-10%.
- Policy Risk vs. Operational Resilience: Both MGM China and China MeiDong face policy uncertainties (Macau currency exchange regulation, Porsche supply adjustments), but the former hedges through customer quality improvement, while the latter relies on OEM coordination. Investors need to distinguish between systemic risks and company-specific risks.