Finding Patience in... an Early 2000s Hip-Hop Song?
Patient Capital Management is a Baltimore asset manager founded in 2020 by Samantha McLemore, CFA — Bill Miller's long-time co-manager (working together since 2002, running the flagship Opportunity Equity strategy since 2014). Continuing the Miller-school contrarian tradition, it practices "time arbitrage": exploiting behavioral mispricing to concentrate in controversial growth names (tech, healthcare, Bitcoin-related) at deep discounts to intrinsic value. Its site preserves Bill Miller's complete 1995-2022 market letters, alongside ongoing quarterly letters and webinars.
In plain words
This report says the stock market is booming and people are getting overconfident. The author instead bought beaten-down healthcare stocks and beat the market. His advice: when everyone is euphoric, stay patient and wait for bargains, don't chase hot AI stocks. He warns that 'buy the dip' has become a dangerous consensus. Worth reading because it uses real data and history to show why you shouldn't get swept up in the hype.
Patient Capital research article discusses the current market being in the late-cycle bull phase, with investor sentiment optimistic but bubble risks present. The core view is that while the path of least resistance remains upward, the heightened enthusiasm suggests caution. Key conclusions include:
Theme and Background
This chapter discusses the current market being in the late-stage bull phase, where investor sentiment shifts from caution to optimism and even euphoria. The author argues that the path of least resistance for the market remains upward, but the rising enthusiasm warrants caution. Using "heat" as a metaphor, the report draws parallels between extreme weather and the "red-hot" performance of the semiconductor sector, prompting reflections on market sentiment and investment discipline.
Core Thesis
The author's core investment argument is: Although the overall market may still rise, excessive optimism and complacency among investors are approaching dangerous territory, and a contrarian strategy of patiently waiting for undervalued opportunities will be rewarded. Counterintuitive judgments include:
- The market's best prospects emerge during periods of low sentiment, but the best returns often occur in the late stages of a bull market—the author believes the market is currently in this phase.
- Despite technology (especially AI and semiconductors) dominating market gains, the author has achieved excess returns by underweighting tech and overweighting undervalued sectors such as healthcare.
- The consensus that "the best hedge is to prepare to buy the dip" is itself a sign of excessive optimism; historically, such sentiment often signals risk.
Key Arguments and Data
- Market Performance Comparison: The S&P 500 rose 15.2% in the quarter, while the Opportunity Equity Strategy delivered a net return of 17.3%, outperforming the index; the strategy's net return for the first half was 10.4%, also ahead of the benchmark.
- Tech Dominance: The Philadelphia Semiconductor Index surged 101.7% in the first half, with the tech sector contributing 82% of the market's gains. The author's only semiconductor holding, Nvidia (NVDA), actually lagged the market.
- Healthcare Sector's Strong Contribution: Although the sector overall lagged the market, six healthcare stocks in the strategy posted gains of over 20% in the first half, collectively contributing 935 basis points.
| Stock | First-Half Return |
|---|---|
| RPRX | 46.5% |
| PGEN | 36.4% |
| ILMN | 34.1% |
| CVS | 32.5% |
| UNH | 27.6% |
| BIIB | 22.8% |
| TEM | -1.9% |
- Speculative Indicators Heating Up:
- SpaceX completed the largest IPO in history, raising $86 billion—more than double the previous record (Saudi Aramco).
- Margin debt is at historic highs, and leveraged ETF volumes have surged.
- M&A activity in the first half hit record levels.
- Comparison with Historical Bubbles:
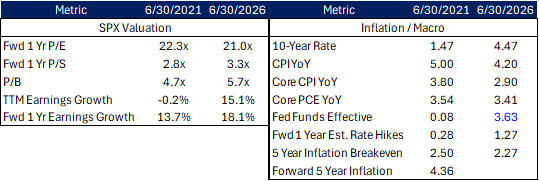
- The S&P 500's forward P/E of 20.0x is below the 24.6x peak of the 2000 tech bubble; the tech sector's P/E of 24.8x is far below the 61.0x at that time.
- Citigroup's bear market checklist shows 11.5 out of 18 indicators flashing warnings, compared to 17.5 at the March 2000 peak.
- The current S&P 500 has lower valuations, higher earnings growth, and more reasonable interest rates, making it less extreme than the 2021 innovation bubble and the 2000 tech bubble.
- Signs of Rationalization in AI: Companies like Uber and Microsoft are limiting AI usage due to rising costs; enterprises are shifting to cheaper open-source Chinese models; one startup reduced its token usage to one-third of its quota.
Companies/Assets Involved
| Company/Asset | Role | Key Data | Bullish/Bearish |
|---|---|---|---|
| Nvidia (NVDA) | Only semiconductor holding in the strategy | Stock price $202.78, lagged market in first half | Neutral (held but no excess return) |
| RPRX | Healthcare holding | Up 46.5% in first half | Bullish |
| PGEN | Healthcare holding | Up 36.4% in first half | Bullish |
| ILMN | Healthcare holding | Up 34.1% in first half | Bullish |
| CVS | Healthcare holding | Up 32.5% in first half | Bullish |
| UNH | Healthcare holding | Up 27.6% in first half | Bullish |
| BIIB | Healthcare holding | Up 22.8% in first half | Bullish |
| TEM | Healthcare holding | Down 1.9% in first half | Neutral (worst performer) |
| SpaceX (SPCX) | Speculative sentiment indicator | Completed largest IPO ever, raised $86B | No clear direction (market sentiment reference) |
| Uber, Microsoft | AI cost control examples | Limiting AI usage to manage costs | No clear direction (industry trend reference) |
Investment Implications
- Contrarian Positioning in Undervalued Sectors: The healthcare sector hit a 50-year relative valuation low in 2022, where the author built contrarian positions and profited. Investors should focus on sectors currently overlooked by the market and trading at historically low valuations.
- Beware of Consensus Optimism: "Buying the dip" has become market consensus, which itself is a risk signal. Investors should reduce chasing short-term sentiment-driven rallies and increase long-term holdings backed by fundamentals.
- AI Investment Requires Attention to Costs and Rationalization: The price and earnings growth driven by surging AI demand may be unsustainable, as companies begin to control costs and shift to cheaper alternatives. Investors should be wary of correction risks in overvalued AI-related assets.
- Historical Comparisons Show the Bubble Is Not Yet Extreme: Although market sentiment is euphoric, valuations, earnings growth, and interest rate conditions are all more favorable than the peaks of 2000 and 2021, suggesting the market still has upside potential, though volatility may increase.
Theme and Background
This chapter focuses on whether the return on invested capital (ROIC) for AI infrastructure investments is sustainable and addresses market concerns about the risk of model commoditization. The author argues that despite pessimistic sentiment, the current ROIC for AI data centers is very strong, and the overall market environment remains favorable.
Core Thesis
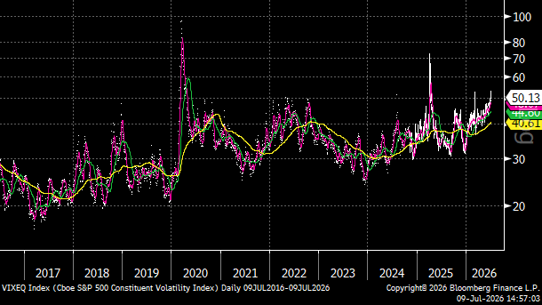
The author’s central judgment is that the risk of AI model commoditization is overestimated, the current ROIC for AI data centers is as high as 30-40%, and public market valuations are reasonable. The counterintuitive aspect is that the author actively seeks out pessimistic areas within an overall optimistic market (low volatility), using high individual stock volatility to add positions contrarily, rather than chasing popular tech stocks.
Key Arguments and Data
1. Empirical Evidence on AI Data Center ROIC: Citing analysis from the Journal of a Golfing Investor, contracts involving xAI, Google, and Anthropic show remarkable returns:
| Metric | Google Deal | Anthropic Deal |
|---|---|---|
| Annual Contract Revenue | $11.0B | $15.0B |
| Operating Costs | -$0.7B | -$1.25B |
| Cash Operating Profit | $10.3B | $13.75B |
| Depreciation (4-year life) | -$3.75B | -$5.25B |
| Operating Profit | $6.55B | $8.50B |
| Capital Base | $15B | $21B |
| Pre-tax ROIC | ~44% | ~40% |
| After-tax ROIC (21% tax rate) | ~35% | ~32% |
2. Demand Continues to Outstrip Supply: AWS raised prices in early July, indicating that overall demand still exceeds supply, which is the most critical factor.
3. Individual Stock Volatility Creates Opportunities: Although overall market volatility is low, the VIX for individual S&P 500 stocks remains high, providing ongoing opportunities for contrarian investing.
4. QXO Case Study: The stock price has fallen 50% from its highs, driven by arbitrage pressure from the Topbuild deal and fund expectations of a weak quarter (fewer storms reducing roofing business, weak housing market). The author views these short-term pressures as buying opportunities, expecting a compound annual growth rate of approximately 30% over the next 3-5 years, with company profits growing 2-3 times by 2030.
5. Valuation Comparison of Payment Companies:
| Company | Current Price | Key Characteristics | Expected Return |
|---|---|---|---|
| Global Payments (GPN) | $74.38 | Traditional acquiring merchant acquirer, stock down 2/3 from 2021 highs, reached agreement with activist investor Elliott | Expected FCF/share of ~$10 next year (13% FCF yield), rising to $14+ by 2028 (19% yield), mostly used for buybacks |
| Adyen (ADYEN) | €834.50 | Leader in digital payment infrastructure, stock down nearly 60% from 2025 highs | Core e-commerce penetration ~50%, significant growth potential in omnichannel and international markets, expected mid-to-high single-digit revenue growth, return rate of 15-20%+ |
6. Meta (META): Down 14% over the past year, with market concerns that its AI investments could turn free cash flow negative. The author believes Meta has strong AI talent and computing power; if investments pay off, it could replicate Alphabet’s success path.
Companies/Assets Covered
- QXO ($14.58): Bullish. Short-term pressures (arbitrage, weak quarter expectations) create buying opportunities, with an expected annualized return of 30%.
- Adobe (ADBE $222.65): Bullish (discussed last quarter, still attractive).
- Bitcoin ($63,263.81) and Coinbase (COIN $158.44): Bullish (discussed last quarter).
- Meta (META $631.48): Bullish. Pessimism over AI investments has caused the stock to lag, but fundamental improvements are expected.
- Global Payments (GPN $74.38): Bullish. Extremely low valuation (13% FCF yield), scale advantages plus activist investor discipline, expected FCF growth of 40%.
- Adyen (ADYEN €834.50): Bullish. Technological leadership, significant growth potential in omnichannel and international markets, market expectations are overly pessimistic.
- Other Core Holdings: Precigen ($5.53), Royalty Pharma ($57.96), Citigroup ($139.57), Alphabet ($358.89), UnitedHealth Group ($431.68), Amazon ($247.04) — all held with confidence.
Investment Implications
- Contrarian Positioning in AI Infrastructure: Market concerns over model commoditization are excessive; actual ROIC is as high as 30-40%, and demand continues to outstrip supply. Investors should focus on the contract quality and capital returns of AI computing providers, rather than just stock price volatility.
- Leverage Individual Stock Volatility: In a low overall market volatility environment, high individual stock volatility (e.g., QXO, GPN, ADYEN) offers contrarian accumulation opportunities. Prioritize targets that are mispriced due to short-term factors (arbitrage, weak quarter expectations, competitive concerns) but have solid long-term fundamentals.
- Differentiated Opportunities in the Payment Sector: Both traditional acquirers (GPN) and digital payment platforms (ADYEN) are undervalued due to competitive concerns, but they are at different stages of development. GPN benefits from scale effects and activist investor discipline, while ADYEN benefits from technological advantages and underpenetrated markets. Investors should distinguish between value traps and value opportunities.
- Watch for AI Investment Returns at Tech Giants: Meta’s AI investments have weighed on its stock price, but if ROIC is validated (similar to Alphabet), a valuation recovery may follow. Investors need to monitor whether AI investments translate into revenue growth and free cash flow improvement.