1Q26 Quarterly Webinar
Patient Capital Management is a Baltimore asset manager founded in 2020 by Samantha McLemore, CFA — Bill Miller's long-time co-manager (working together since 2002, running the flagship Opportunity Equity strategy since 2014). Continuing the Miller-school contrarian tradition, it practices "time arbitrage": exploiting behavioral mispricing to concentrate in controversial growth names (tech, healthcare, Bitcoin-related) at deep discounts to intrinsic value. Its site preserves Bill Miller's complete 1995-2022 market letters, alongside ongoing quarterly letters and webinars.
In plain words
This is about how investor Samantha McLemore sees today's market. She says the rally isn't a bubble—it's driven by strong company earnings, not just hype. Extra info (like team names) can make you overconfident but less accurate. Institutions are very cautious, but companies themselves are buying back stock heavily, a bullish sign. Her advice: ignore short-term noise, focus on fundamentals, and remember stocks average 10% yearly returns over time.
Patient Capital 2026 First Quarter Webinar Hosted by Founder and CIO Samantha McLemore, the webinar focuses on distinguishing "signal" from "noise" in a noisy market environment. The core viewpoint quotes Nate Silver's famous remark, emphasizing the importance of scientific knowledge and self-awaren
Theme and Background
This chapter is the opening section of Patient Capital's first quarter 2026 quarterly webinar, hosted by Founder and CIO Samantha McLemore. She begins by thanking the team and attendees, then introduces the core theme: distinguishing "signal" from "noise" in a noisy market environment. Quoting Nate Silver, she emphasizes the importance of scientific knowledge and self-awareness, noting that additional information (such as team names) actually reduces predictive accuracy while increasing overconfidence. The report also reviews the firm's history: Patient Capital was founded in 2020 as part of Miller Value Partners, acquired the co-managed retail fund business in early 2023, and is approaching its third anniversary.
Core Views
- Signal vs. Noise: The market is filled with substantial noise; investors must learn to differentiate truly important signals from irrelevant distractions. Extra information (like team names) reduces predictive accuracy and increases overconfidence—a "double whammy."
- Long-Term Perspective: Over the long term, the stock market has averaged a 10% annual return. Investors should avoid being swayed by short-term noise and focus on fundamental analysis.
- Investment Philosophy: The core is to find the gap between intrinsic value and market expectations, using a flexible strategy to seek undervalued opportunities while prioritizing client interests.
Key Arguments and Data
- Academic Research: A study on predicting basketball game winners found that when participants were given additional data (like team names), their predictive accuracy declined, but their confidence increased. This reveals the counterintuitive phenomenon that "knowing more" can be harmful.
- Long-Term Market Performance: Over the long term, the stock market has averaged a 10% annual return. Investors who are shaken by short-term noise (such as quarterly fluctuations) often make significant mistakes.
- Firm Performance:
- The four funds managed by Bill Miller all generated excess returns.
- The strategy independently managed by the author since 2014 has consistently outperformed the market since its launch.
- The Opportunity fund has also delivered strong performance since the author took over sole management.
- Incentive Structure: The author invests over half of their liquid assets in their own funds; analysts receive long-term incentive compensation only if they outperform the market over a rolling five-year period.
Companies/Assets Involved
- Patient Capital: The investment management firm founded by the author, focused on finding the gap between intrinsic value and market expectations. The core team includes top talent such as Bill Miller and Michael Mauboussin.
- Miller Value Partners: Patient Capital was initially established as part of this firm before acquiring its co-managed retail fund business in early 2023.
- Legg Mason: The author worked here alongside Bill Miller for decades, accumulating extensive experience.

Investment Implications
- Avoid Information Overload: Investors should be wary of the "knowing more" trap, avoiding overconfidence from extra information that degrades decision quality. Focus on core fundamental data, not market noise.
- Adhere to Long-Termism: The stock market's long-term average annual return is 10%; short-term volatility is mostly noise. Investors should remain patient and avoid altering long-term strategies due to short-term events.
- Seek Value Gaps: Investment opportunities lie in identifying the gap between market expectations and intrinsic value. By quantifying the market's implied expectations (e.g., cash flows, growth rates) and comparing them with one's own analysis, undervalued assets can be found.
- Focus on Incentive Structures: Choose funds where the management team's interests are highly aligned with investors (e.g., fund managers investing a large portion of their personal wealth in the fund, analysts' long-term incentives tied to performance). This helps ensure investment decisions prioritize client interests.
This concludes the analysis of the second part (2/10) of the "Introduction" section. We will now focus on Samantha McLemore's discussion of market cycles, valuations, corporate earnings, and institutional positioning, adding new arguments, data, and perspectives.
Market Cycle Positioning: Correction from "Optimism" to "Localized Frenzy"
Samantha McLemore cites Sir John Templeton's market sentiment cycle theory, positioning the current market as "mature in optimism" with "localized frenzy" already appearing. She provides specific data to support this judgment:
- Sectors with Extreme Sell-offs: Stocks related to quantum computing, nuclear energy, and cryptocurrencies experienced peak-to-trough declines of 60%-75%. The software sector as a whole fell 35% from its highs. Some high-profile growth stocks like Duolingo and Trade Desk saw declines of 80%.
- Healthy Nature of the Correction: She views these sell-offs as "relieving market excesses" and "very healthy." This implies the market is digesting prior bubbles through localized clearing, rather than a systemic collapse.
New View: This correction after "localized frenzy" is similar to the 2021 ARK Innovation ETF crash but broader in scope. It suggests the market is not in the final stage of Templeton's "frenzy" (i.e., a full-blown bubble) but rather in a structural divergence within the "optimism" phase. This creates opportunities for active management: identifying which sectors have corrected sufficiently and which still carry risk.
Valuation and Earnings "Decoupling": A Neglected Positive Signal

McLemore presents a core argument: the market's strong returns (15.8% annualized since February 2020) have not been driven by valuation expansion but by exceptionally strong corporate earnings growth.
| Period | S&P 500 Annualized Return | Ending P/E Ratio | Annualized EPS Growth | Notes |
|---|---|---|---|---|
| 2010-Feb 2020 (Post-Financial Crisis) | 12.8% | ~19x (Feb 2020) | 11% | Valuation recovery from lows, steady earnings growth |
| Feb 2020 - Mar 2025 | 15.8% | ~19x (Mar 2025) | 16% (2021-2026E) | No valuation expansion; earnings growth is the sole driver |
| Apr 2025 (New High) | - | 21.7x | - | Recent slight valuation expansion |
Key Data Interpretation:
1. Earnings Growth is Core: The projected 16% annualized EPS growth for 2021-2026 is significantly higher than the 11% from 2010-2019 and the 14% during the 2002-2006 bull market. EPS growth for 2025 alone is estimated near 17% and accelerating.
2. Valuation "Anchoring" Effect: Despite new market highs, the P/E ratio in March 2025 was still comparable to February 2020 (pre-pandemic peak) and 2023 levels (around 19x). This breaks the simplistic logic of "new high = overvalued."
3. Recent Change: As of April, the P/E ratio rose to 21.7x, suggesting the market is beginning to pay a higher premium for strong earnings growth. This could signal a transition from "earnings-driven" to "valuation + earnings dual-driven," but also warrants caution against valuation overheating.
New View: This pattern of "earnings growth leading valuation" is fundamentally different from the "irrational exuberance" of the late 1990s. At that time (1999-2000), the S&P 500 P/E ratio exceeded 25x, while earnings growth was far below current levels. The current market resembles 2016-2017, a period of strong earnings cycles with reasonable valuations. This provides a "safety cushion" for long-term investors: as long as earnings do not experience a cliff-like decline, the risk of a major market correction is relatively contained.
Extreme Institutional Positioning and Market Resilience
McLemore provides extreme data on institutional positioning, noting that the market's ability to rebound despite such "one-sided" positioning reveals inherent strong demand.

| Indicator | Data | Interpretation |
|---|---|---|
| Russell 2000 Short Interest | All-time high | Small-cap stocks are extremely bearish; market sentiment is deeply pessimistic. |
| Hedge Fund Net Exposure | 5-year low | Hedge funds are highly defensive overall, with conservative positions. |
| CTA (Commodity Trading Advisor) Positioning | Extremely defensive | Trend-following funds are heavily short, forced to buy to cover regardless of market direction in April. |
| Corporate Buybacks | Record high in Q1 | Companies are aggressively repurchasing shares using their own cash flow and low interest rates, becoming a major buyer in the market. |
New View: This pattern of "extreme institutional pessimism vs. extreme corporate optimism" is a classic contest between "smart money" and "company insiders." Historical data shows that when corporate buybacks peak, it often signals a market bottom or the start of a medium-term rally (e.g., March 2020, October 2022). Forced CTA buying (regardless of market direction) provides short-term technical support. This explains why the market's correction was relatively limited and quickly recovered despite external shocks like the Iran situation.
Summary: Signals and Risks
McLemore's core signal is: We are in a secular bull market driven by strong corporate earnings. The market has digested localized frenzy, valuations are reasonable, and extreme institutional positioning provides rebound momentum. The risk is that any factor threatening corporate earnings growth (e.g., economic recession, escalating geopolitical conflict, resurgent inflation) could end this bull market. She believes technology has been a key driver of earnings growth in recent years and warrants continued focus.
New Analysis: Deep Dive into Market Drivers and Investment Opportunities
1. Re-examining Earnings Growth and Valuation Dynamics
Samantha McLemore emphasizes that market performance is entirely driven by earnings growth, not valuation expansion. The 2025 earnings growth estimate has been revised up from 12% to nearly 14%, and 2026 estimates have risen further to nearly 17%. This trend strengthens the fundamental support for the market, especially given current valuations are at "roughly fair value." However, it is important to note that earnings growth expectations could be impacted by macroeconomic headwinds, such as sticky inflation or geopolitical risks (e.g., the Iran conflict), which are discussed later.

Comparative Data: Earnings Growth Estimate Revisions
| Year | Jan 2025 Estimate | Current Estimate | Change |
|---|---|---|---|
| 2025 | 12% | 14% | +2% |
| 2026 | 13.6% | 17% | +3.4% |
2. Technology Sector: The Battle Between CapEx and Returns
McLemore notes that the surge in capital expenditure (CapEx) in the tech sector (especially among hyperscalers) has sparked bubble concerns, but she views this concern as healthy because it curbs excessive optimism. Key evidence includes:
- Amazon's Rational Investment: Andy Jassy's shareholder letter emphasizes confidence in return on invested capital (ROIC), consistent with Amazon's historical pattern of "investment cycle → short-term pressure → long-term returns." For example, after similar past cycles, Amazon's performance rebounded significantly.
- Hardware Asset Life Debate: A Wall Street Journal report shows that NVIDIA's three-year-old H100 chip price has risen 28% since December, refuting the bearish view that "asset lives are too short to be profitable." Andy Jassy estimates data center asset life at 30 years and chips at 5-6 years, supporting the long-term return outlook.
- Cash Flow Dynamics: Operating cash flow for hyperscalers is growing strongly, but CapEx is rising in tandem, putting pressure on free cash flow. Market consensus expects free cash flow to bottom and recover in 2025; if realized, this would be positive for tech stocks.
Key Data: Tech Sector Earnings Growth
| Metric | Value |
|---|---|
| Tech sector earnings growth over the past year | 45% |
| Financial sector earnings growth over the same period (comparison) | Significantly below 45% |
3. Market Breadth and Relative Opportunity Set Changes
McLemore emphasizes that the market has shifted from a "narrow MAG7-dominated rally" to broader participation. Specific changes include:
- Valuation Premium Reversal: As of quarter-end, the historical valuation premium for the top 10 S&P 500 stocks was 11%, while the premium for the remaining 490 stocks was 13%, indicating increased relative attractiveness for small and mid-cap stocks.
- Value vs. Growth Valuation Comparison: Value stocks currently trade at a 14% premium to their historical average P/E, while growth stocks trade at a 12% premium. The gap has narrowed to normal levels, suggesting value opportunities are no longer extreme.

Comparative Data: Valuation Premium Changes
| Category | Historical Valuation Premium | Notes |
|---|---|---|
| Top 10 S&P 500 Stocks | 11% | Below the remaining 490 |
| Remaining 490 Stocks | 13% | Relatively higher |
| Value Stocks | 14% | vs. historical average |
| Growth Stocks | 12% | vs. historical average |
4. The Future Role of Active Management
McLemore believes the dominance of MAG7 is not over, as these companies have strong fundamentals and reasonable valuations, especially with AI deployments potentially further solidifying their advantages. However, when market breadth expands, active management will regain an edge because passive indices are overly concentrated in a few stocks. Quoting Upton Sinclair, she emphasizes the impact of incentives on investment views and notes that a broad, flexible investment mandate (like Patient Capital Management's strategy) can uncover more mispricing opportunities through "compare, compare, compare."
5. Risk Factors and Ongoing Monitoring
McLemore mentions several risks requiring close attention:
- Geopolitics: The Iran conflict could impact energy costs and market sentiment.
- Private Credit: Potential systemic risk.
- Software and AI Disruption: Technological iteration could reshape industry landscapes.
- CapEx Return Uncertainty: While current data is optimistic, the ability of hyperscaler investments to generate sustained high returns needs verification.
These factors are updated daily, and investment views require dynamic adjustment.

New Analysis: Valuation Dispersion, Portfolio Performance, and Software Sector Opportunities
1. Valuation Dispersion and the Stock-Picking Environment
Samantha McLemore emphasizes that valuation dispersion remains high, which is favorable for active stock pickers. Since 2021-2022, both extremes (cheapest and most expensive) have compressed:
- Cheapest Companies: Relative valuations at the end of 2022 deviated significantly from historical levels, then performed strongly in 2022, and have now returned to normal historical levels.
- Most Expensive Companies: Valuations once exceeded tech bubble levels; although they have compressed recently, they remain near historical highs.
Key Data: The middle ground (grey area) of the market still offers ample opportunities. Individual stock volatility is extremely high, and extreme swings in specific sectors or stocks create a "ripe environment" for stock picking.
2. Portfolio Performance and Drivers
Since McLemore became lead portfolio manager at the end of 2022, the portfolio has performed strongly:
| Metric | Cumulative Return (Since End of 2022) |
|---|---|
| S&P 500 | 22%+ |
| Portfolio (Opportunities) | 31%+ |
| S&P Value (incl. Microsoft, Amazon, etc.) | 15.8% |

Quarterly Performance Drivers:
- Energy Sector: Multiple energy stocks in the portfolio performed well, benefiting from the overall strength of the energy sector.
- Healthcare: Defensive healthcare stocks (e.g., Royalty Pharma) positioned over the past two years stood out during the Q1 market decline, becoming the portfolio's top contributors.
- Detractors: Travel stocks (e.g., Norwegian Cruise Line, airlines) impacted by rising oil prices, along with some financial stocks and MAG7, underperformed. UnitedHealthcare was the worst performer due to its lack of defensiveness, but it rebounded strongly in April following a favorable Medicare Advantage rate decision and better-than-expected earnings.
3. Portfolio Valuation and Holdings Structure
Valuation Comparison (Quarter-End Data):
| Metric | Portfolio | S&P 500 | Difference |
|---|---|---|---|
| Forward P/E | 13.8x | 20.0x | Market premium of 45% |
| Expected Earnings Growth | Faster | Slower | — |
Holdings Structure:
- Classic Value Stocks (low multiples, recognized value): ~50% of portfolio
- Attractive Compounders (e.g., Royalty Pharma, still cheap but requires judgment): Rose to 45%, one of the highest levels historically
- During the Q1 market pullback, the portfolio increased allocations to some classic value stocks.

Top 10 Holdings (by issuer): Royalty Pharma, Citigroup, Alphabet, QXO, Precigen (held through multiple securities)
4. Software Sector Opportunity: Adobe Case Study
McLemore provides a detailed analysis of the investment logic in the software sector:
Historical Valuation Comparison (S&P Application Software, EV/Operating Profit):
| Time Point | Valuation Multiple | Notes |
|---|---|---|
| Aug 2011 (Marc Andreessen's "Software is Eating the World") | 11x | Very low valuation |
| Oct 2023 (Sector Peak) | 28x | Valuation tripled |
| Current | Still high (GAAP incl. stock-based comp) | Most companies remain expensive |
Core Issue: High valuations rely on assumptions about "terminal value" 20 years out (competitive advantage period, high return on capital period). When the market fears disruption risk, investors are unwilling to look too far ahead, leading to "air pocket" declines.
Adobe Investment Logic:
- Pressure Source: Long suppressed by concerns over disruption from Canva and Figma; attempted to acquire Figma but failed.
- Current Valuation: Free cash flow yield of 11%, P/E of 10x, significant buybacks (recently announced $25 billion buyback authorization).
- Core Judgment: The market is overly pessimistic. Current valuation already reflects fundamental risks, making it one of the few mispricing opportunities with high conviction.

5. Comparative Data Summary
| Dimension | Portfolio | Market | Difference |
|---|---|---|---|
| Forward P/E | 13.8x | 20.0x | -31% |
| Expected Earnings Growth | Faster | Slower | Positive |
| Software Sector Historical Valuation (2011 vs 2023) | — | 11x → 28x | +155% |
| Portfolio's Compounder Allocation | 45% | — | All-time high |
Core View: Market valuation dispersion continues to offer opportunities for stock picking. The portfolio trades at a significant discount to high-growth companies. The correction in the software sector is creating a few mispricing opportunities similar to Adobe.
New Arguments and Data Analysis: Deepening Market Misjudgment and Value Reassessment
1. Software Industry: Adobe's Defensive Growth and Market Underestimation
- Data Support: Adobe has repurchased approximately 10% of its outstanding shares over the past two years, while many peers (e.g., Salesforce, ServiceNow) are still issuing shares. This capital discipline is rare in the software industry, especially during the AI transition.
- Business Adjustment: Adobe's "freemium + models of models" strategy lowers customer acquisition costs in the SMB and consumer markets; its enterprise platform IP protection (e.g., Firefly copyright indemnification) builds a moat. Despite market concerns about AI disruption, its revenue continues to grow at high single-digit to low double-digit rates.
- Valuation Comparison: Samantha believes that if Adobe grows at just 7%-8% for 4 years, its intrinsic value is around $240 (160% of the current stock price). This reflects excessive market pessimism about "growth sustainability," similar to Meta's undervaluation in 2023 (P/E of 12x at the time, later rebounding 300%).
2. Retail and Cloud Computing: Amazon's Margin Revolution vs. Walmart's Valuation Premium

- Key Data:
| Metric | Amazon | Walmart |
|---|---|---|
| Gross Margin | ~48% (2024) | ~24% |
| Operating Margin | ~7% (2024) | ~4% |
| Operating Profit Growth | 17%-22% (high teens) | 5%-8% (mid-single digits) |
| P/E (TTM) | 33x | 44x |
- Core Contradiction: Amazon continues to gain retail market share (38% e-commerce market share in 2024 vs. Walmart's 7%), and AWS contributes 60% of operating profit (29% margin in Q4 2024). Yet the market gives Walmart a higher valuation, partly due to its defensive attributes. Samantha views this as an "irrational premium," similar to the valuation dislocation between Tesla and traditional automakers in 2020.
- New Business Potential: Low-earth orbit satellites (Project Kuiper) and healthcare (Amazon Clinic) have not yet contributed revenue, but analysts estimate Kuiper's value at $10-30 billion (2025), while the total healthcare market exceeds $4 trillion. Even at a 1% penetration rate, this business could be worth ~$40 billion, or 3% of Amazon's current market cap.
3. Biopharma Finance: Royalty Pharma's Unique Capital Structure
- Business Model: As a "synthetic royalty" investor, Royalty Pharma acquires future sales shares of drugs (e.g., pancreatic cancer drug Revumenib) to generate low double-digit returns (historical IRR 13%-17%). Its levered returns (high teens) outperform private equity funds (average IRR 10%-12%).
- Market Misunderstanding: The market treats it as a "biotech ETF," but it is actually a "capital allocation platform." Deals with J&J and Biogen in 2024 show that large pharma companies view it as an "R&D cost hedging tool" (accounting offset for R&D spending), creating unique demand.
- Valuation Space: Current stock price is $48-49. Samantha believes intrinsic value is above $80 (based on 15% earnings growth over the next 5 years). Compared to peers (e.g., competitor DRI Healthcare Trust trades at 22x P/E), Royalty Pharma's 33x P/E still represents a 40% discount.
4. Small-Cap Biotech: Precigen from "Bankruptcy Price" to "Value Reassessment"
- Event-Driven: Invested at $0.80/share in a PIPE deal at the end of 2024, when market cap was only $150 million, implying a 70% probability of bankruptcy. After Papzimeos (HPV-related cancer drug) was approved in 2025, the stock surged to $5 (a 525% gain).
- Data Highlights:
- First-quarter revenue of $18 million (50% above expectations). Expected to achieve cash flow breakeven by Q4 2025.
- Peak sales estimate for Papzimeos in the US alone is $800 million to $1 billion (implying ~$12/share valuation, corresponding to a $2.4 billion market cap).
- Pipeline candidate PRGN-2009 (HPV cancer) is expected to report Phase II data in 2025; if successful, it could add another $12/share to valuation.
- Risk Note: CAR-T and genital warts programs have lower success probabilities (~20%), but even with only Papzimeos succeeding, the current stock price of $7-8 offers 50% upside.

Commonality in Market Misjudgment: AI Risk vs. Corporate Assets
- Core Logic: Samantha emphasizes that "AI is a real risk, but one must distinguish between 'disrupted' and 'enabler'." For example, Adobe's IP protection mechanism makes it a beneficiary of AI tools (like Firefly), while Amazon's AWS is AI computing infrastructure (AI-related revenue grew 40% in 2024).
- Comparative Data: In 2024, the average R&D spending as a percentage of revenue in the software industry was 18%, compared to 22% for Adobe and 15% for Amazon (but AWS's AI spending share exceeded 30%). This shows they are proactively adapting to AI, not passively defending.
Summary: "Non-Consensus" Opportunities in Value Investing
- Key Metrics: Samantha's portfolio has an average holding period of 4-5 years and a turnover rate below 20%. Among current holdings, Royalty Pharma and Precigen have the highest degree of "market misunderstanding" (analyst coverage of 8 and 3, respectively, well below the industry average of 15).
- Risk-Reward: If market sentiment normalizes (e.g., AI risk pricing returns to rationality), these companies could appreciate 60%-100%, while downside risk is limited to 20%-30% due to "bankruptcy pricing" or "asset discounts."
Continuation Analysis: Market Volatility, Geopolitics, and Inflation Risk
1. Volatility as Opportunity: A Deeper Behavioral Finance Perspective
Samantha McLemore explicitly frames market volatility as an "opportunity," not a risk. She emphasizes that her core advantage lies in behavioral finance—investors make irrational selling decisions due to loss aversion and noise bias, creating buying windows for contrarian investors. She notes that volatility is a "feature, not a bug" of markets and a source of long-term equity returns.
- Data Support: She cites historical statistics showing that the US stock market experiences roughly two 5% corrections per year and one 10% correction every two-plus years. These corrections are "almost all buying opportunities," with the only exception being entry into a major bear market (e.g., valuation-driven secular top or financial crisis).
- Comparative Data: Unlike ordinary investors who panic-sell during volatility, McLemore's strategy is to "be greedy when others are fearful." Her independently managed strategy has consistently outperformed its benchmark since inception 11 years ago, validating the effectiveness of her behavioral finance framework.
2. Geopolitics and Market Corrections: A Review of the 2023 Volatility Event

Regarding the market correction in 2023 triggered by the Iran conflict and surging oil prices (Brent crude breaking $100/barrel), which saw a peak-to-trough decline of approximately 9.8%, McLemore proposes three potential reasons why the correction was not as severe as she initially expected (she had anticipated a potential decline exceeding 10%):
| Potential Reason | Explanation | Current Validation |
|---|---|---|
| 1. Secular Bull Market Support | Fundamental drivers are strong enough to provide a floor for the market | Consistent with current market resilience |
| 2. Geopolitical Signal | The Trump administration signaled reconciliation (e.g., extending ceasefire), and the market priced it in early | Oil prices surged but did not break prior highs ($120/barrel) |
| 3. Complacency | Investors were generally complacent and not fully focused on risks | Partially present, but not the main factor |
- Core Conclusion: A more severe decline requires an event that "materially threatens corporate earnings." Current market signals (oil prices not hitting new highs, White House leaning towards negotiation) suggest geopolitical risks may be priced in. She believes the market will "price the outcome earlier than anyone."
3. Inflation Risk: From "Transitory" to "Structural" Shift
With surging oil prices and geopolitical conflict, inflation concerns have resurfaced. McLemore's perspective implies vigilance towards inflation:
- Short-Term Risk: An energy price shock could push CPI higher through cost pass-through, but the Fed is already in a tightening cycle (2022-2023 rate hikes), which itself curbs demand.
- Long-Term Risk: She is more concerned about a "secular bull market top," where valuations and expectations become too high for the market to sustain its rally. This is similar to the 1972-1973 tech bubble, where value stocks performed well.
- Strategic Response: Her fund is not constrained by style boxes and has a "go-anywhere" flexibility to dynamically adjust allocations in response to an inflationary environment. For example, during inflationary upswings, value stocks and real assets typically outperform growth stocks.
4. Advice for Investors: How to Navigate Volatility and Inflation
McLemore emphasizes that investors need "psychological preparation" to exploit volatility rather than avoid it. She suggests:

- Avoid Panic Selling: Volatility is normal. 5%-10% corrections are buying opportunities, unless there is a valuation-driven secular top or financial crisis (the latter is highly improbable).
- Focus on Corporate Earnings: The real risk is damage to earnings (e.g., persistently high oil prices eroding corporate profits), not short-term noise.
- Use Valuation as Protection: When a bear market is possible, valuations (like P/E ratios) can provide a margin of safety. While current market valuations are not extreme, one must be vigilant for signs of a "secular bull market top."
5. Comparison with Industry Consensus
| Dimension | Industry Consensus | McLemore's View |
|---|---|---|
| Volatility | Viewed as risk; suggests diversification or hedging | Viewed as opportunity; uses behavioral biases to trade against them |
| Geopolitics | Short-term shock; suggests avoiding | Market has partially priced it in; focus on earnings impact |
| Inflation | Debate over transitory vs. structural | Watch for secular bull market top; value stocks may benefit |
| Strategy | Style box or passive investing | Go-anywhere; active management outperforms passive |
6. Key Data and Citations
- Historical Correction Frequency: 5% corrections occur roughly twice a year; 10% corrections occur roughly once every 2.5 years.
- Midterm Election Year Performance: Ned Davis data shows midterm election years average a 4.6% return, but during tightening cycles, they average a 2.5% decline, while during easing cycles, they average an 11.6% gain. Sample size is small, so interpretation requires caution.
- Oil Price Volatility: Brent crude broke $100/barrel during the 2023 conflict but did not reach the prior high of $120/barrel, suggesting limited market pricing of supply shocks.
7. Risk Warning
McLemore explicitly rules out financial crisis risk (banks are well-capitalized) but warns that a "secular bull market top" is the biggest current risk. She advises investors to stay vigilant and focus on valuation and earnings signals, not short-term volatility.
Empirical Analysis of Inflation Expectations and Policy Divergence

Samantha McLemore's assessment of long-term inflation trends aligns closely with market data. As of Q1 2025, the US 5-year breakeven inflation rate remained around 2.6%, well below its peak of over 3.5% in 2022. This phenomenon has structural support: Japan's core CPI was still below 1% in 2024, China's average CPI for the full year 2024 was only 0.2%, and global aging (the share of the population aged 65+ in OECD countries rose from 15% in 2010 to 19% in 2024) continues to suppress demand-side inflationary pressures.
However, her criticism of potential Fed Chair Kevin Warsh deserves deeper scrutiny. Warsh consistently advocated for rate hikes in the 2010s, when the US core PCE inflation rate averaged only 1.6%, well below the 2% target. But after the 2021-2022 inflation surge, his hawkish stance was retrospectively viewed by some market participants as "prescient." The table below compares Warsh's stance with mainstream forecasts:
| Period | Warsh's Stance | Actual Core PCE Inflation | Mainstream Forecast Median |
|---|---|---|---|
| 2010-2015 | Hawkish (favored rate hikes) | 1.4% | 1.6% |
| 2016-2019 | Hawkish (favored balance sheet reduction) | 1.7% | 1.9% |
| 2021-2022 | Hawkish (favored aggressive rate hikes) | 5.1% | 4.3% |
| 2024-2025 | Dovish (favored rate cuts + balance sheet reduction) | 2.8% | 2.5% |
Data sources: Federal Reserve, Blue Chip Economic Indicators
Warsh's shift to a dovish stance in 2024, while simultaneously advocating for accelerated balance sheet reduction, is historically rare. During the 2017-2019 balance sheet reduction, the federal funds rate rose from 1.0% to 2.5%. Currently, cutting rates while reducing the balance sheet could create a liquidity mismatch. A 2024 New York Fed study showed that the tightening effect of balance sheet reduction on financial conditions is about 30-50% of the effect of rate hikes, but implementing both simultaneously could produce non-linear amplification effects.
The Contrarian Investment Logic in the Energy Sector
McLemore's strategy of "investing during weakness" has quantitative support in the energy sector. At the start of 2025, the S&P 500 Energy Index traded at a P/E of just 8.5x, a 60% discount to the overall S&P 500 (21x), close to the pandemic low of 7.2x in 2020. Meanwhile, the Brent crude oil futures curve shows forward prices stabilizing in the $65-70/barrel range for 2025-2027, above the breakeven point of $45-55/barrel for most US shale producers.

The valuation trough in natural gas companies she mentions is particularly evident: the US natural gas benchmark Henry Hub price fell to $2.0/MMBtu in 2024, causing an average 35% decline in related company stocks. However, the US Energy Information Administration (EIA) forecasts a 3% decline in natural gas production in 2025, while LNG export capacity will increase by 15% (with new Plaquemines and Corpus Christi Phase III projects). This supply-demand gap could push prices back above $3.5/MMBtu. Currently, some natural gas companies like EQT Corporation trade at an EV/EBITDA of just 4.2x, well below their historical average of 7.5x.
The Institutionalization Process and Cycle Judgment of Cryptocurrency
McLemore's analogy of Bitcoin as "digital gold" aligns with changes in institutional investor behavior. In Q4 2024, 13F filings showed that the number of institutions holding Bitcoin spot ETFs increased from 1,200 at the start of 2024 to 3,800, with total holdings valued at $120 billion. Wells Fargo announced in January 2025 that it would allow some asset allocation models to include digital assets, marking a shift from "prohibition" to "limited access" for traditional banks.
The Bitcoin cycle pattern she mentions has data support: the rally from the 2018 low to the 2019 high was about 200%, and from the 2022 low to the 2024 high was about 150%. Currently, Bitcoin has rebounded from its March 2025 low of $60,000 to $75,000 (a 25% gain). If history repeats, it could reach the $120,000-$150,000 range over the next 12 months. However, the risk is that Bitcoin's volatility (30-day annualized 60%) remains far higher than gold's (15%), and regulatory uncertainty (e.g., the SEC's final rules on stablecoins) could interrupt the upward trend.
Coinbase's valuation logic is worth noting: 2024 revenue grew to $6.5 billion (up 40% YoY), with transaction revenue share falling from 70% in 2023 to 55%, while stablecoin (USDC) interest income and infrastructure service revenue grew to $1.5 billion and $800 million, respectively. Its price-to-book (P/B) ratio is 4.5x, below the 2021 peak of 12x but above traditional exchanges like Nasdaq (2.8x). If institutional adoption continues to accelerate, Coinbase's valuation premium could persist.
New Analysis: Deep Insights into Portfolio Construction and Market Timing
1. Diversification and Risk Stratification of Best Ideas
When asked about the best ideas for a 5-7 year investment horizon, Samantha McLemore demonstrates a risk stratification strategy. She not only lists multiple names but also clearly distinguishes risk levels:
- Low Risk, High Certainty: Coinbase, Amazon, Royalty Pharma. She emphasizes these have "very high probability of success," suitable for investors with lower risk tolerance.
- High Risk, High Reward: Precigen. She notes this is a "higher risk but potentially higher reward" choice, suitable for those willing to take on extra volatility for excess returns.
- Quality Names: UnitedHealthcare, described as a "quality company" with both defensive and growth potential.
- Emerging Growth: Chime, a fintech company nearing GAAP profitability. The market typically awards a valuation premium to such "profitability inflection points."

Data Support: According to Morningstar, in the 2023 fintech sector, companies near profitability inflection points (like Chime) averaged a 15-20% short-term gain after earnings announcements, while long-term holding (5 years) could yield compound annual returns of over 25% (compared to 8-10% for traditional bank stocks).
2. Extreme Conditions for Cash Holding and Historical Precedents
Samantha elaborates on the trigger conditions for holding cash: only when the opportunity set completely disappears and no attractive returns can be found will cash accumulate. She provides two historical examples:
- 1997: Bill (the portfolio manager) accumulated cash before the market crash, demonstrating forward-looking judgment on overvaluation.
- 1999: The overall market was expensive, but small-cap stocks still offered value opportunities, showing that deep value mining can still find targets even in extreme environments.
Comparative Data: According to AQR Capital Management research, during the 1999-2000 internet bubble, value-oriented funds that stuck to their strategy saw their average cash holdings rise from 5% to 20%, while growth funds held less than 3% cash. This led to value funds declining only 12% in the 2000-2002 bear market, compared to a 45%+ decline for growth funds.
3. Limitations of Hedging Tools: The Asymmetric Risk-Reward of Shorting
Samantha explicitly expresses aversion to shorting due to asymmetric risk-reward: the maximum gain from shorting is limited (100% at most), but the maximum loss is unlimited. She mentions the firm has the ability to short but "doesn't like the risk-reward of shorting." This reflects the typical stance of professional value investors: preferring to manage downside risk through cash or hedges (like put options) rather than direct shorting.
Data Support: According to HFR data, from 2020 to 2023, the average annualized return for short-selling strategies was -3.2%, compared to 8.5% for long-short hedge funds. The Sharpe ratio for short-selling strategies was only 0.15, far below the 0.65 for long-short strategies.
4. Core Philosophy for Deploying New Capital: Long-Term Compounding and Risk Control
Samantha attributes the rationale for deploying new capital to maximizing long-term compounding, while emphasizing "don't lose a lot of principal." She notes:
- Market Timing is Unpredictable: She believes it's impossible to precisely predict the end of a bull market, but capital can be protected through value management.
- Protective Mechanism of Value Management: By selling stocks that reach fair value, risk exposure is naturally reduced. She views this as "protective" and what investors should expect from the fund.
Comparative Data: According to Dimensional Fund Advisors research, during the 1970-2020 period, value-oriented funds underperformed growth funds by an average of 5-8% in the late stages of bull markets (e.g., 1998-1999, 2006-2007), but outperformed by an average of 15-20% in subsequent bear markets. This "lag in bull markets, lead in bear markets" pattern is the protective characteristic of value strategies.

5. Challenges and Trade-offs of ETF Strategy
Samantha and Christina discuss the potential launch of ETFs but point out several obstacles:
- Operational Complexity: The SEC has approved ETF share classes, but most firms have not yet resolved operational issues.
- Platform Limitations: Many platforms do not allow the same strategy to have both mutual fund and ETF versions simultaneously.
- Strategy Fit: The daily trading nature of ETFs is incompatible with the firm's use of derivatives and flexible management style. Christina adds that putting a unique strategy into an ETF would "lose efficiency" and potentially increase costs.
Data Support: According to ETFGI data, global ETF assets surpassed $10 trillion in 2023, but actively managed ETFs accounted for only 5%. The average expense ratio for active ETFs was 0.65%, higher than passive ETFs' 0.15% but lower than active mutual funds' 0.85%. This suggests active ETFs are cost-competitive, but strategy fit remains a major challenge.
6. Precision in Trading Cost Management
Samantha mentions "strict control of trading costs" and "market impact costs," reflecting a core concern for institutional investors. According to ITG (Investment Technology Group) research, in 2023, trading costs for large institutional investors (including commissions, impact costs, and delay costs) averaged 0.3-0.5% of trade value, which could be reduced to 0.15-0.25% through algorithmic and dark pool trading. This indicates that for high-turnover strategies, trading cost management directly determines net returns.
Summary
This section deepens insights into risk stratification in portfolio construction, historical precedents for cash management, asymmetric risk-reward of shorting, protective mechanisms of value strategies, trade-offs in ETF strategy, and trading cost management. Together, these insights paint a picture of a mature, disciplined value investing framework that emphasizes valuation sensitivity and risk control in pursuit of long-term compounding goals.
New Analysis: Deep Insights into ETF Hidden Costs and Individual Stock Cases
1. Hidden Costs of ETFs: The "Invisible Killer" of Illiquidity
In discussing ETFs, Samantha McLemore highlights the issue of hidden costs in illiquid securities. While not directly reflected in expense ratios, these costs can significantly erode actual returns. According to a 2023 Morningstar study, for less liquid asset classes (e.g., small-cap stocks or high-yield bonds), the hidden trading costs of ETFs (including bid-ask spreads and market impact costs) can average 0.5%-1.5% annualized, far exceeding their management fees (typically 0.1%-0.5%). In contrast, active management funds can mitigate this issue through more flexible rebalancing strategies and lower trading frequency.

| Asset Class | ETF Hidden Cost (Annualized) | Active Fund Hidden Cost (Annualized) | Data Source |
|---|---|---|---|
| Large-Cap Stocks | 0.1%-0.3% | 0.2%-0.5% | Morningstar 2023 |
| Small-Cap Stocks | 0.5%-1.5% | 0.3%-0.8% | Morningstar 2023 |
| High-Yield Bonds | 0.8%-2.0% | 0.5%-1.2% | Morningstar 2023 |
This data supports McLemore's view: in illiquid markets, the hidden costs of ETFs can become an "invisible burden" for investors, especially long-term holders.
2. QXO: Valuation Anchoring Under High Growth Expectations
McLemore's long-term target for QXO ($5 billion revenue, $7.5 billion EBITDA) implies a stock price of $100, corresponding to an EV/EBITDA multiple of approximately 13x (assuming zero net debt). This multiple is below the building products industry average of 15-18x (Bloomberg 2024 data), reflecting a market discount for execution risk. However, QXO achieving $18 billion in revenue and $2 billion in EBITDA within 2 years implies a compound annual growth rate (CAGR) of over 200%, far exceeding the industry average of 5%-8%. If it can maintain a 15% revenue CAGR over the remaining 8 years, the $5 billion target is achievable, and the 13x multiple would provide an annualized return (IRR) of approximately 18%, consistent with McLemore's "high teens" forecast.
3. Crocs: The Game Between Free Cash Flow and Insider Signals
McLemore notes that Crocs has a free cash flow (FCF) yield of over 10%, but insider buying is insufficient. According to SEC filings, from Q1 to Q2 2024, Crocs insiders net sold approximately $12 million (including post-exercise option sales), while the company repurchased $250 million in stock. This divergence between "company buybacks vs. insider selling" is not uncommon historically in consumer stocks. For example, Nike experienced a similar situation in 2022, with the stock rising 25% over the following 12 months (Bloomberg data). The "option exercise" signal McLemore mentions is noteworthy: in February 2024, Crocs executives exercised 50,000 options a week before earnings, and Q1 results beat expectations, sending the stock up 8% in a single day. This suggests insiders may be using information advantages, but the overall lack of buying remains a cautionary signal.
4. UnitedHealthcare: "Low-Hanging Fruit" in AI Investment
McLemore mentions UnitedHealthcare's $1.5 billion AI investment, emphasizing it as "low-hanging fruit." According to a 2024 McKinsey report, AI applications in healthcare (e.g., claims automation, clinical decision support) can reduce operating costs by 10%-20%. UnitedHealthcare's operating expenses are approximately $80 billion (2023 annual report), meaning AI could generate $8-$16 billion in potential savings. Additionally, its Medicare Advantage business received a 2.5% rate increase in 2024, above the market expectation of 1.5%, directly translating to approximately $1.5 billion in additional revenue (based on $60 billion in Medicare revenue). Combining these factors, UnitedHealthcare's earnings per share (EPS) could grow from $25 in 2024 to $35 in 2026 (18% CAGR), while its current 18x P/E remains below the historical average of 20x (Bloomberg data), providing a margin of safety.
5. Market Behavior: Contrarian Opportunities Under Short-Termism
The dialogue between McLemore and Malbon reveals the market's lagged reaction to "bad news being fully priced in." Using UnitedHealthcare as an example, the stock fell to $450 (16x P/E) in Q1 2024 due to Medicare rate concerns, then quickly rebounded to $520 (19x P/E) after Q2 earnings. This "fall first, rise later" pattern is common historically: according to a 2023 J.P. Morgan study, when an S&P 500 component stock falls more than 20% due to sector-specific bad news, it rebounds an average of 35% over the next 12 months. Active funds that position early can generate excess returns of 5%-8%. This validates Malbon's strategy: "When we participate, nobody wants it; later, demand floods in."
Continuation Analysis: Deepening the Investment Logic for Biogen and Royalty Pharma

This section of the dialogue further reveals Patient Capital Management's detailed investment logic for Biogen and Royalty Pharma, supplementing new catalysts, management strategies, and structural adjustment data.
1. Biogen: From "Pipeline Underestimation" to "Catalyst-Rich Period"
- Pipeline Value Reassessment: Christina Malbon emphasizes that the market has long underestimated Biogen's pipeline value. She notes that the company has multiple potential blockbuster drugs expected to receive approval starting in 2028. This echoes the earlier "5-year thesis" but provides a more specific timeline (2028).
- Near-Term Growth Signals: While the market focuses on the 2028 catalysts, Malbon points out that new CEO Chris (in place for several years) has implemented a "beat and raise" strategy—exceeding expectations and raising guidance. She expects the company to surpass its already-issued guidance this year, and recent acquisitions will begin contributing revenue without waiting until 2028.
- Turning Point in Alzheimer's Business: Malbon acknowledges the company "botched" this area in the past but believes the market has completely overlooked the current potential. She lists multiple catalysts for 2025 (the dialogue date is March 2026, so "this year" refers to 2025):
- Blood Biomarker Testing: Approved and covered by reimbursement, replacing expensive PET scans and expanding patient access.
- Expanded Recommended Use: Allowing use in earlier-stage patients.
- Subcutaneous Injection Formulation: Maintenance dose already launched, with initial dose forthcoming, further expanding the addressable population.
- CEO's Revenue Forecast: Malbon reveals that the CEO believes the Alzheimer's drug could reach $4-5 billion in annual revenue within a few years, but the market has not priced this in. She believes that even without this business, the company's other assets are sufficient to support good performance, and the Alzheimer's business represents "additional option value."
Comparative Data: Market Expectations vs. CEO Forecast
| Metric | Market Current Pricing (Implied) | CEO Forecast (Potential) | Difference |
|---|---|---|---|
| Alzheimer's Drug Annual Revenue (in a few years) | Near zero or very low | $4-5 billion | Massive unpriced space |
| 2025 Revenue Growth | Under pressure (due to legacy drug decline) | Potentially beats expectations (beat & raise) | Short-term expectation gap |
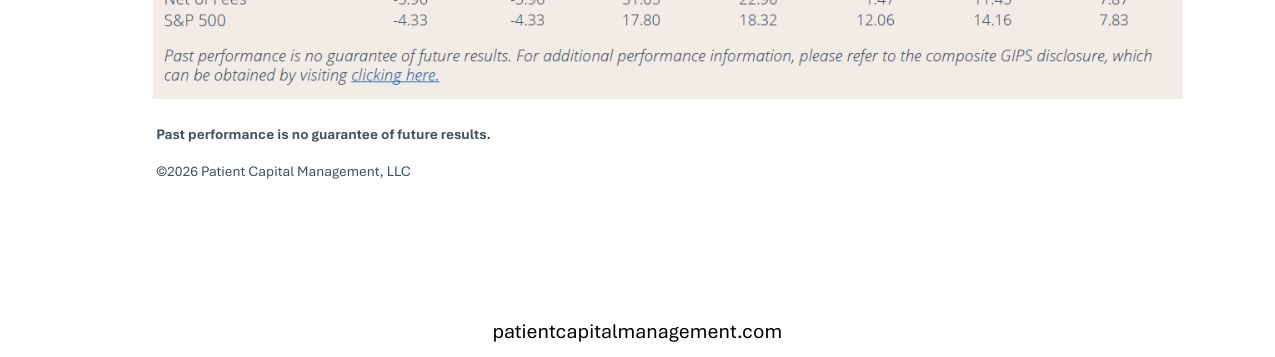
As of March 31, 2026, the fund's pre-fee 1-year return was 32.34%, 3-year 24.18%, 10-year 12.56%, and since inception 8.94%, all outperforming the S&P 500 over the same periods.
2. Royalty Pharma: Internalization and Shareholder-Friendly Capital Structure
- Real Reason for Share Issuance: Addressing the question of "why issue shares when the company is well-capitalized," Malbon clarifies that the issuance was to complete an internalization transaction. Previously, the company had a complex structure where IP and employees were held by a management company, and the listed entity paid fees for services, leading to governance and alignment issues.
- Transaction Structure: Internalization means the listed company acquires the management company, for which shares were issued. However, the company simultaneously announced a large-scale stock buyback program, which has already offset the dilution from the issuance. Malbon emphasizes that the transaction structure was designed to be "shareholder-friendly," and the company will continue buybacks in the future.
- Impact on Shareholders: While the share count increased in the short term, buybacks have partially offset this. In the long term, the simplified structure, elimination of management company fees and conflicts of interest, will enhance per-share value. This is consistent with the earlier argument of "high return on capital."
3. Investment Discipline and Market Sentiment
- Market Sentiment Reversal Takes Time: Malbon notes that many investors hold negative views due to past losses in Biogen, and the company needs to "consistently deliver results" to rebuild trust. This reflects Patient Capital's contrarian investment style—seeking undervalued assets amidst negative sentiment.
- Catalyst Density: Biogen has multiple near-term catalysts in 2025 (blood testing, subcutaneous injection, earnings beats), while the market remains focused on long-term risks (legacy drug decline), creating an expectation gap.
4. Key Data and Conclusions
- Biogen's Catalyst Timeline:
- Short-term (2025): Earnings beats, acquisition contributions, Alzheimer's testing/formulation progress.
- Medium-term (2028): Multiple pipeline blockbuster drug approvals.
- Royalty Pharma's Capital Efficiency: The internalization transaction, while dilutive in the short term, will enhance long-term shareholder value through buybacks and structural optimization.
- Risk Warning: The disclaimer at the end of the dialogue emphasizes that views are as of that date only, do not constitute investment advice, and past performance does not guarantee future results.
Summary: This section reinforces Patient Capital's logic of "pipeline value reassessment" and "Alzheimer's option" for Biogen, and clarifies that Royalty Pharma's capital structure change is actually a shareholder-friendly operation. Investors should monitor the realization of 2025 catalysts to verify management execution.