The More Things Change, The More They Stay The Same
Patient Capital Management is a Baltimore asset manager founded in 2020 by Samantha McLemore, CFA — Bill Miller's long-time co-manager (working together since 2002, running the flagship Opportunity Equity strategy since 2014). Continuing the Miller-school contrarian tradition, it practices "time arbitrage": exploiting behavioral mispricing to concentrate in controversial growth names (tech, healthcare, Bitcoin-related) at deep discounts to intrinsic value. Its site preserves Bill Miller's complete 1995-2022 market letters, alongside ongoing quarterly letters and webinars.
In plain words
This report says the U.S. stock market has risen for three straight years and now trades at a high price relative to earnings (price-to-earnings ratio). Historically, when stocks are this expensive, future returns tend to be lower—maybe 5% a year instead of 10%+. But a bear market isn't the most likely outcome. For ordinary investors, it means lowering expectations, not panicking. The key is to focus on companies with real earnings growth. Worth reading because it uses data to show what high valuations really mean for your portfolio.
Patient Capital research notes that the long-term bull market that began in March 2009 has entered its later stages, but historical data shows this phase often delivers the strongest returns. In 2025, the S&P 500 returned 17.9%, while the Patient Opportunity Equity Strategy outperformed the benchmar
Theme and Background
This chapter discusses that the long-term bull market that began in March 2009 has entered its later stage, but historical data shows this phase often delivers the strongest returns. The author argues that market expectations have risen alongside price increases, and high valuations imply lower future returns, though negative five-year returns are not the base case.
Core Views
- Late-stage bull market, but still strong return potential: The author judges the market to be in the late stage of a long-term bull market, yet historical data indicates this phase offers the strongest returns. In 2025, the S&P 500 returned 17.9%, and the Patient Opportunity Equity Strategy outperformed the benchmark by 820 basis points.
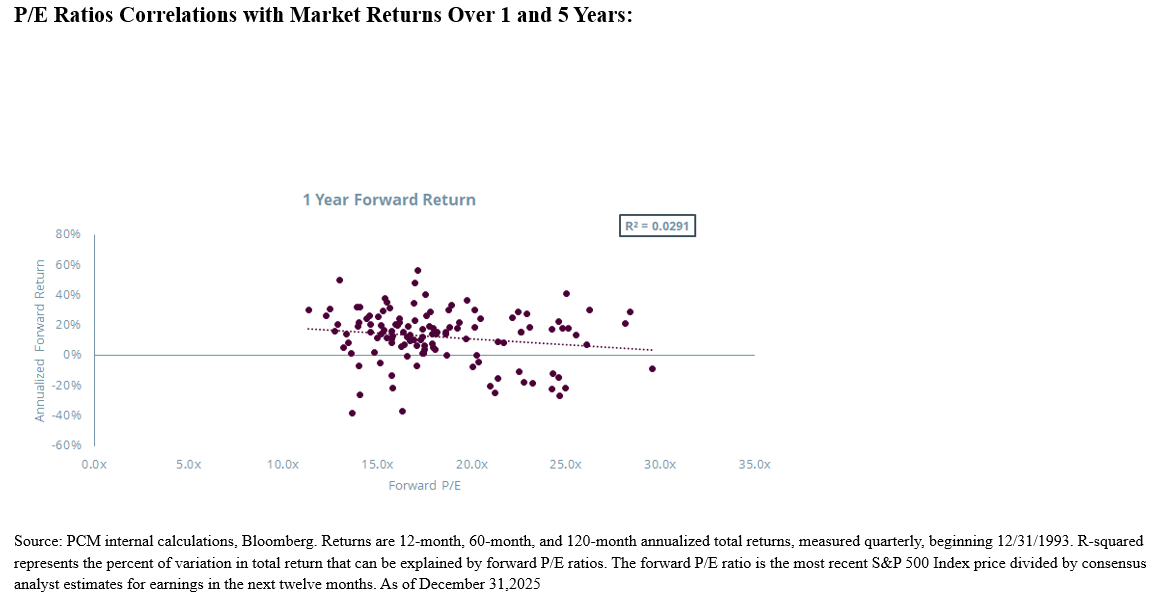
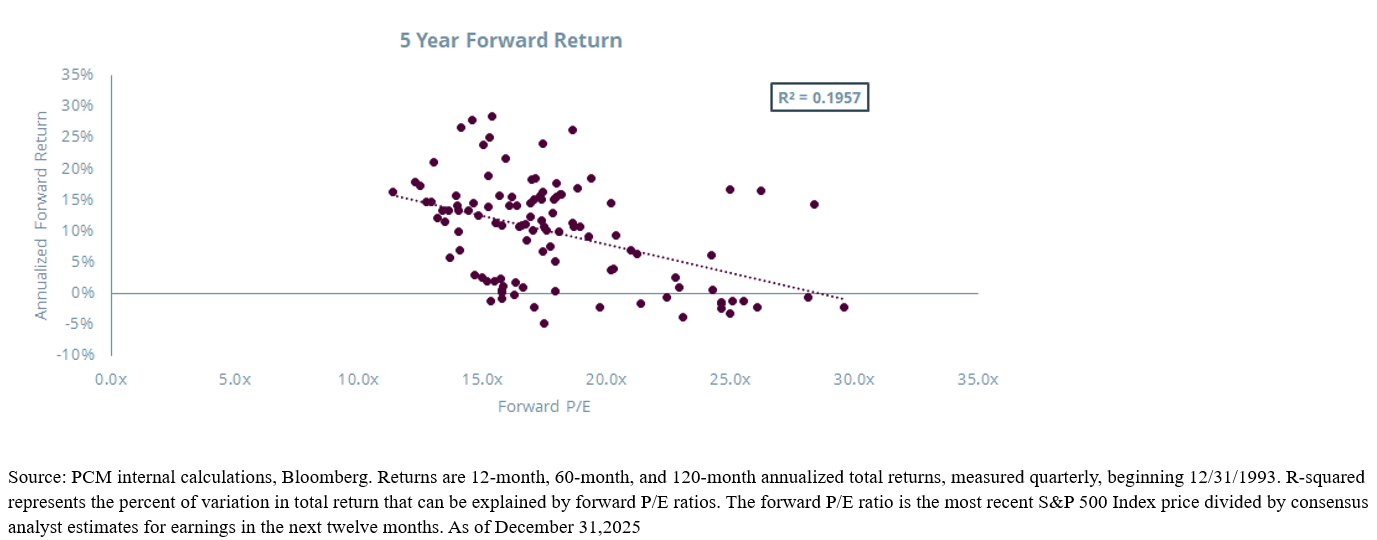
- High valuations imply lower future returns, but not a bear market: The S&P 500 trades at 22 times forward 2026 earnings, a historically high level. The negative correlation between valuations and future returns strengthens over time (4% over 1 year, 26% over 5 years, 75% over 10 years), but negative five-year returns are not the base case.
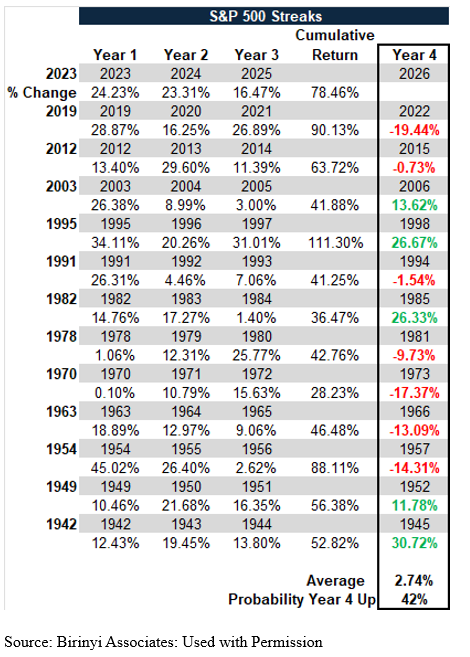
- Contrarian stance against market consensus: Despite widespread optimism (the Barron's Roundtable turned bullish on U.S. stocks for the first time), the author believes high expectations create risk. After three consecutive years of gains, the probability of a fourth year of gains is only 42%, but the average return in such years is +11%.
Key Arguments and Data
Market Performance and Strategy Results
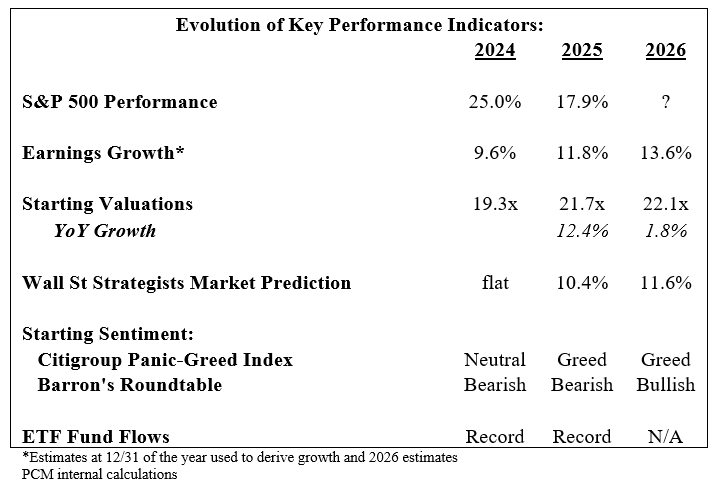
- The S&P 500 returned 17.9% in 2025, following two consecutive years of over 25% gains in 2023 and 2024.
- The Patient Opportunity Equity Strategy returned 26.1% in 2025, outperforming the benchmark by 820 basis points; its three-year compound annual growth rate was 29.5% versus the S&P 500's 23.0%, marking the second-best three-year performance in the strategy's history.
- 73% of actively managed equity funds underperformed their benchmarks, the fourth-worst showing since 2007.
Corporate Earnings Growth
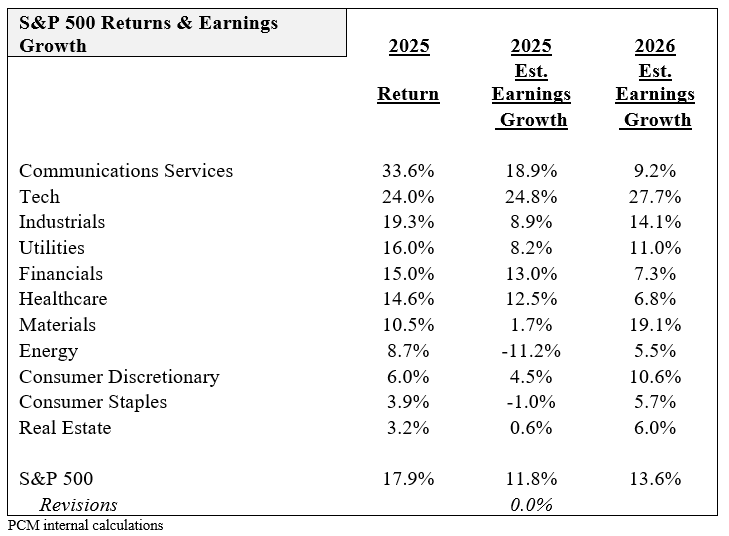
- Earnings grew +9.6% in 2024 and +11.8% in 2025, both exceeding expectations.
- In the first three quarters of 2025, earnings growth averaged 6 percentage points above consensus estimates.
- Technology (+25%) and communication services (+19%) contributed the most, while healthcare and financials also posted double-digit growth.
- Consensus expects 2026 growth to accelerate to 13.6%, which the author believes will be harder to surpass.
Valuation and Historical Comparison
- The S&P 500 trades at 22 times forward 2026 earnings, a historically high level.
- After three consecutive years of gains, the probability of a fourth year of gains is 42% (below the 70% annual baseline), but the average return in up years is +11%.
- The late-1990s internet bubble is the most comparable period: in 1998 (the fourth year of gains), the market rose 26.7%, but the subsequent five-year return was negative (only slightly negative), while the ten-year return was nearly 6% per year.
Correlation Between Valuation and Returns
| Time Horizon | Correlation Between Valuation and Returns |
|---|---|
| 1 Year | 4% |
| 5 Years | 26% |
| 10 Years | 75% |
|---|
Future Scenario Analysis
- If earnings continue to grow at double-digit rates and valuations return to historical peaks, the market could continue to deliver double-digit returns.
- If valuations stabilize and earnings grow at 9.1% (the late-1990s level), market returns would be approximately 8.9%.
- If earnings grow at 6.6% (the long-term average), market returns would be approximately 6.4%.
- T. Rowe Price's five-year forward IRR model estimates a return of 6.8%.
Companies/Assets Involved
- Nvidia (NVDA): Accounts for 20% of the index's 2026 earnings growth; bullish (strong AI outlook).
- Microsoft (MSFT), Broadcom (AVGO), Apple (AAPL), Meta (META), Amazon (AMZN), Micron (MU): Together account for over 40% of the index's 2026 earnings growth; bullish (technology outlook remains strong).
- Amazon (AMZN): Underperformed in 2025; the author expects strong performance in 2026.
- QXO (QXO): Expected to execute its next transaction, accelerating the build-out of a $50 billion building materials company.
- Citigroup (C): Transformation continues, with further upside potential.
- UnitedHealthcare (UNH): Improvement should accelerate this year.
- Royalty Pharma (RPRX), Norwegian Cruise Lines (NCLH): Remain favored holdings for the author.
- Coinbase (COIN), Crocs (CROX): Recently added to positions; considered particularly attractive.
- Portfolio Concentration: The top ten holdings account for approximately 50% of the portfolio, and the top twenty account for approximately 80%.
Investment Implications
- Lower return expectations, but no need for pessimism: High valuations imply that returns over the next 5–10 years may be below historical averages (approximately 6–9%), but the probability of negative five-year returns is low. Investors should accept mid-to-low single-digit return expectations.
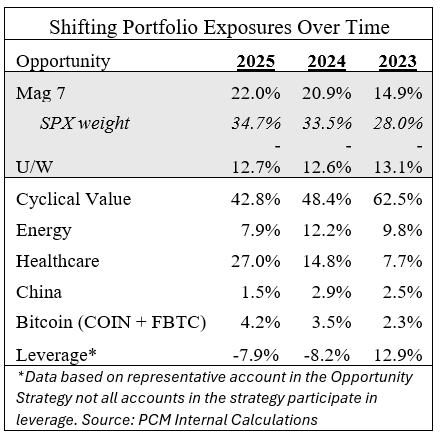
- Focus on value and defense: When valuations normalize, the reward for taking risk diminishes. The author has reduced cyclical exposure and leverage while increasing healthcare holdings (at a 50-year relative valuation low) to enhance portfolio resilience.
- Focus on earnings growth: Future market performance is highly dependent on whether corporate earnings can sustain double-digit growth. AI and technology remain core drivers, but the risk of overly high expectations must be monitored.
- Stick to contrarian investing: Current market sentiment is highly optimistic, but the author believes low expectations are a good starting point. Investors should focus on opportunities where price and intrinsic value diverge, rather than chasing hot trends.
Theme and Background
This chapter focuses on a comparison between current valuation levels of the U.S. stock market and historical cycles. The report notes that the S&P 500 delivered a return exceeding 17% for the third consecutive year in 2025, but valuations are at historically high levels (22x forward P/E), and historical performance in the fourth year following consecutive gains is not optimistic. By analyzing multiple historical valuation ranges and return cycles, the author concludes that the current market is most comparable to the late 1990s internet bubble period.
Core Thesis
The author's core judgment is: Current high valuations imply that expected returns over the next 5–10 years will be significantly below historical averages, but negative returns are not the base case. Counterintuitively, despite three consecutive years of strong market gains, the author believes this is not a precursor to a bubble burst, but rather an entry into a "return compression" phase—where future returns may be positive but limited in magnitude.
Key Arguments and Data
1. Historical Performance After Consecutive Gains: Since 1928, after the S&P 500 has risen for three consecutive years, the probability of a fourth-year gain is only 42%, with an average return of +11%. However, the author emphasizes that the current environment (low interest rates, AI technology-driven) is similar to the late 1990s, not a typical cycle.
2. Relationship Between Valuation and Future Returns:
- The current 22x forward P/E is at the 92nd percentile historically.
- Historically, when the P/E is in the 20–25x range, the median annualized return over the next 5 years is +5.3%, and over 10 years is +6.1%.
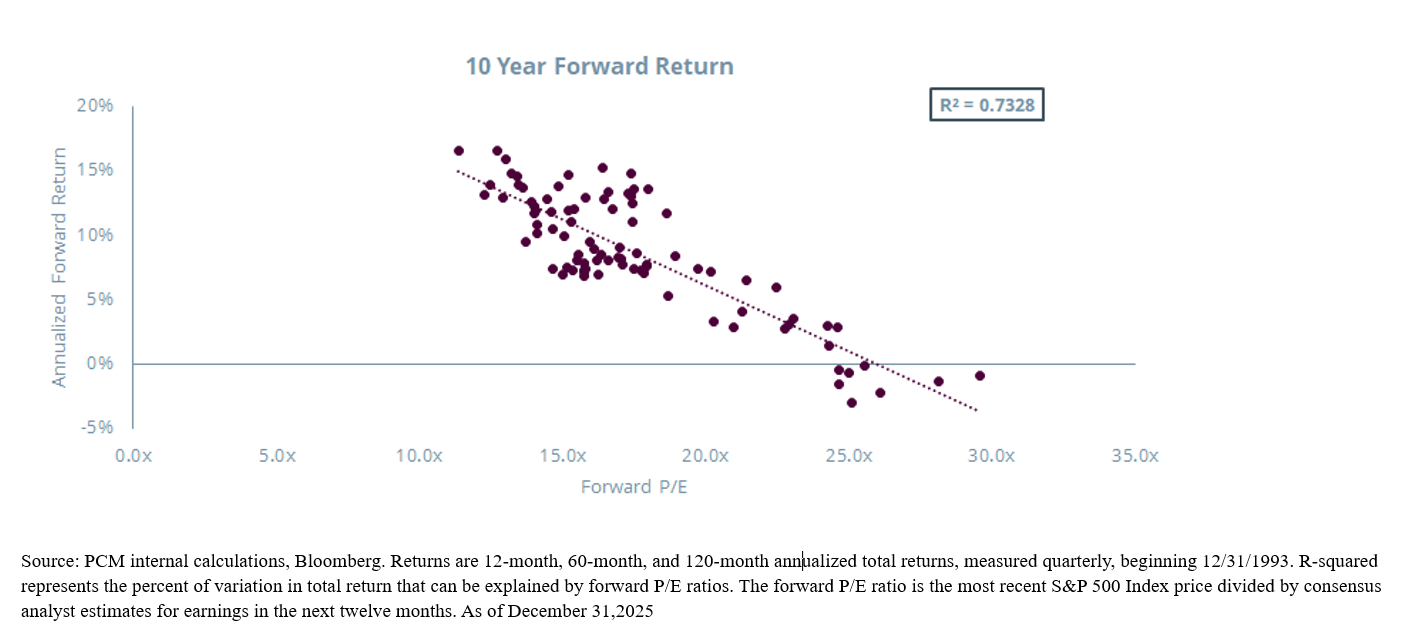
- When the P/E exceeds 25x, the median annualized return over the next 5 years drops to +2.1%, and over 10 years to +3.7%.
3. Extreme Scenario Comparison:
- If the P/E contracts from 22x to 17x (historical average), the annualized return over the next 5 years would be -0.5%.
- If the P/E expands to 30x (similar to a bubble period), the annualized return over the next 5 years could reach +10.5%.
| P/E Range | Median 5-Year Annualized Return | Median 10-Year Annualized Return |
|---|
| 20–25x (Current) | +5.3% | +6.1% |
|---|---|---|
| Above 25x | +2.1% | +3.7% |
| Contraction to 17x | -0.5% | +1.2% |
| Expansion to 30x | +10.5% | +8.9% |
4. Portfolio Exposure: The report shows that the Patient Opportunity Equity Strategy has 38% and 12% allocations to the Technology and Communication Services sectors, respectively, totaling 50%, compared to the S&P 500's 42% (Technology 32% + Communication Services 10%). This indicates a significant overweight in high-valuation growth sectors for this strategy.
Companies/Assets Involved
- S&P 500 Index: As the benchmark, currently at 22x forward P/E, with three consecutive years of returns exceeding 17%.
- Patient Opportunity Equity Strategy: Overweight in Technology (38%) and Communication Services (12%), totaling 50% of the portfolio, versus the benchmark's 42%. The author believes this strategy addresses the high-valuation environment through stock selection (where price diverges from intrinsic value).
Investment Implications
- Lower Return Expectations: Investors should accept that annualized returns over the next 5–10 years may fall to around +5%, rather than the historical average of +10%.
- Watch for Valuation Contraction Risk: If the P/E reverts to the mean (17x), short-term returns could be negative, though long-term returns remain positive.
- Caution on Overweighting Growth Sectors: The current high allocation to Technology and Communication Services implies heavy reliance on valuation expansion. If interest rates rise or earnings growth slows, downside risk is significant.
- Active Management May Outperform: In an environment of high valuations and increasing sector divergence, stock selection (e.g., the Patient Capital strategy) is more likely to outperform passive index investing.