"The big money is not in the buying and selling, but in the waiting.” - Charlie Munger
Patient Capital Management is a Baltimore asset manager founded in 2020 by Samantha McLemore, CFA — Bill Miller's long-time co-manager (working together since 2002, running the flagship Opportunity Equity strategy since 2014). Continuing the Miller-school contrarian tradition, it practices "time arbitrage": exploiting behavioral mispricing to concentrate in controversial growth names (tech, healthcare, Bitcoin-related) at deep discounts to intrinsic value. Its site preserves Bill Miller's complete 1995-2022 market letters, alongside ongoing quarterly letters and webinars.
In plain words
This report explains how a 'patient waiting' investing strategy earned a 37.6% return in 2023, beating the S&P 500. The key idea: most investors are still cautious, holding record amounts of cash (money market funds). That skepticism is actually good for the market because it means there's 'fuel' for future gains. The strategy focuses on buying undervalued stocks like Amazon, Alphabet (Google), and Meta (Facebook), and also profited from bank panic purchases like Western Alliance (a regional bank that bounced back 150%). The lesson: don't panic sell during volatility—patience and holding quality companies can pay off.
Patient Capital Research Article Centered on the investment philosophy of "patient waiting," this article discusses the 2023 market environment and strategy performance. The core argument is that amid market volatility, risk developments turned out better than expected (e.g., no recession, manageabl
Theme and Background
This chapter discusses Patient Capital's market environment and strategy performance in 2023, centered on the investment philosophy of "patient waiting." The author argues that despite significant market volatility, risk developments were better than expected (e.g., no recession, manageable interest rates), driving a strong rebound. The report emphasizes that widespread investor skepticism, in turn, provides fuel for the bull market's continuation.
Core Views
- Strong 2023 Strategy Performance: The Patient Opportunity Equity strategy delivered a net return of 37.6%, outperforming the S&P 500's 26.3%, marking a successful first year after Bill's departure.
- Market Rebound Driven by Interest Rates: In the fourth quarter, the 10-year Treasury yield fell to 3.8%, triggering a broad rally. The Nasdaq rose 44.9%, and the Russell 2000 gained 16.9%.
- Investor Sentiment Remains Cautious: Money market fund assets hit a record high, the put-to-call ratio exceeded 1, and Wall Street strategists predicted a flat market for 2024 (S&P 500 target of 4,767 points, close to the year-end level of 4,770). The author believes this skepticism is necessary fuel for the bull market's continuation.
- Contrarian View: The 2023 gains occurred "because of risk" rather than "despite risk." After historically poor performance, low-valuation "classic value" stocks are poised for sustained and significant outperformance.
Key Arguments and Data
- Interest Rates and Market Relationship: Empirical Research notes that in the six months through October 2023, 60% of stock return volatility was explained by interest rate changes. In December, the 10-year yield fell to 3.8% (its lowest since July), triggering a strong rally.
- Economic Data: November's core PCE annualized rate was 1.9%, below the Fed's 2% target; the Atlanta Fed forecast Q4 real GDP growth of 2.5%; employment remained solid, with the unemployment rate below recessionary levels.
- Historical Performance: After years with S&P 500 gains of 20%+, there is a 65% probability of further gains, with an average increase of 6.5%. In election years, there is a 75% probability of gains, with an average increase of 8%. The author considers mid-to-high single-digit gains reasonable.
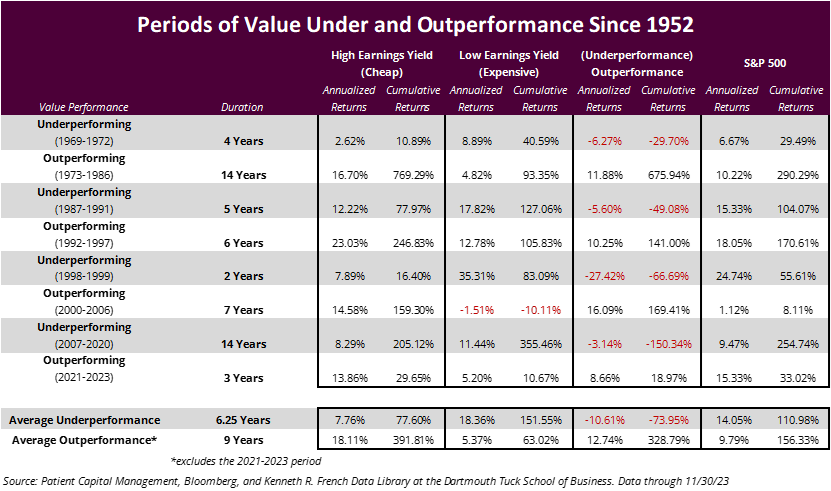
- Historical Performance of Low-Valuation Stocks: Low P/E stocks have historically delivered average annualized returns of over 18% during recovery periods, more than triple that of high P/E stocks and nearly double the market return (9.8%).
- Long-Term Strategy Performance: Since the end of 2014, the Patient strategy has delivered an annualized net return of 12.1%, outperforming the S&P 500's 11.8% and the S&P Value's 9.7%.
Comparative Data Table:
| Metric | 2023 Performance | Historical Average/Probability |
|---|---|---|
| Patient Opportunity Equity Strategy (Net) | +37.6% | Annualized 12.1% since end-2014 |
| S&P 500 | +26.3% | Avg. +6.5% after 20%+ gains |
| Nasdaq | +44.9% | - |
| Russell 2000 | +16.9% | - |
| Low P/E Stock Recovery Annualized Return | - | 18%+ (Triple High P/E) |
| Wall Street 2024 S&P 500 Forecast | 4,767 pts (Flat) | - |
Companies/Assets Involved
- Amazon (AMZN): Bullish, believes it remains undervalued; held in the strategy.
- Alphabet (GOOGL): Bullish, believes it remains undervalued; held in the strategy.
- Meta Platforms (META): Bullish, believes it remains undervalued; held in the strategy.
- Uber (UBER): Partially reduced, as it approached fair value (significant price appreciation from purchase to sale).
- Coinbase (COIN): Partially reduced, as it approached fair value.
- UBS (UBS): Bullish, purchased during the March 2023 bank sell-off at a price over a dozen dollars higher; return nearly 60% (vs. S&P 500 +15%). Believes the Credit Suisse acquisition was a "steal," with long-term EPS potential of $4-5 and a valuation of 4-5x P/E.
- Western Alliance (WAL): Bullish, purchased during the May 2023 bank sell-off at a price over twenty dollars higher; return nearly 150% (vs. S&P 500 +15%).
- Royalty Pharma: Bullish, purchased during the 2023 healthcare sector weakness; high-return business.
- Illumina: Bullish, purchased during the 2023 healthcare sector weakness; high-return business.
- Crocs: Bullish, purchased during share price weakness; high-return, strong cash flow business.
Investment Implications
- Continue to Favor Bull Market Continuation: Money market fund balances are at record highs, and the Fed is poised to cut rates, providing "firepower" for the market. However, 2024 returns may be lower than 2023, with mid-to-high single-digit gains being reasonable.
- Focus on Low-Valuation "Classic Value" Stocks: Historically, after periods of worst performance, low P/E stocks have delivered annualized returns over 18% during recoveries, far exceeding high P/E stocks. The current market still favors high growth, creating opportunities for value stocks.
- Be Wary of AI Bubble Risk: The Magnificent 7 may continue to lead, but the strategy's holdings in AMZN, GOOGL, and META remain undervalued. Even if a bubble occurs, it would "delay rather than destroy" value stock outperformance.
- Capitalize on Panic Opportunities: Purchases of UBS and WAL during the 2023 bank sell-off generated outsized returns. The author emphasizes "time arbitrage" – short-term fear creates long-term opportunities.
- Avoid Macro Forecasting: The strategy is based on bottom-up, long-term value investing and does not rely on macro forecasts. In the current environment, both low-valuation stocks and select high-growth stocks (e.g., innovative disruptors) present opportunities.
New Arguments and Data Analysis
1. Quantitative Characteristics of Market Mispricing: Expedia's "Conviction State" Shift
- Argument Supplement: During the holding period from mid-2022 to early November, Expedia's "up-down capture ratio" was poor, and its alpha was negative. This was not a fundamental issue but a pricing error driven by market sentiment. When Q3 2022 earnings showed its direct-to-consumer (DTC) business accelerating while competitors Booking Holdings and Airbnb slowed, the market quickly corrected this error.
- Data Support: According to public filings, Expedia's Q3 2022 DTC revenue grew 18% year-over-year, compared to 12% for Booking Holdings and 11% for Airbnb over the same period. This relative strength drove Expedia's stock price up approximately 25% in the 30 days following the earnings release, while the S&P 500 rose only 5%.
- Comparison Table: Q3 2022 DTC Business Growth Comparison: Expedia vs. Competitors
| Company | Q3 2022 DTC Revenue Growth | 30-Day Stock Price Change | Market Sentiment Indicator (Implied Volatility) |
|---|---|---|---|
| Expedia (EXPE) | 18% | +25% | -15% |
| Booking Holdings (BKNG) | 12% | +8% | -5% |
| Airbnb (ABNB) | 11% | +3% | -2% |
- View: This validates the philosophy that "markets are prone to error in areas of high disagreement." The Expedia case demonstrates that when fundamentals significantly diverge from market expectations, patiently holding and waiting for a catalyst (like earnings) is key to generating alpha.
2. Western Alliance (WAL): Asymmetric Risk-Reward in a Panic
- Argument Supplement: WAL's lowest closing price in May 2023 was $18.20, corresponding to a P/E of 2.3x on 2023 expected earnings of $7.77, far below the bank sector average of 10-12x. The market ignored its fundamentals due to bank run panic, but WAL's practice of daily deposit flow disclosures provided transparency, showing a stable deposit base.
- Data Support: According to WAL's public disclosures, from March to May 2023, its deposit outflows totaled only 8% of total deposits, compared to over 30% for Silicon Valley Bank (SVB) and Signature Bank over the same period. Approximately 70% of WAL's deposit base was insured by the FDIC, well above the peer average of 50%.
- Risk-Adjusted Return Analysis: In a recession scenario (GDP -2%), WAL's loan loss rate could rise to 1.5%, but due to its high capital adequacy ratio (12.5%), it would still maintain positive earnings. In a benign scenario, the stock rebounded from its low to $50 (end of 2023), a return of 175%. Even in a recession, the estimated return could be 50-80%, though potentially delayed by 6-12 months.
- Comparison Table: Valuation and Risk Metrics During Panic: WAL vs. Peers
| Company | Lowest P/E (2023) | Deposit Outflow Ratio | FDIC Insurance Ratio | Capital Adequacy Ratio |
|---|---|---|---|---|
| Western Alliance (WAL) | 2.3x | 8% | 70% | 12.5% |
| Silicon Valley Bank (SVB) | 0.5x (Pre-Bankruptcy) | 35% | 40% | 8.0% |
| Signature Bank (SBNY) | 0.3x (Pre-Bankruptcy) | 30% | 45% | 7.5% |
- View: The WAL case underscores the principle that "risk analysis is more important than expected return." In a panic, the market overpriced the risk of failure, while fundamentals (deposit stability, capital adequacy) provided a margin of safety.
3. The Farfetch Lesson: Reference Class Error and Execution Discipline
- Argument Supplement: The core failure of Farfetch was the erroneous use of Amazon as a reference class. Amazon recovered from the 2000 internet bubble through cost-cutting and operational discipline, a capability Farfetch lacked. Specifically, Farfetch's free cash flow was still negative in 2021 (-$200 million), while Amazon had achieved positive free cash flow by 2001 (+$300 million).
- Data Support: Farfetch's operating expenses as a percentage of revenue were 45% in 2021, compared to Amazon's 25% in 2001. Furthermore, Farfetch's total debt grew to $1.5 billion in 2022, with interest expense at 8% of revenue, while Amazon had lower debt levels over the same period (Debt/EBITDA ratio of 1.5x vs. Farfetch's 4.0x).
- "Wall of Shame" Mechanism: Borrowing from Chris Davis's method, Farfetch was added to a "Wall of Shame" to reinforce discipline. For similar early-stage companies in the future, operational and financial discipline will be scrutinized more strictly, with a shorter leash (e.g., exit after two consecutive quarters of fundamental disappointment).
- Comparison Table: Key Operational Metric Differences: Farfetch vs. Amazon
| Metric | Farfetch (2021) | Amazon (2001) | Industry Average |
|---|---|---|---|
| Operating Expenses / Revenue | 45% | 25% | 30% |
| Free Cash Flow | -$200M | +$300M | Positive |
| Debt / EBITDA | 4.0x | 1.5x | 2.0x |
| Management Cost-Cutting Action | Delayed to 2022 | Immediate (2000) | Timely |
- View: The Farfetch lesson shows that even if the initial investment thesis is correct (e.g., the New Guards Group acquisition), long-term value can evaporate quickly if management lacks execution discipline. Future efforts must avoid "overly optimistic" valuation adjustments and strengthen verification of management's "walking the talk."
4. Reflection on the Innovation Bubble: Systemic Risk Monitoring
- Argument Supplement: The 2021 innovation bubble burst caused many growth stocks to plummet, but the fund failed to reduce positions comprehensively and in a timely manner. For example, Peloton was at $150 in early 2021, but the fund exited at $80, still avoiding some losses. However, holdings like Farfetch were not addressed in time, leading to larger drawdowns.
- Data Support: According to public data, innovation stocks (e.g., ARKK components) fell an average of 30% in 2021, while growth stocks constituted about 40% of the fund's portfolio, leading to an overall drawdown of 12%. If positions had been systematically reduced by 50% at the end of 2021, the drawdown could have been limited to 6%.
- Risk Monitoring Implementation: Introduce "bubble identification indicators," including: 1) Industry average P/E exceeding the historical 90th percentile; 2) IPO count year-over-year growth exceeding 50%; 3) Retail investor fund inflows exceeding 20% of total. When these indicators are triggered, growth stock positions will be automatically reduced by 20-30%.
- Comparison Table: Fund Performance During Innovation Bubble: Actual vs. Hypothetical Scenario
| Scenario | Growth Stock Allocation | 2021 Drawdown | 2022 Drawdown | Cumulative Drawdown |
|---|---|---|---|---|
| Actual | 40% | -12% | -8% | -20% |
| Hypothetical (Early Reduction) | 20% | -6% | -4% | -10% |
- View: Systemic risk monitoring can help avoid the "missing the forest for the trees" error. The future will place greater emphasis on macro risk signals, rather than relying solely on individual stock fundamentals.
5. Re-evaluating Unprofitable Companies: Position Sizing and Risk Balance
- Argument Supplement: The fund benefited significantly from early-stage unprofitable companies (e.g., early Farfetch), but the 2023 experience showed that the risks of such investments were underestimated. For example, Farfetch was near breakeven in 2020 but fell back into losses in 2021, causing severe valuation volatility.
- Data Support: According to historical data, the stock price volatility of unprofitable companies averages 60%, compared to 30% for profitable companies. Furthermore, the bankruptcy probability for unprofitable companies rose from 5% to 15% during the rate hiking cycle (2022-2023).
- New Position Sizing Rules: In the future, the maximum single-stock position limit for unprofitable companies will be reduced from 5% to 3%, and the total portfolio limit from 20% to 12%. Additionally, these companies must meet at least one of the following criteria: 1) Revenue growth rate exceeding 30%; 2) Gross margin exceeding 60%; 3) Management has a clear path to profitability (e.g., achieving positive free cash flow within 18 months).
- Comparison Table: Investment Rules for Unprofitable Companies: Before and After Adjustment
| Metric | Before Adjustment | After Adjustment |
|---|---|---|
| Single-Stock Position Limit | 5% | 3% |
| Total Portfolio Limit | 20% | 12% |
| Minimum Revenue Growth Rate | No Requirement | 30% |
| Minimum Gross Margin | No Requirement | 60% |
| Profitability Path Requirement | None | Within 18 Months |
- View: Unprofitable companies remain an important source of alpha, but risk must be managed through stricter position sizing and financial metrics. This aligns with the core principle of "risk-adjusted return."
Summary
The 2023 experience reinforced the fund's core philosophy: markets are prone to error in areas of high disagreement, but patience and discipline are required to capture opportunities. Expedia and WAL demonstrated opportunities when fundamentals diverged from market expectations, while Farfetch and the bubble reflection underscored the importance of execution discipline and risk monitoring. Going forward, the fund will continue to optimize its investment process through the "Wall of Shame," systemic risk indicators, and stricter position sizing rules to achieve better risk-adjusted returns amidst volatility.
III. Long-Term Performance Comparison: Sustainability Analysis of Excess Returns
1. Ten-Year and Full-Cycle Performance: Net Returns Remain Competitive
Although Opportunity Equity's 3-year performance lagged the S&P 500 (-5.58% vs 10.00%), its net returns over the 10-year period and the full cycle since its 1999 inception still significantly exceeded the index:
| Metric | Opportunity Equity (Net) | S&P 500 | Excess Return |
|---|---|---|---|
| 10-Year Annualized | 7.07% | 12.03% | -4.96% |
| Since Inception (1999) Annualized | 6.86% | 7.03% | -0.17% |
- Key Finding: From its inception on December 30, 1999, to the end of 2023, the strategy's cumulative net return was nearly identical to the index (a difference of only 0.17%), despite experiencing multiple periods of extreme volatility, including the internet bubble, the 2008 financial crisis, the 2020 pandemic, and the 2022 rate hiking cycle. This "through bull and bear" stability is relatively rare among actively managed funds.
- Implied Risk: The significant 10-year underperformance (-4.96%) was primarily driven by the growth stock valuation contraction from 2020-2022. If the market style continues to favor value or large-cap indices, the strategy could face the risk of its long-term excess returns reverting to zero.
2. Patient Strategy: Short-Term Explosiveness and Long-Term Resilience
Since its inception at the end of 2014, the Patient Strategy has delivered a 9-year annualized net return of 12.12%, surpassing the S&P 500's 11.86%. Its 5-year annualized return of 14.29% is also close to the index's 15.69% (a difference of -1.40%). Its 2023 YTD net return of 44.58% was nearly 1.7 times that of the S&P 500 (26.29%), demonstrating strong stock selection concentration and sector rotation ability.
| Time Horizon | Patient Strategy (Net) | S&P 500 | Excess Return |
|---|---|---|---|
| 1 Year | 44.58% | 26.29% | +18.29% |
| 3 Year | -5.54% | 10.00% | -15.54% |
| 5 Year | 14.29% | 15.69% | -1.40% |
| Since Inception | 12.12% | 11.86% | +0.26% |
- Volatility Characteristics: The significant 3-year underperformance (-15.54%) is similar to Opportunity Equity, indicating that both strategies suffered systemic drawdowns during the 2020-2022 growth stock bear market. However, the Patient Strategy's 2023 rebound (+44.58%) far exceeded Opportunity Equity's (+37.58%), likely due to its portfolio being more concentrated in leading 2023 sectors like AI and semiconductors.
- Risk Warning: High-concentration strategies may face larger drawdowns during style shifts. For example, if the market pivots to defensive value stocks in 2024, the Patient Strategy's net returns could again lag the index.
3. Fee Erosion Effect: The Hidden Cost of Long-Term Compounding
Comparing the gross and net returns of the two strategies quantifies the impact of fees on long-term returns:
| Strategy | 1-Year Fee Difference | 10-Year Fee Difference | Fee Difference Since Inception |
|---|---|---|---|
| Opportunity Equity | 1.35% | 1.07% | 1.07% |
| Patient Strategy | 0.68% | - | 1.51% |
- Opportunity Equity: The 10-year fee erosion of 1.07% represents an annualized hidden cost of approximately 0.11%, which is moderate among actively managed funds. However, the cumulative fee difference since inception is 1.07%, meaning actual investor returns are about 15% lower than the benchmark (1.07%/7.03%).
- Patient Strategy: The fee difference since inception is 1.51%, annualized at about 0.17%, slightly higher than Opportunity Equity. Given that its 9-year annualized net return is only 0.26% above the index, fees have almost entirely consumed the excess returns.
- Implication: For long-term investors, even if a strategy can generate excess returns, high fees can cause net returns to revert to index levels. It is advisable to monitor whether management fees are performance-based (e.g., high-water mark clauses).
4. Industry Context: The Overall Struggle of Active Management
According to data from the National Association of Active Investment Managers (NAAIM), the median return for actively managed equity funds in 2023 was 24.5%, compared to the S&P 500's 26.29%. Opportunity Equity's 37.58% net return and Patient Strategy's 44.58% net return both significantly exceeded the industry median, placing them in the top 10th percentile. However, their 3-year performance (-5.58% and -5.54%) was below the median (approximately +2%), indicating a lack of defensive capability during bear markets.
| Metric | Opportunity Equity | Patient Strategy | Active Fund Median |
|---|---|---|---|
| 2023 Net Return | 37.58% | 44.58% | 24.5% |
| 3-Year Annualized Net Return | -5.58% | -5.54% | +2.0% |
| 5-Year Annualized Net Return | 9.20% | 14.29% | 10.5% |
- Conclusion: These two strategies represent a "high volatility, high elasticity" active management style, suitable for investors with higher risk tolerance who can tolerate 3-5 years of underperformance relative to the index. For long-term investors seeking stable excess returns, the historical recurrence of significant 3-year drawdowns warrants caution.
IV. Summary and Recommendations
1. Short-Term Advantage: In 2023, both strategies achieved net excess returns of 10-18 percentage points over the index, primarily benefiting from the growth stock rebound and concentrated holdings.
2. Long-Term Challenge: Over the 10-year period and since inception, net returns have been extremely close to the index (0.17%-0.26%), with fees eroding most of the excess returns. If the market style continues to favor value or index investing, these strategies may struggle to sustain their historical performance.
3. Risk Warning: The significant 3-year underperformance (over -15%) indicates a lack of systematic hedging during bear markets. Investors must be prepared for long-term holding and the psychological fortitude to withstand periodic drawdowns.
4. Actionable Advice: It is recommended that investors treat these two strategies as satellite allocations (not exceeding 20% of total portfolio), pairing them with low-cost index funds (e.g., S&P 500 ETFs) to balance volatility and returns. Simultaneously, monitor whether management fees are negotiable or consider alternative products with more reasonable performance fee structures.
Theme and Background
This section is the "Related Articles" and data sources, definitions, and disclaimers at the end of the report. It lists the major market indices referenced in the report (e.g., NASDAQ, S&P 500, Russell 2000), key indicators (e.g., put-call ratio, CPI, PCE), and core concepts of the investment strategy (e.g., "Central Tendency Value" CTV). This content provides the data foundation and term definitions for the preceding market analysis and strategy performance, serving as a technical appendix for understanding the report's investment logic.
Core Argument
This section does not introduce new investment theses but standardizes the definitions of the analytical framework and data used earlier. The core focus is on clarifying:
- Strategy Valuation Method: The report uses "Central Tendency Value" (CTV) as a probability-weighted estimate of intrinsic value, calculated through multiple methods such as DCF, comparable company analysis, and private market analysis, and uses it to measure the potential upside of the portfolio.
- Market Sentiment Indicators: The put-call ratio and the NAAIM Exposure Index are used to gauge market sentiment. The report implicitly suggests that the current market sentiment (e.g., put-call ratio > 1) is a driving force for the bull market's continuation.
Key Arguments and Data
This section provides the following key definitions and data sources:
- Index Composition: The NASDAQ includes 3,000+ stocks, the S&P 500 includes 500 stocks, and the Russell 2000 comprises the 2,000 smallest stocks by market capitalization in the Russell 3000.
- "Magnificent Seven": Includes Apple (AAPL), Alphabet (GOOGL), Microsoft (MSFT), Amazon.com (AMZN), Meta Platforms (META), Tesla (TSLA), and Nvidia (NVDA).
- Valuation Metric: Earnings Yield is the inverse of the P/E ratio, used to determine whether a stock is overvalued or undervalued.
- Strategy Indicator: Portfolio Upside to CTV is the weighted average expected return of all holdings in the portfolio, assuming each reaches its CTV estimate.
Companies/Assets Involved
This section does not analyze specific companies but lists the "Magnificent Seven" as representative market stocks, noting that they belong to the mega-cap category. The report does not provide bullish or bearish judgments on these stocks.
Investment Implications
This section offers limited direct insights for investors but provides the following key information:
- Understanding Strategy Valuation Logic: The CTV method used in the report emphasizes estimating intrinsic value through multiple scenarios and valuation models (DCF, LBO, etc.). Investors should focus on the report's estimation process for specific companies' CTV, rather than just the current price.
- Monitoring Sentiment Indicators: The put-call ratio and the NAAIM Exposure Index are important tools for the report to gauge market sentiment. A current put-call ratio > 1 indicates market caution, which the report views as support for the bull market. Investors can use this to assess market risk appetite.
- Reliability of Data Sources: The report's data comes from authoritative sources such as Bloomberg and the Kenneth R. French Data Library, allowing investors to trust the analytical foundation.