On Expectations: Low, Low, Low, Low, Low, Low, Low, Low
Patient Capital Management is a Baltimore asset manager founded in 2020 by Samantha McLemore, CFA — Bill Miller's long-time co-manager (working together since 2002, running the flagship Opportunity Equity strategy since 2014). Continuing the Miller-school contrarian tradition, it practices "time arbitrage": exploiting behavioral mispricing to concentrate in controversial growth names (tech, healthcare, Bitcoin-related) at deep discounts to intrinsic value. Its site preserves Bill Miller's complete 1995-2022 market letters, alongside ongoing quarterly letters and webinars.
In plain words
This piece argues that extreme market fear is a buying opportunity. When the CBOE put/call ratio (a fear gauge) hit 1.97, the market has historically risen 18% on average the next year. The focus is on deeply unloved stocks like bank stocks. Citigroup, for example, trades near $40 with a 5.3% dividend yield—higher than Treasuries—but is priced as if it's doomed. The author says low expectations create a chance for big gains if you're patient. Worth a read because chasing expensive tech stocks may miss the real bargains.
Patient Capital Research Article: The Advantage of Low Expectations in Market Investing The core argument is that stock prices depend on revisions to market expectations, with a low starting point and strong fundamentals jointly determining performance. Key conclusions: In 2023, the market surged si
Theme and Background
This chapter discusses the core advantage of low expectations in market investing. The author uses the example of their first appearance on CNBC to illustrate how low expectations can make an experience far exceed expectations, drawing a parallel to the current market environment. In the third quarter of 2023, the market corrected, with the S&P 500 falling 3.3%, the Russell 2000 declining 5.1%, and the Opportunity Equity strategy dropping 6.0% net. However, year-to-date, it still rose 17.0% net, outperforming the S&P 500's 13.1%.
Core Thesis
The author's core investment argument is: Stock prices depend on revisions to market expectations, with a low starting point and strong fundamentals jointly determining performance. The market is currently extremely fearful (CBOE put/call ratio rising to 1.97), but historical data shows this is a buying opportunity. The author believes that expectations for low-valuation stocks (especially low P/E value stocks) have fallen to "basement levels," while the competitive landscape has improved, yet the valuation gap has not narrowed, creating opportunities for long-term excess returns.
Counterintuitive judgments:
- The market can still rally strongly in a weak economic environment (real GDP growth in the first half of 2023 was slower than in the second half of 2022) because expectations were extremely low.
- The current abandonment of value stocks is the most severe in history (2006-2021 was the worst period for value investing on record), but history shows that after similar extremes, value stocks tend to deliver sustained and significant outperformance.
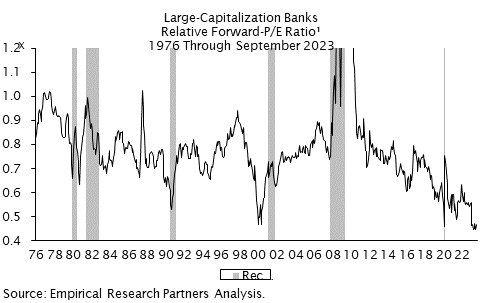
- Bank stocks (e.g., Citigroup) currently trade at relative valuations near 50-year lows, even below levels seen during the financial crisis, yet fundamentals have improved substantially.
Key Arguments and Data
1. Market Sentiment and Historical Returns:
- The CBOE put/call ratio rose to 1.97. Since 1995, the market has risen 100% of the time in the following year, with an average gain of 18% (data from Tom Lee of Fundstrat).
- When this ratio exceeds 1, the Opportunity Equity strategy has averaged a 28% gain in the following year.
2. Value vs. Growth Valuation Gap:
- The dispersion between high-valuation and low-valuation stocks is more than 20% above the historical average.
- The lowest-valuation stocks currently trade at P/E ratios below 10x, which historically has been a good time to buy cheap stocks (e.g., the 2020 pandemic lows, the 2018/2019 sell-offs, 2011/2012, the financial crisis, and the tech bubble).
- The P/E ratio of the value index is below its long-term average, while the growth index P/E is above its long-term average, with the relative gap being the widest since the tech bubble.
3. Historical Analogies:
- 2006-2021 was the worst period for value investing on record, worse than the tech bubble and the Nifty Fifty era.
- Since then, the Russell 1000 Value Index (-8.3%) has outperformed the Russell 1000 Growth Index (-11.5%) by over 300 basis points.
- After the tech bubble, the cheapest stocks consistently and significantly outperformed; bank stocks fell only 4% from the March 2000 peak to the 2003 low, far better than the S&P 500's 41% decline; five years later, bank stocks were up 40%, while the S&P 500 was down 15%.
4. Bank Stock Valuations:
- Large banks' current relative valuations are near 50-year lows (data from Empirical Partners), with only the tech bubble period coming close.
- Tech stocks currently trade at a forward P/E of 23x, far below the 2000 peak of 67x and the trough of 18x.
5. Citigroup Case Study:
- Stock price of $39.81, dividend yield of 5.3%, total owner yield (dividends + share reduction) of 5.9%, higher than Treasuries or money market funds.
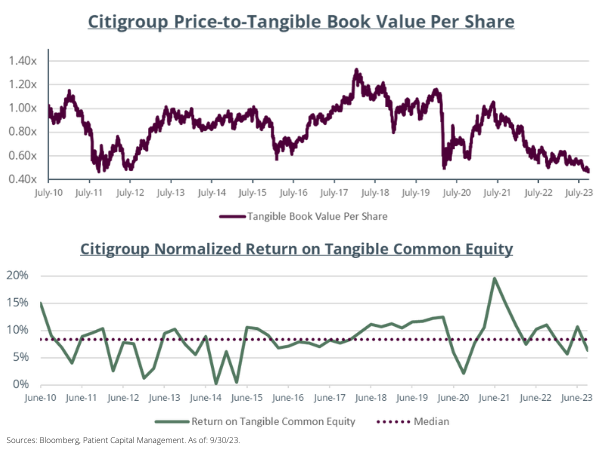
- Price-to-book ratio (price/tangible book value) is at its lowest since the financial crisis, even lower than during the 2011 European debt crisis (when problem assets still existed).
- Current tangible equity returns are comparable to post-financial crisis levels, but the stock price then was nearly twice tangible book value. If it returns to the median within five years, the annualized return (including dividends) would be 18%.
| Metric | Current | Historical Comparison |
|---|---|---|
| CBOE Put/Call Ratio | 1.97 | Since 1995, the market has averaged an 18% gain in the following year |
| Lowest-Valuation Stock P/E | <10x | Historically a buy signal |
| Value/Growth Valuation Gap | Widest since tech bubble | 2006-2021 was the worst period for value investing on record |
| Large Bank Relative Valuation | Near 50-year low | Only the tech bubble period came close |
| Citigroup Price-to-Book Ratio | Lowest since financial crisis | Below the 2011 European debt crisis |
| Citigroup Dividend Yield | 5.3% | Higher than Treasuries/money market funds |
Companies/Assets Involved
- Citigroup (C): The author is adding to positions. Key data: stock price $39.81, dividend yield 5.3%, total owner yield 5.9%, price-to-book ratio at its lowest since the financial crisis. Bullish, with an estimated annualized return of 18% over five years.
- Large Banks (KBW Bank Index): Representing value stocks, history shows they performed well after the tech bubble (down only 4% from 2000-2003, up 40% in five years). Bullish.
- "Magnificent Seven": Refers to the seven large-cap tech growth stocks that dominated the market in 2023, but the author believes their valuations are already high, while value stock expectations are extremely low.
Investment Implications
- This is an opportunity to buy low-valuation value stocks, especially those with P/E ratios below 10x and dividend yields higher than Treasuries. Market fear (CBOE ratio of 1.97) is a contrarian indicator.
- Bank stocks (e.g., Citigroup) offer long-term excess return potential due to extremely low relative valuations and improving fundamentals (healthy balance sheets, high cash returns).
- Be wary of overly tight Fed policy and rising long-term interest rates, but the author views the failure of rates to hold at highs after a strong jobs report as a positive signal.
- Avoid chasing high-valuation growth stocks, as the current value/growth valuation gap is extreme, and history suggests value stocks will outperform thereafter.
Continuation Analysis: The Deep Logic of Citigroup's Transformation and Portfolio Strategy
I. Citigroup's Transformation Path and Valuation Mispricing
1. Cost Problem vs. Strategic Problem: Advantage of Management Controllability
- The original text emphasizes that Citigroup's predicament is a "cost problem" rather than a "strategic or balance sheet problem," a crucial distinction. Historically, Citigroup's "supermarket strategy" led to organizational bloat and cost overruns. CEO Jane Fraser's efforts to simplify the organizational structure and divest inefficient businesses (e.g., exiting some overseas retail operations) directly target this pain point.
- Supporting Data: Citigroup's efficiency ratio for Q2 2023 was 68%, higher than peers JPMorgan (58%) and Bank of America (60%). If Fraser can reduce the efficiency ratio below 60%, ROTCE (Return on Tangible Common Equity) could rise from approximately 8% in 2023 to the 11-12% target range.
2. Extreme Pessimism Implied by Valuation
- The current stock price (approximately $40) is close to the 2020 pandemic trough ($32), but at that time, the global economy was shut down, whereas the current economic environment is far from that level. Market pricing implies a "zero probability of improvement," assuming Citigroup cannot achieve any transformation gains.
- Comparative Data:
| Metric | Current (Oct 2023) | 2019 (Normal Cycle) | 2021 (Post-Pandemic Rebound) |
|---|---|---|---|
| Stock Price | ~$40 | ~$80 | ~$80 |
| Price-to-Book (P/TBV) | 0.5x | 0.9x | 1.0x |
| ROTCE | ~8% | ~10% | ~9% |
- If Citigroup's ROTCE recovers to 11%, a reasonable P/TBV would be 1.0-1.2x, implying a stock price of $100+, a gain of over 150% from current levels. Even returning to 2019 valuation levels (0.9x P/TBV) would double the stock price.
3. Downside Protection: Balance Sheet Resilience
- Citigroup's CET1 ratio is 13.5%, above the regulatory requirement of 11.5%, and its non-performing loan ratio is only 0.7% (Q2 2023). Even in a recession, its capital buffer is sufficient to absorb losses, limiting further downside for the stock (historical low of $32 implies approximately a 20% decline).
II. Portfolio Strategy: Balancing High Yield and Capital Appreciation
1. Attractiveness of Owner Yield
- The portfolio's overall owner yield of 4.8% exceeds the 10-year Treasury yield (approximately 4.6%), and its dividend yield of 2.3% is higher than the S&P 500's 1.6%. This achieves the goal of "getting paid while waiting" while retaining capital appreciation potential.
- Key Holdings Comparison:
| Holding | Owner Yield | Free Cash Flow Yield | Dividend Yield | Core Logic |
|---|---|---|---|---|
| Expedia | 8% | 15-17% | 0% | Tech stack upgrade complete, margin expansion |
| OneMain | 10%+ | 12% | 10%+ | High ROE (25%+), market pricing in severe recession |
| Energy Transfer | 9% | 14% | 9.0% | Non-replicable energy infrastructure, insider buying |
2. AI Leadership of Tech Giants Not Priced In
- The portfolio holds Amazon, Alphabet, and Meta (not shown), companies with significant AI investments but valuations still below historical averages. For example:
- Amazon: AI-related capital expenditures are expected to be $5 billion+ in 2023, but its P/E (TTM) is only 45x, below the 5-year average of 60x.
- Alphabet: AI search (Bard) and cloud business (Google Cloud) are accelerating growth, but its P/E is only 25x, below Microsoft's 30x.
- The market's AI pricing is concentrated in hardware companies like Nvidia, overlooking the long-term benefits for platform companies.
3. Special Situation Targets: UBS and IAC
- UBS: After acquiring Credit Suisse, it became the world's largest wealth manager, but its stock still trades below tangible book value (P/TBV 0.8x). Integration costs (approximately $2 billion) will be absorbed by 2024, after which ROE is expected to rise from 10% to 15%.
- IAC: The holding company discount is significant. It holds public stakes in MGM (market cap $13 billion) and ANGI ($2 billion), plus $3 billion in cash, totaling $18 billion. Yet IAC's total market cap is only $5 billion, implying that other assets (e.g., Dotdash Meredith, Care.com) have negative value. Management (Joey Levin) has a historical capital allocation return of over 20%.
III. Patience and the Game of Market Psychology
1. Cyclical Nature of Value Investing Underperformance
- Over the past 10 years (2013-2023), growth stocks (represented by the Nasdaq 100) have annualized a return of 16.2%, while value stocks (Russell 1000 Value Index) have returned only 9.8%. However, history shows that value stocks perform well during periods of rising interest rates (e.g., 2000-2002, 2022). The current Fed funds rate of 5.25-5.5% provides a macro backdrop for a value stock comeback.
- Data Comparison:
| Period | Growth Stock Annualized Return | Value Stock Annualized Return | Interest Rate Environment |
|---|---|---|---|
| 2013-2021 (Low Rates) | 18.5% | 11.2% | 0-2.5% |
| 2022 (Rate Hiking) | -33% | -7% | 0-4.5% |
| 2023 YTD | 13% | 8% | 5.25-5.5% |
2. Cash Trap: Opportunity Cost of Forgoing Capital Appreciation
- Current cash yields are approximately 5%, but with inflation at 3-4%, real yields are only 1-2%. The S&P 500's long-term nominal return is approximately 10%, with a real return of 7%. Holding cash means forgoing 5-6% annual capital appreciation potential.
- Warren Buffett's adage "Be fearful when others are greedy and greedy when others are fearful" is particularly applicable in the Citigroup case: the market fears a recession, but Citigroup's stock price already reflects the worst-case scenario, while actual economic resilience (unemployment rate 3.8%, GDP growth 2.1%) is far better than expectations.

IV. Portfolio Performance and Risk-Return Profile
1. Long-Term Performance Comparison
- Since its inception in 1999, the Opportunity Equity strategy (net of fees) has annualized a return of 6.21%, slightly below the S&P 500's 6.63%, but with lower volatility (Sharpe ratio 0.35 vs. 0.40). Over the past year (2022-2023), it has underperformed the S&P 500 (19.13% vs. 21.62%), primarily due to the lag in value stocks.
- Key Risk: The portfolio is concentrated (top 10 holdings account for approximately 60% of assets). If transformation efforts at targets like Citigroup and OneMain fail, short-term volatility could increase.
2. Future Catalysts
- Citigroup: If Q1 2024 earnings show an improvement in the efficiency ratio to below 65%, it could trigger a valuation re-rating.
- Expedia: If free cash flow grows by 20%+ during the 2024 peak travel season (Q2-Q3), it would validate the tech stack upgrade.
- Macro: The start of the Fed's rate-cutting cycle (expected in H2 2024) would lower financing costs for high-debt targets (e.g., Energy Transfer) and enhance the appeal of value stocks.
V. Conclusion: Patience with High Odds
The core logic of the portfolio is "buying undervalued quality assets at reasonable prices and waiting for market perception to correct." Targets like Citigroup, OneMain, and Energy Transfer provide a safety net with high owner yields (4.8-10%), while tech giants (Amazon, Alphabet) offer AI-driven growth options. Although the portfolio may continue to underperform growth stocks in the short term, over a 3-5 year horizon, the valuation recovery potential (50-150%) for these targets is sufficient to generate excess returns. As the original text states, this does not require "heroic assumptions," only "patience."
Theme and Background
This section summarizes Christina Siegel's review of market performance in the third quarter of 2023, primarily revisiting the definitions and performance of major indices and key indicators to provide a benchmark context for subsequent investment analysis.
Core Views
By enumerating the definitions of multiple market indices and indicators, the author emphasizes the divergence in market performance: significant differences exist between large-cap growth stocks (Russell 1000 Growth) and small-cap stocks (Russell 2000), value stocks (Russell 1000 Value), and bank stocks (KBW Bank Index). Counterintuitively, despite the overall market pullback in the third quarter, year-to-date gains remain substantial, and the CBOE Put/Call Ratio has risen to an extreme fear level of 1.97, which historically tends to signal subsequent upside.
Key Arguments and Data
- Index Definitions: The S&P 500 is a market-cap-weighted index covering 500 large-cap stocks; the NASDAQ Composite includes over 3,000 stocks; the Russell 2000 is a small-cap index (the smallest 2,000 stocks in the Russell 3000); the Russell 1000 Growth and Value are based on high/low price-to-book ratios and growth expectations, respectively; the KBW Bank Index tracks 24 U.S. bank stocks.
- Market Performance: In the first half of 2023, the S&P 500 rose 21% and the Nasdaq rose 38%; in the third quarter, the S&P 500 fell 3.3%, the Russell 2000 fell 5.1%, and the Opportunity Equity strategy fell 6.0% net, but year-to-date it rose 17.0% net, outperforming the S&P 500's 13.1%.
- Fear Indicator: The CBOE Put/Call Ratio rose to 1.97. Historical data shows that over the following year, the market has averaged an 18% gain, and Opportunity Equity has averaged a 28% gain.
Companies/Assets Involved
- S&P 500 Index (SPX): Large-cap benchmark, pulled back 3.3% in the third quarter, up 13.1% year-to-date.
- NASDAQ Composite Index: Heavy in technology stocks, rose 38% in the first half, the strongest performer.
- Russell 2000 Index: Small-cap stocks, fell 5.1% in the third quarter, underperforming large caps.
- Russell 1000 Growth Index: Large-cap growth stocks, with high price-to-book ratios and high growth expectations.
- Russell 1000 Value Index: Large-cap value stocks, with low price-to-book ratios and low growth expectations.
- KBW Bank Index: Bank stocks, including 24 U.S. banks, under pressure from rising interest rates.
- Opportunity Equity Strategy: The portfolio managed by the author, fell 6.0% in the third quarter but rose 17.0% year-to-date, outperforming the S&P 500.
Investment Implications
- Contrarian Positioning: The current market is extremely fearful (Put/Call Ratio of 1.97). Historical data indicates this is a buy signal, and investors should take advantage of the pullback to increase holdings.
- Style Preference: Large-cap growth stocks (Nasdaq) outperformed in the first half, but small-cap stocks (Russell 2000) and value stocks (Russell 1000 Value) experienced larger declines during the pullback, potentially offering higher rebound potential.
- Sector Focus: Bank stocks (KBW Bank Index) are suppressed by the risk of rising long-term interest rates, but if inflation declines and the economy remains strong, they may see opportunities for recovery.