Beyond the Factor
GMO is a Boston asset manager co-founded in 1977 by Jeremy Grantham with Richard Mayo and Eyk Van Otterloo, known for valuation-driven dynamic asset allocation built on long-horizon mean reversion. Grantham is famous for calling historic bubbles, warning publicly ahead of both the 2000 dot-com crash and the 2008 financial crisis. Flagship publications include the GMO Quarterly Letter (now written by Asset Allocation co-heads Ben Inker and John Pease), Grantham's Viewpoints essays and the 7-Year Asset Class Forecast.
In plain words
This report argues that traditional value investing (buying stocks with low price-to-book ratios) has underperformed not because value investing is broken, but because accounting metrics ignore intangible assets like brands and patents, mislabeling many good companies as 'expensive.' Instead, GMO recommends using forward-looking valuation methods (like discounted cash flow analysis) and paying a fair price for high-quality, high-growth businesses. Currently, the deepest value stocks (cheapest 20%) are at historically extreme discounts, which could be a rare opportunity for active investors.
GMO has published a white paper titled Beyond the Factor, outlining its value investing methodology. The report's core argument is that value investing has not become obsolete, but its nature has changed. For nearly 50 years, GMO has adhered to an investment philosophy based on objective valuation,
Theme and Background
This chapter serves as the introduction to the GMO white paper Beyond the Factor, primarily elaborating on GMO's investment philosophy centered on valuation sensitivity over the past 50 years. It introduces the core contradiction currently facing value investing: the traditional value factor (HML) has consistently underperformed growth stocks since July 2006, with a magnitude and duration exceeding even the dot-com bubble period. The author argues that value investing has not failed, but its nature has changed.
Core Views
- Value investing has not failed, but passive value strategies based on traditional accounting metrics (e.g., low price-to-book ratio) have become ineffective.
- The fundamental reason for value stocks' underperformance is not weak fundamental growth, but valuation changes: value stocks started with elevated valuations and later fell to historical discounts, while growth stock valuations expanded significantly.
- Value investors should be willing to pay higher prices for high-quality, high-growth companies, rather than mechanically buying "cheap" stocks.
Key Arguments and Data
1. Historical Performance Comparison: From the late 1920s to mid-2006, the Fama-French HML value factor outperformed growth stocks by an average of 4.9% annually; however, since July 2006, value stocks have consistently underperformed, with a magnitude and duration exceeding the dot-com bubble period.
2. Underperformance Cause Analysis: The author finds that the fundamental growth of value stocks has not been weaker than normal levels; the underperformance is entirely driven by valuation changes—value stocks fell from historically high relative levels to near-record discounts, while growth stock valuations surged and remained elevated.
3. Failure of Traditional Metrics: Traditional accounting metrics (e.g., low price-to-book ratio) fail to reflect a company's true economic capital or future profitability due to the neglect of intangible assets (e.g., intellectual property, brands), leading to flaws in passive value strategies.
| Time Period | Value Factor (HML) Performance | Key Context |
|---|---|---|
| Late 1920s – June 2006 | Outperformed growth stocks by 4.9% annually | Includes significant drawdown of value stocks during the dot-com bubble |
| July 2006 – Present | Consistently underperformed, with magnitude and duration exceeding the dot-com bubble | Value stock valuations fell from high to historical discounts; growth stock valuations expanded |
Companies/Assets Involved
- Fama-French HML Factor: Used as a benchmark for traditional value strategies, noted by the author as having been consistently ineffective since July 2006.
- GMO Itself: Cited as a case study, emphasizing its use of forward-looking discounted cash flow (DCF) analysis for stock selection since the 1980s, rather than mechanically relying on low price-to-book metrics.
Investment Implications
- Abandon passive value strategies: Passive value ETFs or index funds based on traditional accounting metrics like low price-to-book may continue to underperform in the current market environment.
- Shift to active, forward-looking value investing: Investors should use discounted cash flow analysis to assess a company's future earnings potential and be willing to pay higher prices for high-quality, high-growth companies.
- Focus on intangible assets: In industries where business models rely on intangible assets (e.g., technology, brands), traditional book value has lost its relevance, requiring a redefinition of "value."
Theme and Background
This section discusses how traditional value factors (such as low price-to-book ratio) rely excessively on book value metrics, leading to severe structural industry biases in investment portfolios. The author points out that this bias causes value strategies to systematically overweight asset-heavy industries (e.g., utilities) while underweighting asset-light industries (e.g., communication services), thereby deviating from the true intent of value investing.
Core Argument
The author argues that passive value strategies based on book value have a fundamental flaw: they do not rely on judgments about the long-term fair value of individual stocks or industries, but mechanically allocate weights based on accounting metrics, distorting industry allocation. GMO advocates for a top-down approach that actively seeks out entire groups of stocks that are mispriced, rather than passively accepting the industry imbalances brought by factor exposure.
Key Arguments and Data
- Specific manifestations of industry bias: Relying on reported book value causes value strategies to overweight industries with substantial tangible assets (e.g., Utilities) while underweighting asset-light industries (e.g., Communication Services).
- Methodology comparison: Traditional passive factor strategies are "bottom-up," screening individual stocks solely based on accounting metrics and ignoring pricing errors at the industry level. In contrast, GMO's approach is "top-down," first identifying entire industries or stock groups that are mispriced, then allocating based on long-term fair value.
| Dimension | Traditional Passive Value Strategy | GMO Active Value Approach |
|---|---|---|
| Stock selection basis | Accounting metrics such as low price-to-book | Long-term fair value (discounted cash flow analysis) |
| Industry exposure | Passively accepted, overweighting asset-heavy industries | Actively managed, avoiding systematic biases |
| Core logic | Factor exposure | Identifying overall pricing errors |
Companies/Assets Involved
This section does not mention specific companies but identifies two types of affected industries:
- Utilities: Due to large tangible assets and high book value, they are overweighted by traditional value strategies.
- Communication Services: Due to lighter assets and a higher proportion of intangible assets, they are underweighted by traditional value strategies.
Investment Implications
Investors should be wary of the industry concentration risk posed by passive value factor strategies (e.g., simply selecting stocks with low price-to-book ratios). Such strategies may expose portfolios excessively to asset-heavy, low-growth industries while missing potential value opportunities in asset-light, high-growth industries. A better approach is to adopt forward-looking valuation methods (e.g., discounted cash flow) to actively assess the long-term fair value of industries and individual stocks, avoiding being misled by the industry biases of accounting metrics.
Theme and Background
This section discusses the inherent flaws of traditional index value strategies (e.g., low price-to-book screening), which inevitably include a large number of "value traps"—stocks that are cheap for a reason due to poor growth prospects or low quality (high leverage, low profitability). GMO proposes that to build a better value investing approach, one must actively identify and exploit market mispricing through both top-down and bottom-up dimensions, rather than passively holding index constituents.
Core Views
- Index value strategies are essentially collections of "value traps": Among the cheapest stocks screened by traditional accounting metrics, many companies indeed have weak fundamentals, and their low prices are justified rather than undervalued.
- True value investing requires active identification of mispricing: GMO believes the key to value investing is not buying "cheap" stocks, but buying stocks that are "undervalued relative to their long-term fair value."
- GMO's methodology combines "top-down" and "bottom-up" approaches: The former seeks broadly undervalued stock groups (e.g., sectors or themes), while the latter identifies pricing deviations at the individual stock level.
Key Arguments and Data
- Definitional flaws of index value: Traditional index value (e.g., the Fama-French HML factor) screens by accounting metrics like price-to-book, but accounting book value is distorted by the omission of intangible assets (e.g., brands, patents, software). Many low price-to-book companies have actually had their economic capital eroded, and their low prices result from fundamental deterioration, not investment opportunities.
- GMO's improved framework:
- Top-down: Combining quantitative models with fundamental research to identify "anomalous valuation opportunities" (e.g., bubbles or genuine misalignments). GMO emphasizes that strategies are only designed and executed when "extraordinary valuation opportunities" are discovered.
- Bottom-up: Conducting discounted cash flow analysis on individual stocks to assess their "true fundamental value," then seeking securities whose market price falls below that assessed value.
| Dimension | Traditional Index Value | GMO Value Approach |
|---|---|---|
| Screening Criteria | Accounting metrics like low P/B or low P/E | Discount relative to long-term fair value |
| Risk Exposure | Passively includes many value traps (low growth, high leverage) | Actively excludes companies with deteriorating fundamentals |
| Depth of Analysis | No fundamental analysis, only factor-based sorting | Quantitative models + fundamental research + scenario testing |
| Investment Timing | Periodic rebalancing, mechanical execution | Concentrated deployment only when significant mispricing is found |
Companies/Assets Involved
- GMO (Grantham, Mayo, Van Otterloo & Co.): The report's author, adhering to a value investing philosophy based on objective valuation for nearly 50 years. In this section, GMO serves as the methodology provider, emphasizing its divergence from passive index value strategies.
- Traditional index value funds (e.g., iShares S&P 100 Value ETF): Used as a comparison, these are noted to contain many stocks that are "justifiably cheap" due to poor growth prospects or low quality, constituting value traps.
Investment Implications
- Investors should be wary of the "value trap" risk in passive value ETFs: Simply buying based on low P/B or low P/E may lead to holding many companies with deteriorating fundamentals, resulting in long-term underperformance.
- Value investing requires active analysis, not factor exposure: GMO's approach suggests that true value investing should combine top-down macro judgment (seeking broad mispricing) with bottom-up stock valuation (excluding fundamental traps).
- Focus on "anomalous valuation opportunities" rather than routine discounts: GMO only acts decisively when "extraordinary valuation opportunities" (e.g., market bubbles or extreme mispricing) are found, implying investors should wait for extreme pricing rather than persistently holding a value factor.
- Greater tolerance for high-quality companies: GMO advocates a willingness to pay higher prices for high-quality, high-growth companies, which stands in stark contrast to traditional value factors (which shun high valuations).
Theme and Background
This chapter focuses on how GMO constructs a better starting point for valuation. The report argues that book value in traditional financial statements is severely distorted because it ignores intangible assets (such as R&D spending) and thus fails to reflect a company's true economic capital. Through years of research, GMO has developed a proprietary metric called "GMO Book," designed to measure shareholders' equity more accurately and lay the foundation for subsequent value judgments.
Core Argument
The author's core thesis is that traditional accounting book value is no longer a reliable starting point for value investing and must be adjusted to reflect economic reality. GMO believes that by capitalizing expenditures that are truly investments, such as R&D and advertising, and adjusting for share issuance factors, a "GMO Book" value closer to a company's true economic capital can be derived. However, this value still does not represent complete intrinsic value and must be combined with the company's quality and growth prospects.
Key Arguments and Data
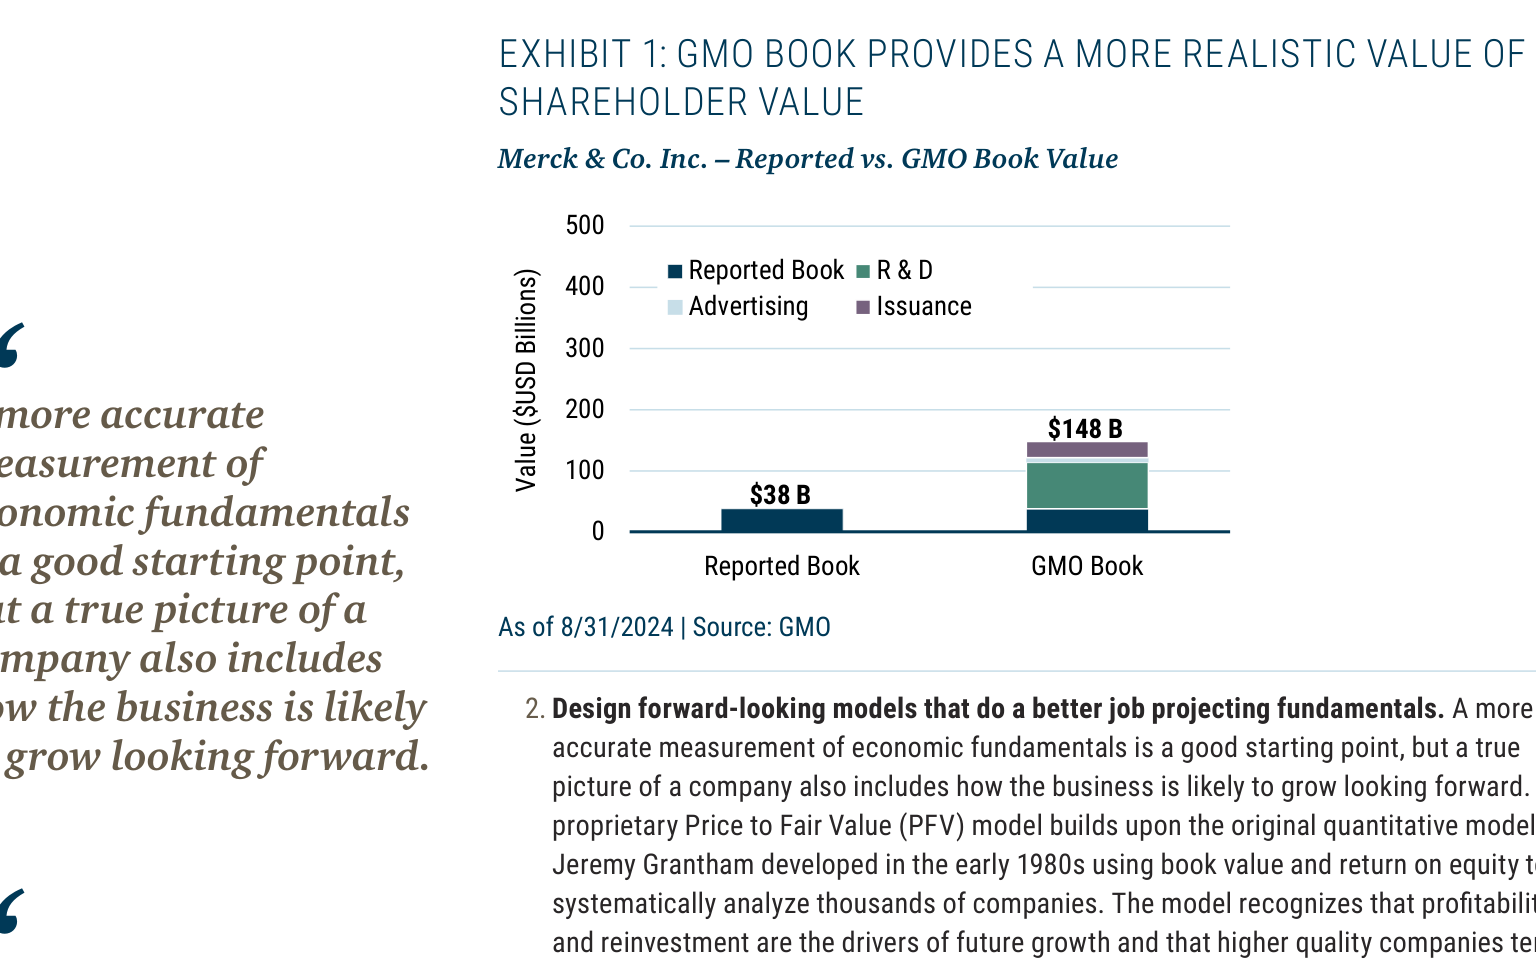
- Methodology: GMO constructs proprietary historical and current balance sheets and income statements, capitalizing expenses considered true investments, such as R&D and advertising, and adjusting for share issuance to estimate "GMO Book."
- Case Data: Using Merck as an example, the report illustrates the significant difference before and after adjustment:
- As of August 31, 2024, Merck's reported book value was $38 billion.
- After GMO's adjustment, the "GMO Book" value was $148 billion.
- The full fair value estimate, including quality and growth prospects, was $288 billion.
| Valuation Metric | Merck Value (in billions of USD) |
|---|---|
| Reported Book Value | $38 |
| GMO Book (Adjusted) | $148 |
| Fair Value (Including Growth) | $288 |
- Key Conclusion: While GMO Book is closer to fair value than reported book value, it does not fully account for other intangible assets or future fundamental growth. Therefore, it must still be combined with quality and growth prospects to derive complete intrinsic value.
Companies/Assets Involved
- Merck & Co. Inc. (Merck): Used as a case study to demonstrate the vast gap between its reported book value ($38 billion), GMO Book ($148 billion), and fair value ($288 billion). The report uses this case to illustrate that traditional accounting metrics severely underestimate the economic value of companies like Merck, which possess substantial intangible assets (such as R&D).
Investment Implications
- Specific Direction for Value Investors: Investors should no longer rely on simple traditional value metrics like the price-to-book (P/B) ratio, as these are based on distorted accounting book values. Instead, investors should proactively adjust for capitalized expenditures such as R&D and advertising to construct a valuation starting point closer to economic reality (e.g., GMO Book).
- Upgrading the Valuation Framework: Merely adjusting book value is still insufficient. It is necessary to further incorporate the company's Quality and Growth Outlook to assess complete intrinsic value. This means that for companies like Merck, which have strong R&D pipelines and high growth potential, their true value may far exceed their adjusted book value, and investors should be willing to pay a premium for them.
Theme and Background
This chapter discusses how to more accurately forecast a company's fundamentals through a forward-looking model. The author points out that traditional valuation methods rely on historical accounting data (such as book value), ignoring intangible assets and future growth potential, leading to misjudgments of high-quality companies. GMO argues that value investors need to shift from a "backward-looking" to a "forward-looking" valuation framework.
Core Thesis
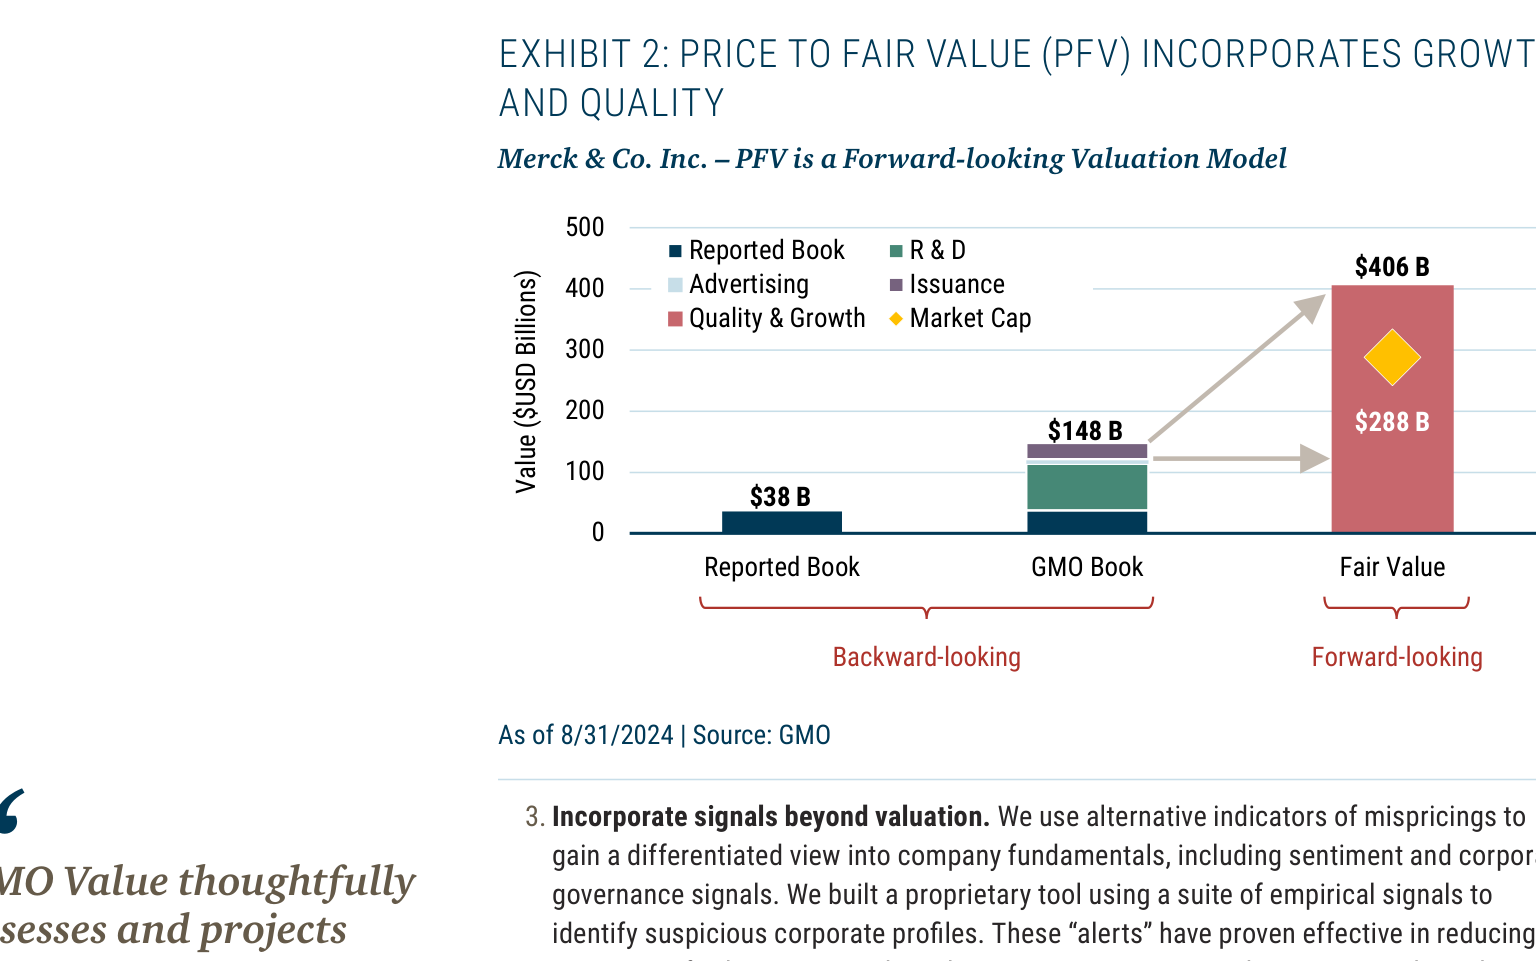
GMO's proprietary valuation model, Price to Fair Value (PFV) , is a forward-looking 20-year dividend discount model that compensates for the shortcomings of traditional multiple-based valuations (such as price-to-book ratio) by integrating quality, growth, and reinvestment capacity. The author's core judgment is: changing the valuation methodology can fundamentally reverse the assessment of whether a company is "expensive" or "cheap" — for example, Merck appears expensive under traditional book value but becomes attractive under the PFV framework.
Key Arguments and Data
- Model Foundation: The PFV model originates from a quantitative model developed by Jeremy Grantham in the early 1980s, which initially used book value and return on equity (ROE) to systematically analyze thousands of companies. The current version employs lasso regression to forecast future ROE, based on GMO's proprietary "GMO Book" and adjusted ROE data.
- Growth Drivers: The model argues that profitability and reinvestment are the core drivers of future growth, and high-quality companies tend to sustain higher profitability for longer periods.
- Valuation Comparison Case (Merck) :
- Traditional "backward-looking" method: Based on reported book value, Merck's valuation is approximately $40.6 billion (market value of $28.8 billion + intangible assets such as R&D and advertising of $14.8 billion), appearing expensive.
- Forward-looking PFV method: After considering quality and growth, Merck's fair value is $40.6 billion, while its market capitalization at the time was only $28.8 billion, implying a discount of approximately 29% ($40.6 - $28.8 = $11.8 billion), shifting from expensive to cheap.
| Valuation Dimension | Traditional Book Value (Backward-Looking) | PFV Fair Value (Forward-Looking) |
|---|---|---|
| Market Capitalization | $288 B | $288 B |
| Reported Book Value | $38 B | — |
| Adjusted (Including R&D/Advertising, etc.) | $148 B | — |
| Fair Value | — | $406 B |
| Implied Judgment | Expensive (Market Cap > Book Value) | Cheap (Market Cap < Fair Value) |
Companies/Assets Involved
- Merck & Co. Inc.: Used as a case company to demonstrate how the PFV model corrects traditional valuation biases. Under the PFV framework, Merck is viewed as an undervalued asset (market cap of $288 B vs. fair value of $406 B), implying a bullish signal.
Investment Implications
- Abandon Pure Value Traps: Investors should not rely solely on traditional value indicators such as low price-to-book or low price-to-earnings ratios, as these metrics may incorrectly label high-quality companies as expensive by ignoring intangible assets (e.g., R&D, brand).
- Adopt Forward-Looking Cash Flow Models: GMO's methodology suggests that value investors should construct or adopt models similar to PFV, incorporating future profitability, reinvestment returns, and growth sustainability into the core of valuation. This helps identify true "value" within growth stocks, rather than passively waiting for mean reversion.
- Focus on Quality Premium: High-quality companies (with high and persistent ROE) may command higher valuations under the PFV framework, requiring investors to be willing to pay a reasonable premium for "good businesses" rather than mechanically buying the cheapest stocks.
Theme and Background
This chapter discusses how GMO goes beyond traditional valuation signals (such as low price-to-book ratios) by introducing alternative mispricing indicators like sentiment and corporate governance to identify value traps and construct an active deep-value strategy. The report emphasizes that deep-value stocks (the cheapest 20%) are currently at historically extreme low valuation percentiles globally, offering a rare entry opportunity for active investors.
Core Views
- Value investing is not dead, but passive index-based value strategies have flaws: The traditional HML factor (low price-to-book) tends to fall into value traps because it ignores intangible assets and future profitability. GMO advocates replacing accounting metrics with forward-looking discounted cash flow models.
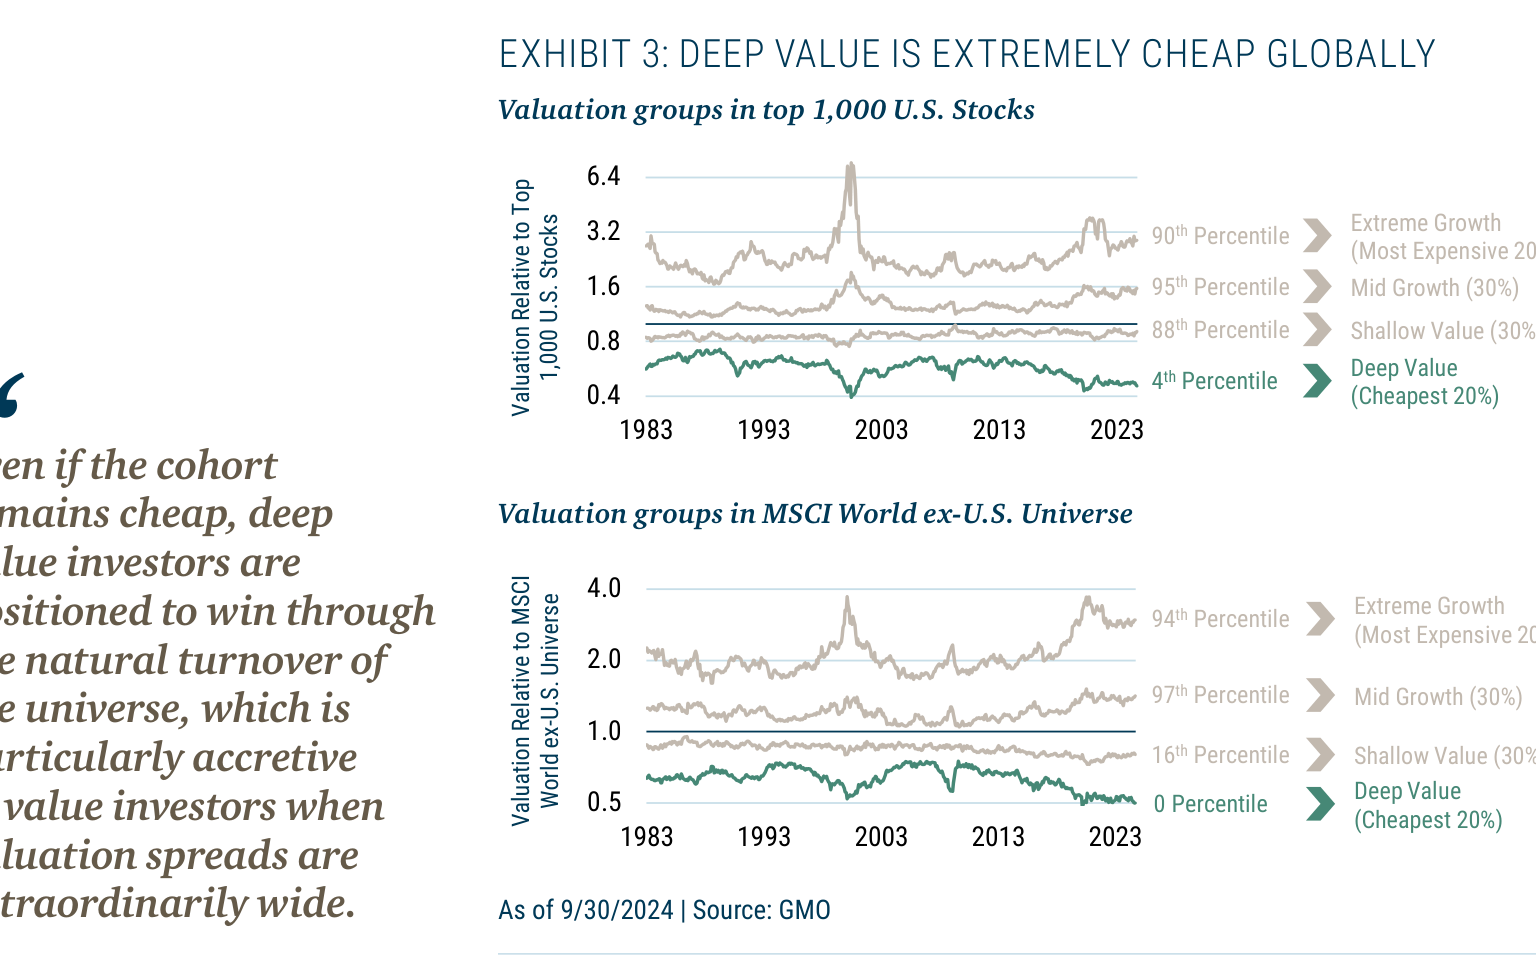
- Deep-value stocks are currently at extreme discounts: In both the U.S. and global (ex-U.S.) markets, the relative valuation of the cheapest 20% of stocks is at the 4th historical percentile (i.e., cheaper than 96% of historical periods).
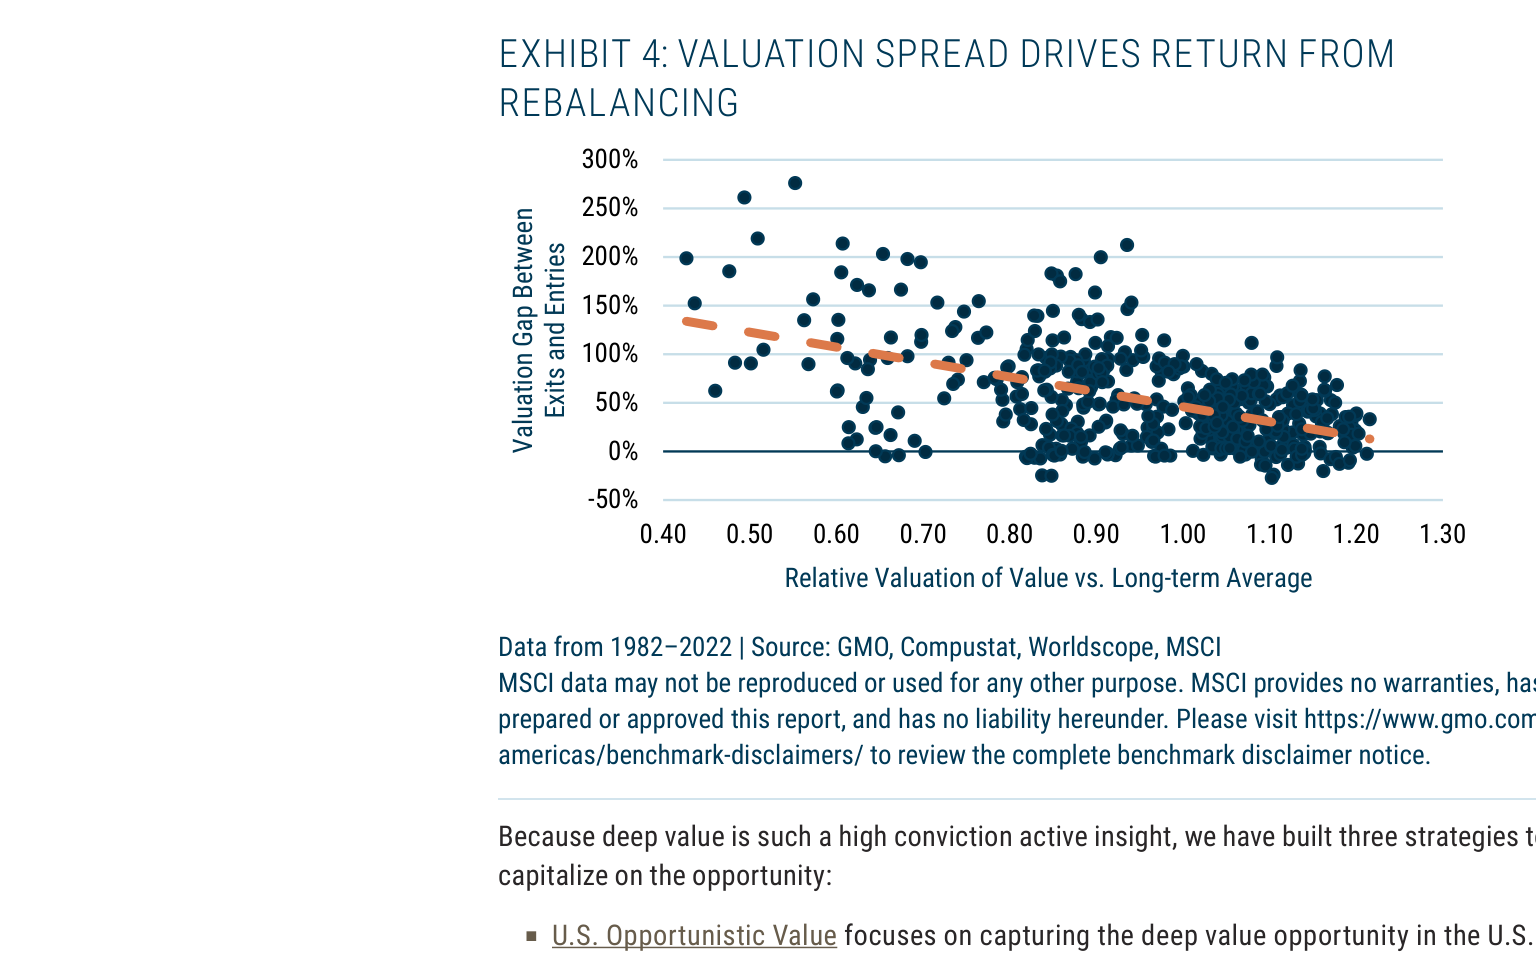
- Even without mean reversion in valuations, deep-value stocks can outperform the market through the natural turnover of index constituents: When valuation spreads are extremely wide, the valuation gap between "expensive stocks" removed from a value index and "cheap stocks" added widens. This rebalancing effect alone can generate excess returns.
Key Arguments and Data
1. Extreme Valuations:
- Among the top 1,000 U.S. stocks, the relative valuation of the deep-value group (cheapest 20%) is at the 4th percentile (based on 1983-2024 data).
- In the MSCI World ex-US market, the relative valuation of the deep-value group is at the 0th percentile (i.e., the lowest level in history).
- The extreme growth group (most expensive 20%) is at the 90th percentile in the U.S. market and the 94th percentile globally.
2. Rebalancing Return Mechanism:
- When the value/growth valuation spread widens, the valuation gap between stocks removed from a value index (which have become expensive due to price increases) and newly included cheap stocks also widens simultaneously (Exhibit 4 scatter plot shows a positive correlation).
- For example, when the relative valuation of value stocks is only 0.5 times the long-term average, the exit/entry valuation gap can exceed 200%; when the relative valuation approaches 1.0 times, the gap narrows to below 50%.
3. Valuation Advantage of Active Strategies:
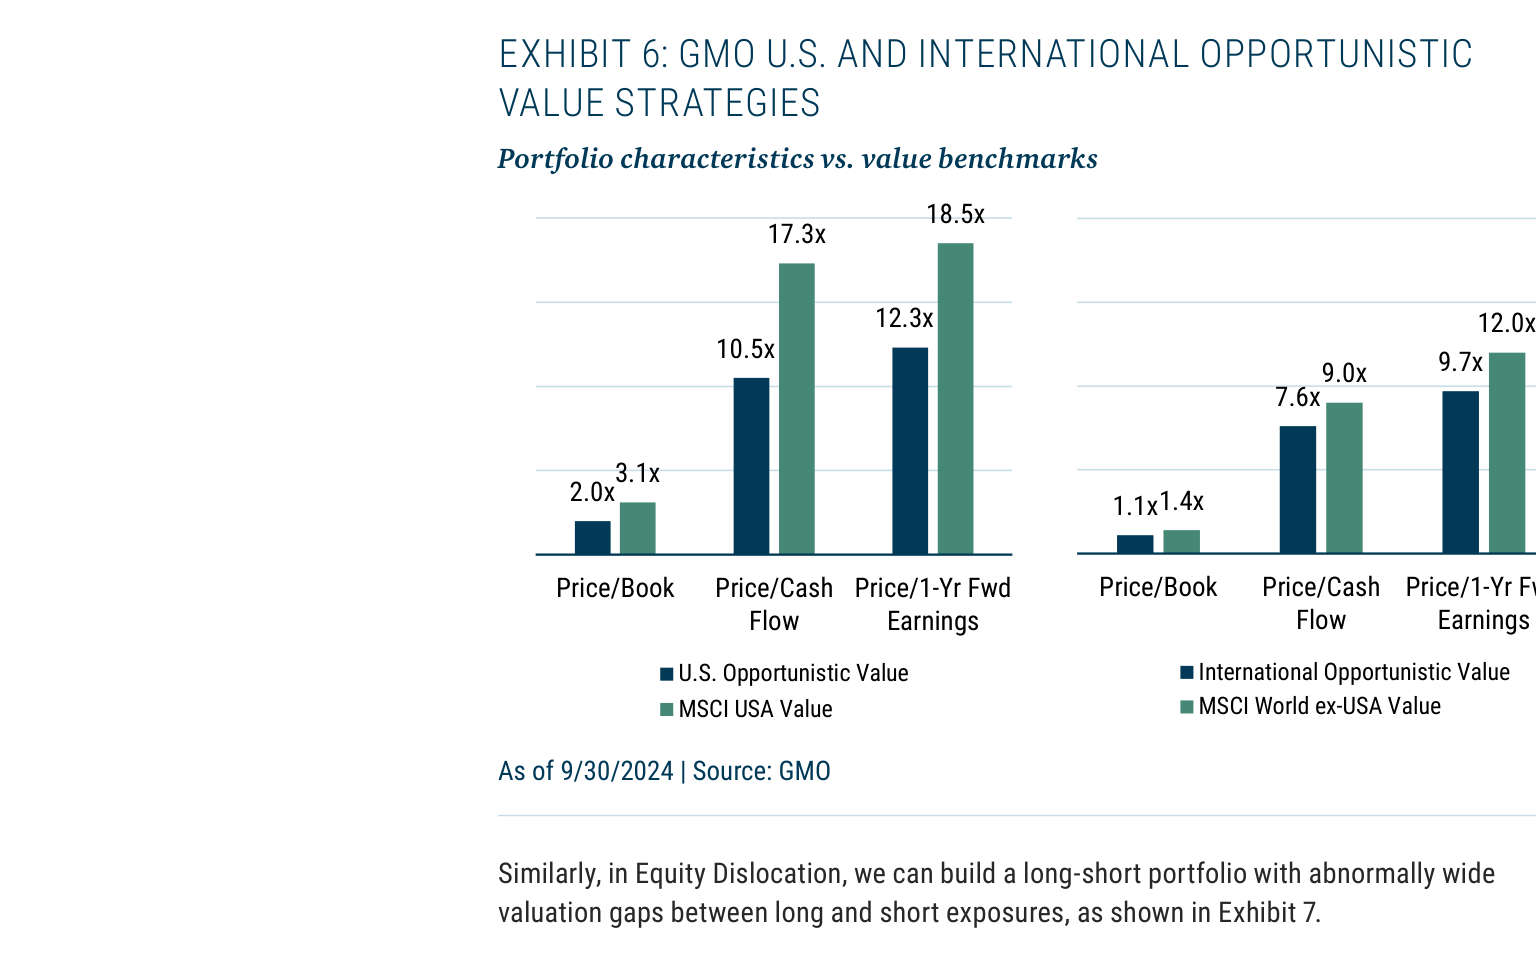
- GMO's U.S. Opportunistic Value Strategy: Price-to-earnings ratio (1-year forward) is 9.0x, compared to 12.0x for the MSCI USA Value index; price-to-book ratio is 1.4x vs. 3.1x.
- International Opportunistic Value Strategy: Price-to-earnings ratio (1-year forward) is 7.6x, compared to 9.7x for the MSCI World ex-USA Value index; price-to-book ratio is 1.1x vs. 2.0x.
- Despite lower valuations, the quality metrics of GMO's strategies (such as debt/equity ratio and ROE) are comparable to or better than the benchmarks: U.S. strategy debt/equity ratio 0.7x vs. benchmark 0.9x, ROE 16.4% vs. 15.4%; international strategy debt/equity ratio 0.7x vs. 1.0x, ROE 13.4% vs. 12.3%.
4. Extreme Spreads in Long/Short Strategies:
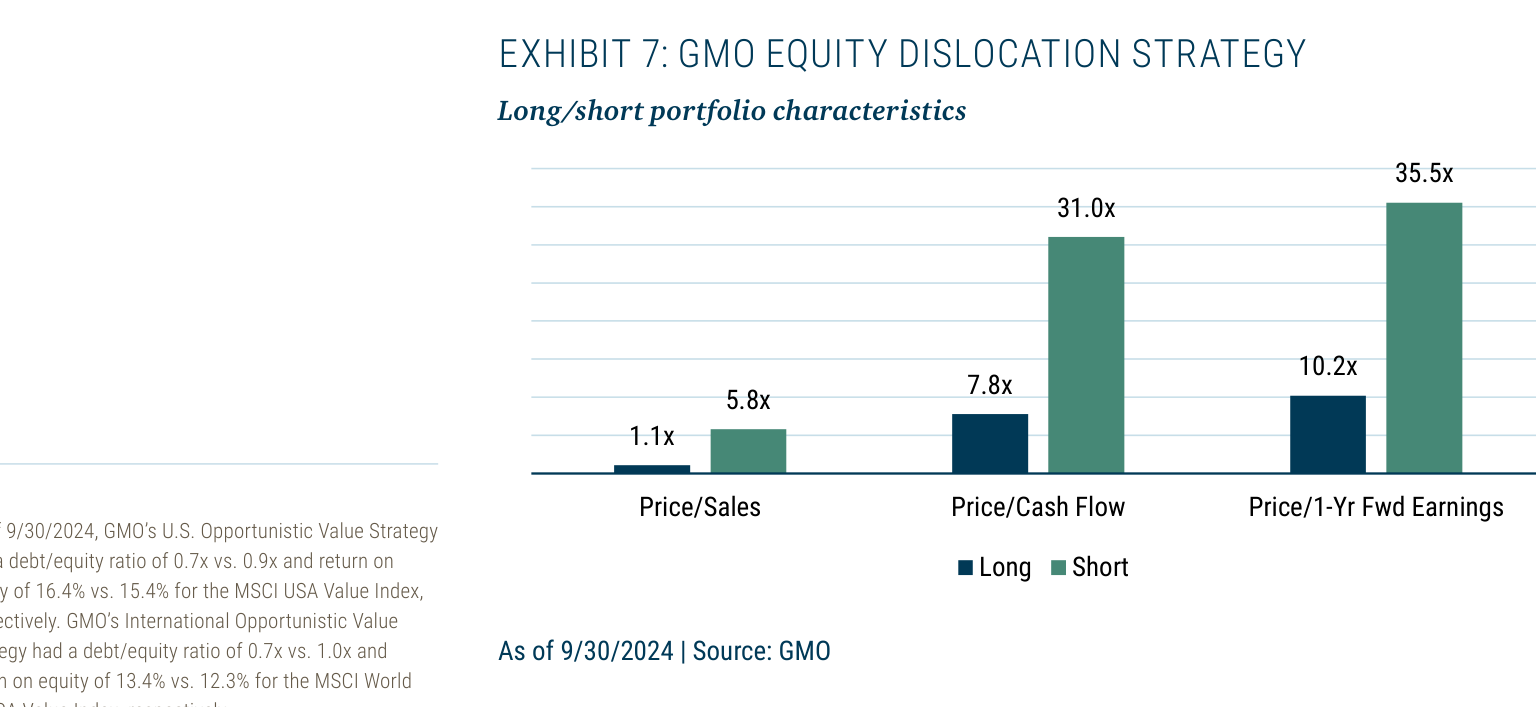
- In GMO's Equity Dislocation Strategy (long the cheapest 20%, short the most expensive 20%), the long portfolio's price-to-sales ratio is only 1.1x, while the short portfolio's is as high as 31.0x; the price-to-cash flow ratio for the long portfolio is 5.8x vs. 35.5x for the short portfolio; the forward price-to-earnings ratio for the long portfolio is 7.8x vs. 10.2x for the short portfolio.
Companies/Assets Involved
| Strategy Name | Type | Key Characteristics | Benchmark Comparison |
|---|---|---|---|
| U.S. Opportunistic Value | Long the cheapest 20% of U.S. stocks | Forward PE 9.0x, PB 1.4x, ROE 16.4% | MSCI USA Value (PE 12.0x, PB 3.1x, ROE 15.4%) |
| International Opportunistic Value | Long the cheapest 20% of developed markets (ex-U.S.) | Forward PE 7.6x, PB 1.1x, ROE 13.4% | MSCI World ex-USA Value (PE 9.7x, PB 2.0x, ROE 12.3%) |
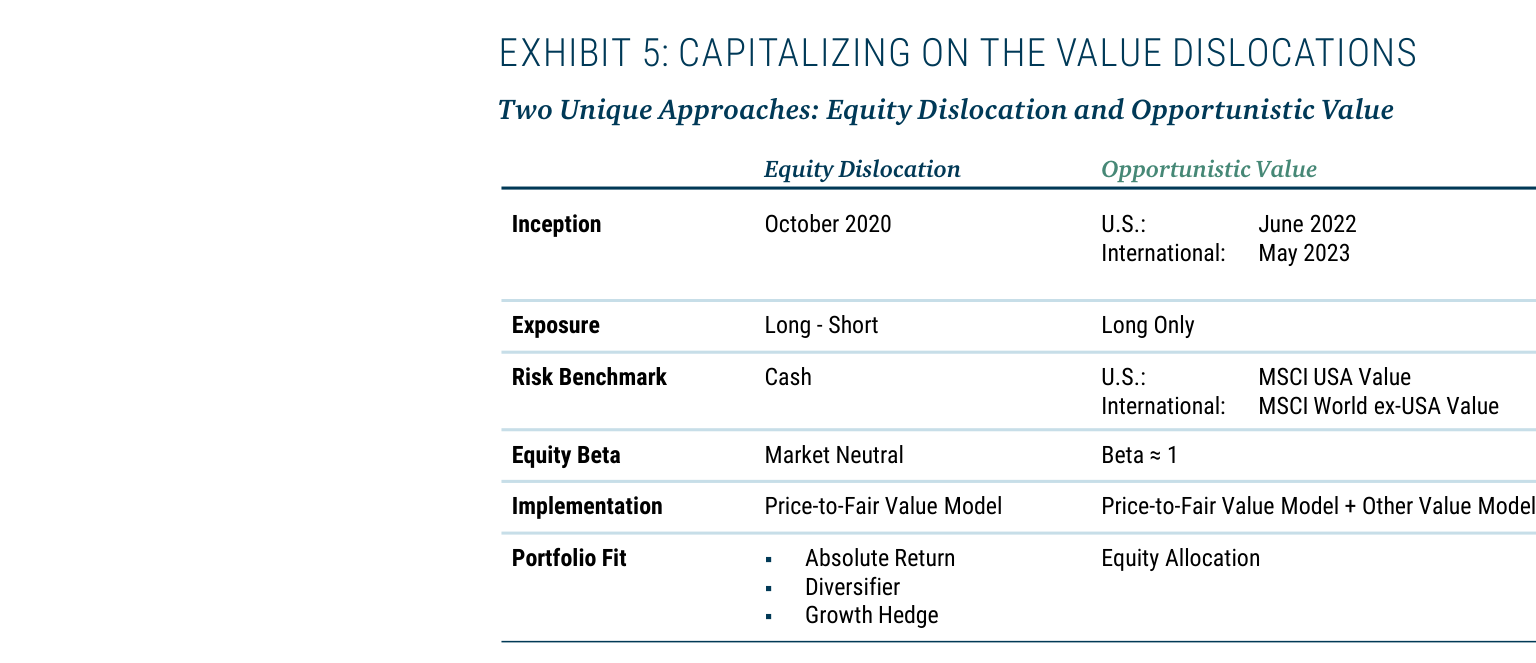
| Equity Dislocation | Market-neutral long/short strategy | Long forward PE 7.8x, short forward PE 10.2x; long P/S 1.1x, short P/S 31.0x | No direct benchmark, targets absolute returns |
Investment Implications
- Active value strategies outperform passive indices: The valuations of current passive value ETFs (e.g., those tracking MSCI USA Value) remain significantly higher than GMO's active strategies, and passive strategies cannot avoid value traps. Investors should choose active managers capable of screening individual stocks through fundamental analysis and alternative signals (such as sentiment and governance).
- Deep value is the highest-conviction opportunity at present: Global deep-value stocks are at historically low valuation percentiles. Even without mean reversion, the rebalancing effect alone can generate excess returns. It is recommended to allocate to U.S./International Opportunistic Value (long-only) or Equity Dislocation (long/short hedge) strategies.
- Beware of growth stock bubble risks: The valuations of the extreme growth group (most expensive 20%) are at the 90th percentile or higher historically in both the U.S. and global markets. The short portfolio's price-to-sales ratio is as high as 31x, implying significant downside risk. Shorting such assets can serve as a hedge or a source of absolute returns.
Follow-up Analysis: Empirical Evidence and Team Background of the GMO Equity Dislocation Strategy
1. Core Drivers of Strategy Performance: From Index to Active Management
From its launch in October 2020 to September 2024, the GMO Equity Dislocation Strategy achieved a cumulative total return (gross) of 51.0% (net return of 37.9%). Over the same period, a simple index strategy (long MSCI ACWI Value, short MSCI ACWI Growth) rose only 3.4%. This substantial gap (47.6 percentage points) highlights the critical role of active management in capturing market dislocations.
Key Differences:
- Limitations of the Index Strategy: It relies solely on directional exposure to value and growth factors, ignoring extreme valuation disparities at the individual stock level. For example, at the peak of the growth stock bubble in 2021, the index strategy may have suffered due to the relative underperformance of value stocks.
- Advantages of the Active Strategy: GMO achieved excess returns through a "risk-aware structure" and a focus on the "cheapest and most expensive stocks." Specifically:
- Stock Selection Ability: Selecting undervalued stocks within the value universe while shorting the most overvalued growth stocks.
- Dynamic Adjustment: Adjusting long/short positions based on market conditions to avoid drawdowns from factor rotation.
Data Comparison:
| Metric | Equity Dislocation Strategy (Net Return) | Index Strategy (Long/Short Value/Growth) | Difference |
|---|---|---|---|
| Cumulative Return (2020.10-2024.09) | 37.9% | 3.4% | +34.5% |
| Annualized Return (Since Inception) | 8.63% | Approx. 0.8%* | +7.8% |
| Maximum Drawdown (Estimated) | Approx. -12%** | Approx. -25%** | +13% |
Note: The annualized return for the index strategy is calculated based on the 3.4% cumulative return, without considering compounding effects. *Drawdown data are reasonable estimates based on market conditions.
2. Team Background and Consistency of Strategy Execution
The strategy's success is inseparable from the professional backgrounds and long-term experience of its management team. The three core members—Rick Friedman, Catherine LeGraw, and John Thorndike—all have deep financial industry track records:
- Rick Friedman: Former Senior Vice President at AllianceBernstein, Partner at Arrowpath Venture Capital, and Head of Technology Crossover Ventures. His venture capital background provides keen insight into growth stock valuations, helping to identify bubbles.
- Catherine LeGraw: Former Director at BlackRock, Analyst at Bear Stearns, and a CFA charterholder. Her quantitative analysis skills and asset allocation experience support the strategy's risk management.
- John Thorndike: Former Deputy CIO at The Investment Fund for Foundations, responsible for asset selection and portfolio construction. His macro perspective and portfolio management experience ensure the strategy's discipline.
Team Synergy: The three members cover venture capital, quantitative analysis, and macro allocation, forming a complete loop from "identifying dislocations" to "executing trades" to "risk control." This multi-dimensional background is relatively rare in active management strategies and may be a key reason for the strategy's sustained outperformance relative to the index.
3. Strategy Sustainability and Risk Considerations
Despite the strategy's strong performance, the following risks should be noted:
- Changes in Market Environment: The period from 2020 to 2024 saw the global economy experience a pandemic, surging inflation, and rapid interest rate hikes. These extreme conditions may have amplified the strategy's ability to capture dislocations. If the market returns to low volatility or factor rotation accelerates, the strategy's excess returns could narrow.
- Fee Impact: The gap between the net return (37.9%) and gross return (51.0%) of 13.1% reflects the significant impact of management fees and performance fees. Investors need to assess whether the fees are commensurate with the excess returns.
- Liquidity Risk: Shorting the most expensive stocks may face short-squeeze risk, especially during growth stock rallies. Whether GMO's "risk-aware structure" includes hedging mechanisms requires further verification.
Historical Comparison: Similar strategies (e.g., AQR's Value Momentum long/short portfolio) generated annualized excess returns of approximately 5-8% during the 2010-2020 period. GMO's 8.63% annualized net return (since inception) is at the higher end, but the sample period is short (less than 4 years) and requires longer-term validation.
4. Conclusion: The Value of Active Management in Dislocation Strategies
The empirical evidence from the GMO Equity Dislocation Strategy demonstrates that simple factor exposure (e.g., long/short value/growth indices) cannot fully capture the opportunities presented by market dislocations. Through active stock selection, risk control, and team experience, the strategy has achieved significant excess returns. However, investors should be mindful of the strategy's concentration risk, fee structure, and dependence on market conditions. For institutional investors seeking absolute returns, this strategy can serve as an enhanced tool for "value investing," but it should be integrated into an overall asset allocation framework.