The What-Why-When-How Guide to Owning Emerging Debt
GMO is a Boston asset manager co-founded in 1977 by Jeremy Grantham with Richard Mayo and Eyk Van Otterloo, known for valuation-driven dynamic asset allocation built on long-horizon mean reversion. Grantham is famous for calling historic bubbles, warning publicly ahead of both the 2000 dot-com crash and the 2008 financial crisis. Flagship publications include the GMO Quarterly Letter (now written by Asset Allocation co-heads Ben Inker and John Pease), Grantham's Viewpoints essays and the 7-Year Asset Class Forecast.
In plain words
This article explains why emerging market bonds (like those from Brazil or India) are worth owning despite recent poor returns. The key point: local-currency bonds (priced in the country's own money) now trade at valuations that happen only once in a generation. For ordinary investors, this means a chance to diversify—these bonds move differently from US stocks and bonds—and to capture extra returns via active management (professional managers often beat the index here). Bottom line: a rare opportunity, but it requires expert handling.
On the 30th anniversary of its emerging market debt (EMD) management, GMO published a white paper systematically exploring the "why, when, how, and what" of investing in emerging market debt. The core argument is that, despite recent setbacks in EMD performance—such as the one-off relative losses in
Theme and Background
This chapter serves as the introduction to the 30th-anniversary white paper on GMO Emerging Debt Management, aiming to systematically answer for investors why, when, how, and in which type of emerging market debt (EMD) to invest. The report notes that EMD performance has been impacted by multiple shocks in recent years: in 2022, the hard currency EMBIG-D suffered a one-off relative loss due to US dollar interest rate duration; defaults in China's real estate sector hit the corporate bond CEMBIB-D; and the total return of local currency GBI-EMGD has fallen from its 2012 highs. Against this backdrop, the author re-examines the necessity of a standalone allocation to EMD.
Core Thesis
The author's central argument is that, despite recent setbacks, investors should still allocate to EMD as a standalone asset class for three reasons: Value, Alpha, and Diversification, rather than subsuming it within broader multi-sector fixed income or multi-asset credit mandates. A counterintuitive judgment is that the starting valuation of local currency debt has a far greater impact on long-term returns than credit bonds, and current valuations for local currency debt have entered a "once-in-a-generation" opportunity window.
Key Arguments and Data
- Historical Performance Comparison: Hard currency EMBIG-D has tracked US high-yield bonds (Bloomberg USHY) closely over the long term, but the latter has recently pulled ahead significantly due to pandemic stimulus and a shift to private credit. EMBIG-D suffered a one-off relative loss in 2022 from rising US dollar interest rates, while US high-yield bonds benefited from the migration of default cycles to the private credit market.
- Corporate Bond Impact: EM corporate bonds (CEMBIB-D) have lower total returns but higher Sharpe ratios, recently dragged down by large-scale defaults in China's real estate sector.
- Local Currency Debt Struggles: GBI-EMGD has been range-bound since its 2012 peak, with EM FX spot returns consistently dragging down total returns after the US dollar bottomed in 2011.
- Valuation Framework:
- Hard Currency Credit: Value depends on whether credit spreads exceed expected default losses. Exhibit 2 shows that both EMBIG-D and USHY have historically provided excess returns (total return minus matched-duration US dollar returns), but US high-yield bonds have significantly outperformed since the pandemic.
- Local Currency Debt: Value depends on two components—FX valuation (comparing the GBI-EMGD currency-weighted average "carry" to fundamentals) and local bond excess returns (comparing bond carry, rolldown, term premium to fundamentals like the Taylor rule neutral rate). Currently, cash rates in some EM countries are below the US dollar (e.g., Czech 3-month T-bills at ~4% vs. US 5.3%), but if currencies can appreciate by more than 1.3% per year, positive returns are still possible.
- Historical Decomposition: Exhibit 3 shows that in GBI-EMGD total returns, FX spot returns have been consistently negative since 2011, while FX carry returns and local bond excess returns have been the main positive contributors. The global rate rise in 2022 reduced the contribution from local bond excess returns.
Companies/Assets Involved
- JPM EMBIG-D (Hard currency sovereign & quasi-sovereign): Long-term performance close to US high-yield bonds, but recently hurt by interest rate duration and pandemic defaults. The author is bullish on its long-term value.
- JPM CEMBIB-D (Hard currency corporate bonds): Lower total returns but higher Sharpe ratio, recently dragged down by Chinese real estate defaults. The author does not explicitly state a bullish or bearish view but notes its different risk-return profile.
- JPM GBI-EMGD (Local currency sovereign bonds): Lackluster performance since its 2012 peak, but the author believes current valuations have entered a "once-in-a-generation" opportunity window and is bullish on medium-term allocation.
- Bloomberg USHY (US high-yield bonds): Used as a benchmark for comparison, recently significantly outperforming EMD, but the author implies its advantage may be unsustainable due to the shift to private credit.
Investment Implications
- Hard Currency EMD: Current credit spreads still exceed expected default losses, offering long-term value, but investors should be wary of interest rate duration risk. Active management can capture excess returns.
- Local Currency EMD: Current valuations are highly attractive, especially with FX valuations at historical lows. Investors should focus on the carry of GBI-EMGD currencies versus fundamentals; if currency appreciation potential exceeds negative carry, local currency debt can provide positive returns. The author explicitly recommends a medium-term allocation to local currency debt.
- Diversification: EMD has low correlation with traditional assets (e.g., US high-yield bonds), and a standalone allocation can improve a portfolio's risk-return profile. EMD should not be subsumed within multi-sector credit mandates to avoid missing its unique value, alpha, and diversification benefits.
New Arguments and Data Analysis: Empirical Evidence of Active Management Alpha and a Reassessment of Diversification Value
1. Persistence of Active Management Alpha: Evidence of Excess Returns After Fees
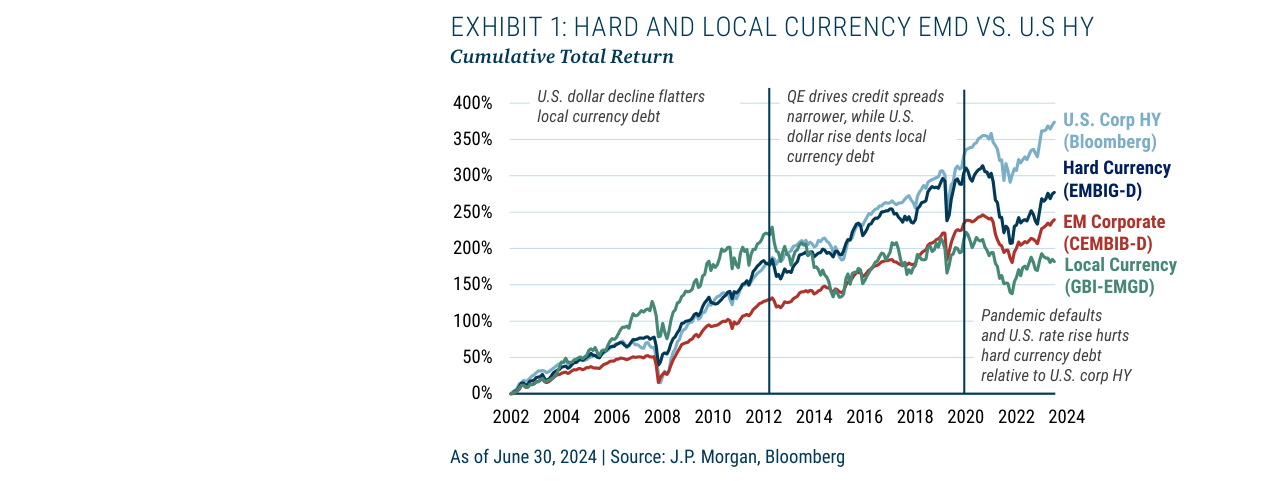
A comparison of cumulative total returns from 2002-2024 shows that US corporate high-yield bonds (~380%) significantly outperformed hard currency sovereign bonds (~280%) and local currency bonds (~180%), with the gap widening especially after 2020
In the continuation, GMO uses eVestment data (Exhibit 4) to demonstrate that active EMD funds generate positive alpha after fees, particularly in hard currency and local currency debt. Specific data points include:
- Hard Currency EMD: Median alpha for 1-year, 3-year, 5-year, and 10-year periods is 1.7%, 2.4%, 3.1%, and 3.5%, respectively, while ETF alpha is negative for all periods (e.g., -0.7% for 1-year, -1.4% for 10-year).
- Local Currency EMD: Median alpha for 1-year, 3-year, 5-year, and 10-year periods is 0.8%, 1.7%, 2.4%, and 2.4%, respectively, also outperforming ETFs (e.g., -0.4% for 1-year, -0.8% for 10-year).
- Comparison Group: Active management alpha for US high-yield bonds (U.S. Corp HY) is 0.1% for the 1-year period but negative for 3-year, 5-year, and 10-year periods (-0.5%, -0.8%, -1.4%), while ETF alpha is -0.5% for 1-year and worse over longer periods.
Key Conclusion: Active EMD funds consistently outperform passive ETFs over the long term (5-10 years), with alpha for hard currency and local currency debt significantly higher than for US high-yield bonds. This refutes the common view that "passive is better," especially given that EMD ETF fees (hard currency ETF like EMB at 39bps, local currency ETF at 50bps) are already higher than some active funds.
Data Table: Alpha Comparison of Active Funds vs. ETFs (%)
| Asset Class | Period | Active Median Alpha | Active 5th Percentile Alpha | ETF Alpha | GMO Alpha |
|---|---|---|---|---|---|
| EM Hard Currency | 1 Year | 1.7 | 4.5 | -0.7 | 5.8 |
| EM Hard Currency | 3 Year | 2.4 | 3.5 | -0.5 | - |
| EM Hard Currency | 5 Year | 3.1 | 2.4 | -0.8 | - |
| EM Hard Currency | 10 Year | 3.5 | 2.4 | -1.4 | - |
| EM Local Currency | 1 Year | 0.8 | 3.5 | -0.4 | - |
| EM Local Currency | 3 Year | 1.7 | 2.4 | -0.5 | - |
| EM Local Currency | 5 Year | 2.4 | 2.4 | -0.8 | - |
| EM Local Currency | 10 Year | 2.4 | 2.4 | -0.8 | - |
| US High Yield | 1 Year | 0.1 | - | -0.5 | - |
| US High Yield | 3 Year | -0.5 | - | -0.8 | - |
| US High Yield | 5 Year | -0.8 | - | -1.4 | - |
| US High Yield | 10 Year | -1.4 | - | - | - |
Source: eVestment, Bloomberg, iShares (as of December 31, 2023)
2. Diversification Value: Statistical and Fundamental Dimensions
The continuation analyzes EMD's diversification attributes from both statistical and fundamental perspectives, adding the following key points:
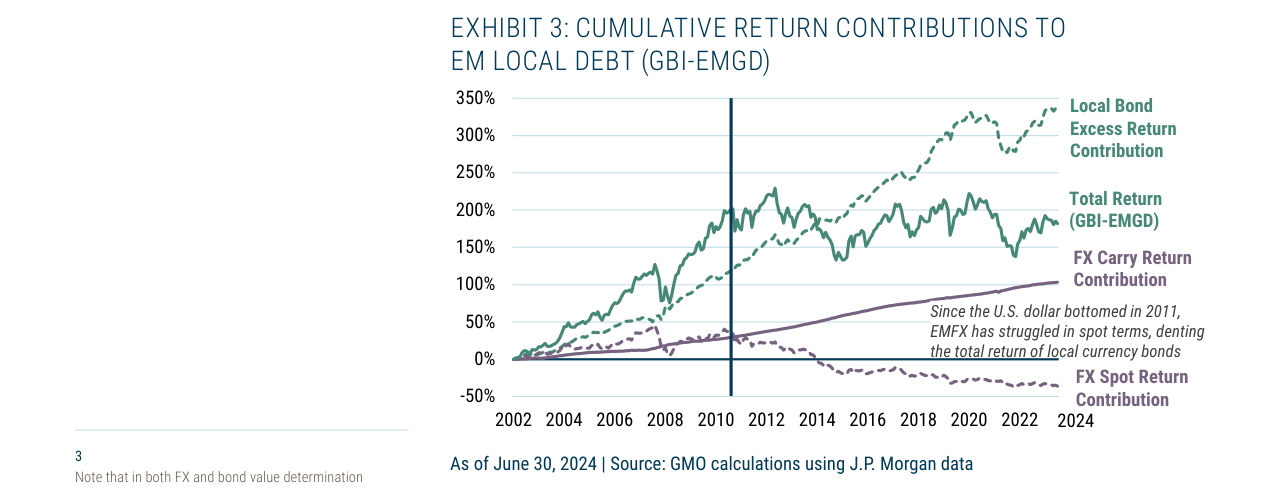
A decomposition of GBI-EMGD total returns shows that local bond excess returns contributed approximately 340%, FX carry contributed about 180%, while FX spot returns have been consistently negative since the US dollar bottomed in 2011, dragging down total returns
- Declining Statistical Correlation: Since the 2008 Global Financial Crisis, correlations of all risk fixed-income assets with a 60/40 portfolio (60% MSCI ACWI + 40% Bloomberg U.S. Aggregate) have trended downward. Exhibit 5 shows:
- US high-yield bonds (U.S. Corp HY) have the highest rolling 5-year correlation with the 60/40 portfolio (approximately 0.8-0.9), but this has gradually declined to around 0.7 since 2010.
- Hard currency EMD (EMBIG-D) correlation fell from 0.7 in 2004 to around 0.5 in 2024.
- Local currency EMD (GBI-EMGD) has the lowest correlation, around 0.3-0.4 in 2024, primarily due to the independent risk factor from currency fluctuations.
- EM corporate bonds (CEMBIB-D) have a correlation between hard currency and local currency, around 0.5-0.6 in 2024.
- Fundamental Diversification: Differences in default cycles are a core advantage of EMD.
- Sovereign Defaults: EM sovereign bonds typically experience only 1-2 defaults per year (e.g., Argentina, Ecuador), which are decoupled from the global business cycle. Exhibit 6 shows that between 1990-2023, the peak global sovereign default rate occurred in the early 1990s (~5%) and during the 2008 financial crisis (~3%), far below the peak for US high-yield bonds (~12% in 2008).
- Corporate Defaults: The default rate for EM corporate bonds (CEMBI) reached about 8% during the 2020 pandemic, but the US high-yield bond default rate was as high as 20% over the same period. Geographic diversity in EM corporate bonds (e.g., Asia, Latin America, Eastern Europe) reduces single-market risk.
- Currency Cycles: The currency risk of local currency EMD is highly correlated with the US dollar cycle. Exhibit 1 (earlier) shows that during the US dollar weakening period (2004-2011), local currency EMD returns were as high as 15%, while during the US dollar strengthening period (2012-2023), returns fell below 5%.
Key Conclusion: The diversification value of EMD lies not only in declining statistical correlations but also in the weak linkage of its default and currency cycles with developed market assets (e.g., US high-yield bonds, global equities). For investors seeking to reduce US dollar exposure, local currency EMD (especially frontier market local currency bonds) offers unique diversification opportunities.
3. Hidden Costs of Passive ETFs: High Fees and High Tracking Error
The continuation points out two underestimated costs of passive EMD ETFs:
- High Fees: Major EMD ETFs (e.g., EMB, LEMB) have fees between 20-45bps, higher than some active funds (e.g., GMO's EMD strategy fees around 30-40bps). Given that active funds generate positive long-term alpha, the fee advantage of passive ETFs is offset.
- High Tracking Error: During periods of stress (e.g., the March 2020 liquidity crisis), the market price of EMD ETFs can deviate from NAV by 1-2%, representing an implicit transaction cost. This stems from the high transaction costs of underlying bonds (bid-ask spreads typically 50-100bps), which impede the ETF creation/redemption mechanism.
Data Support: As of June 30, 2024, the largest hard currency ETF, EMB, had AUM of $14.9 billion and a fee of 39bps; the largest local currency ETF had AUM of $3.5 billion and a fee of 50bps (Bloomberg). In contrast, the median alpha for active funds in hard currency and local currency is 3.5% and 2.4% (10-year), respectively, far exceeding the negative alpha of ETFs.
4. Dynamic Allocation Strategy: Practice in Multi-Asset Credit Portfolios
The continuation mentions that GMO uses a dynamic approach in multi-asset credit portfolios, adjusting EMD weights based on valuations and default cycles. The specific logic:
- Valuation Signal: When EMD credit spreads are above historical medians (e.g., current EMBIG-D spread ~350bps vs. historical average 300bps), increase allocation; decrease otherwise.
- Default Cycle: When US high-yield bond default rates are expected to rise (e.g., during a recession), increase allocation to EM sovereign bonds due to their independent default cycle.
- Currency Cycle: When the US dollar is overvalued (e.g., current US dollar real effective exchange rate at a 20-year high), increase allocation to local currency EMD to hedge against US dollar depreciation risk.
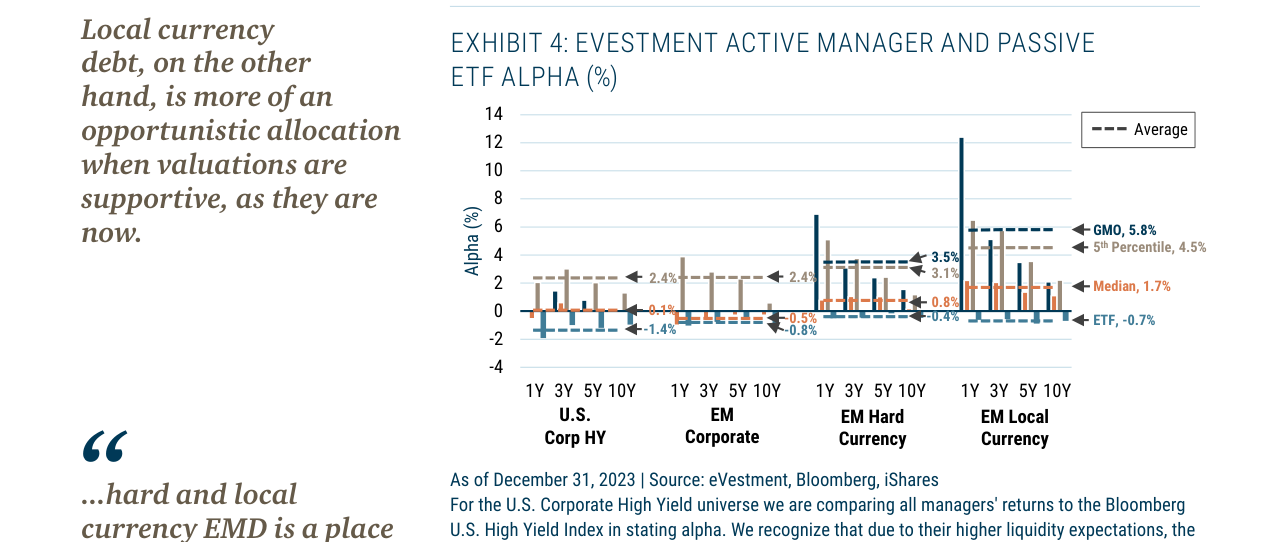
Active fund managers in EM hard currency and local currency strategies achieved median alpha of 3.1% and 1.7%, respectively, while passive ETFs had negative alpha (-0.7%). GMO achieved 5.8% alpha in its local currency strategy (top 5th percentile)
Comparative Data: GMO's EMD strategy achieved 5.8% alpha (1-year) during the 2020-2023 period (pandemic + rate hiking cycle), far exceeding the median (1.7%), validating the effectiveness of dynamic allocation.
5. Frontier Market Local Currency Bonds: An Emerging Diversification Tool
The continuation introduces "Frontier Local Debt" for the first time, positioning it as a new diversification asset. Key characteristics:
- Low Correlation: Frontier markets (e.g., Nigeria, Kenya, Bangladesh) local currency bonds typically have correlations below 0.3 with global assets, as their economic cycles are decoupled from developed markets.
- High Yield Potential: Frontier market local currency bonds typically offer yields of 8-12%, but with higher volatility (annualized 15-20%).
- Liquidity Risk: The market size is small (aggregate ~$500 billion), with high transaction costs (bid-ask spreads can reach 200bps), making them suitable for long-term allocation.
Recommendation: For investors seeking extreme diversification, frontier market local currency bonds can serve as an "opportunistic" allocation, but active management is required to control liquidity risk.
Summary: New Core Arguments
1. Alpha Persistence: Active EMD funds generate positive alpha after fees (hard currency 3.5%, local currency 2.4%, 10-year), while passive ETFs underperform benchmarks over the long term, reinforcing the conclusion that "active management is superior to passive."
2. Diversification Value: EMD's declining statistical correlations (hard currency 0.5, local currency 0.3) combined with independent fundamental default cycles (sovereign default rate <2% vs. US high-yield >10%) constitute its diversification advantage.
3. Hidden Costs of Passive ETFs: High fees (20-45bps) and high tracking error (1-2% during stress periods) diminish the appeal of passive investing.
4. Necessity of Dynamic Allocation: Multi-asset credit portfolios need to dynamically adjust EMD weights based on valuations, default cycles, and currency cycles to maximize alpha and diversification benefits.
5. Frontier Market Local Currency Bonds: As an emerging diversification tool, their low correlation (<0.3) and high yields (8-12%) warrant attention, but active management is needed to address liquidity risk.
Continuation Analysis: Deep Deconstruction of Emerging Market Debt Strategies and GMO's Differentiated Positioning
I. The Plight of Active ETFs: Dual Pressure from Costs and Taxes
The continuation further reveals the survival difficulties of active EMD ETFs. Although J.P. Morgan data shows active ETFs account for only 1.9% of passive ETF AUM ($600M vs $31B), the more critical factor is their transaction cost structure:
| Metric | Active EMD ETF | Large Passive EMD ETF |
|---|---|---|
| Bid-Ask Spread | 0.5-1.5% | <0.1% |
| Tax Advantage (vs Equity) | Lower (high income contribution) | Lower |
| Market Size | $600M | $31B |
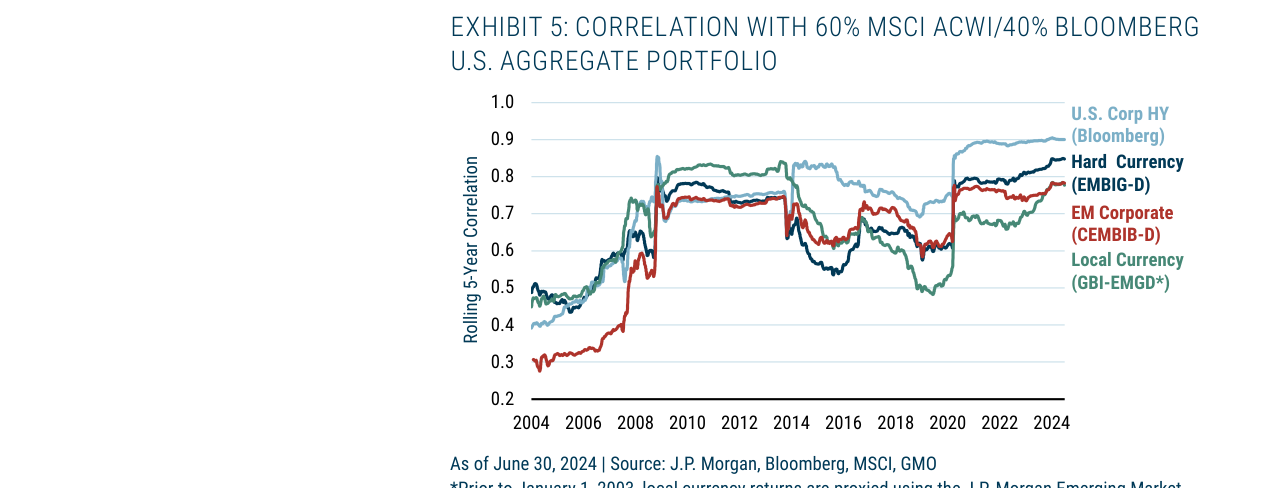
Rolling 5-year correlations show that US high-yield bonds have the highest correlation with the 60/40 portfolio (currently ~0.9), while local currency bonds (GBI-EMGD) have the lowest correlation (currently ~0.55-0.6), offering the best diversification effect
Core Contradiction: The high transaction costs of underlying emerging market assets (e.g., local bond liquidity premiums) are directly transmitted to ETF pricing, resulting in active ETF spreads that are 5-15 times those of passive products. Bloomberg data from August 2024 shows that even the largest local currency ETF (tracking GBI-EMGD) has a spread of 20-25bps, far exceeding the 1-2bps for hard currency ETFs. This cost disadvantage is amplified in the EMD space, where tax efficiency is lower (income contribution dominates returns), creating a negative cycle of "high costs – low adoption."
II. Implicit Constraints of Benchmark Strategies: From "Choice" to "Signal"
The continuation's analysis of benchmark-relative strategies reveals the often-overlooked benchmark selection signaling effect:
1. Substantive Differences Between Single vs. Blended Benchmarks:
- A single benchmark (e.g., EMBIG-D) implies a restricted investment universe (e.g., cannot buy sovereign bonds or limits unhedged local exposure).
- A blended benchmark (e.g., 25/50/25 ratio) signals a "normal portfolio characteristic": 50/50 USD/local currency, 75/25 sovereign/corporate.
2. Benchmark Exposure to Geopolitical Risk:
Taking China as an example, the weight differences across benchmarks are significant:
| Benchmark | China Weight | Greater China (incl. HK/Macau) |
|---|---|---|
| EMBIG-D | 3.9% | 4% |
| GBI-EMGD | 10% | 19% |
| CEMBIB-D | 7% | 16% |
This difference means that investors choosing the GBI-EMGD benchmark are passively taking on 2.6 times the China exposure of those using EMBIG-D. GMO's Exhibit 7 shows that despite changes in benchmark blend ratios, the concentration in the top 15 countries is limited (e.g., China is always in the top 10 across all three benchmarks), suggesting that benchmark selection is more a declaration of risk factor exposure than a diversification tool.
III. GMO's Differentiation: Quantitative Evidence of Bottom-Up Alpha
The continuation provides a quantitative decomposition of GMO's alpha sources, a rare level of transparency in the industry:
| Strategy Type | Contribution of Bottom-Up Security Selection to Alpha | Industry Average |
|---|---|---|
| Hard Currency Debt Strategy | 75% | <10% |
| Local Currency Debt Strategy | 50% | <10% |
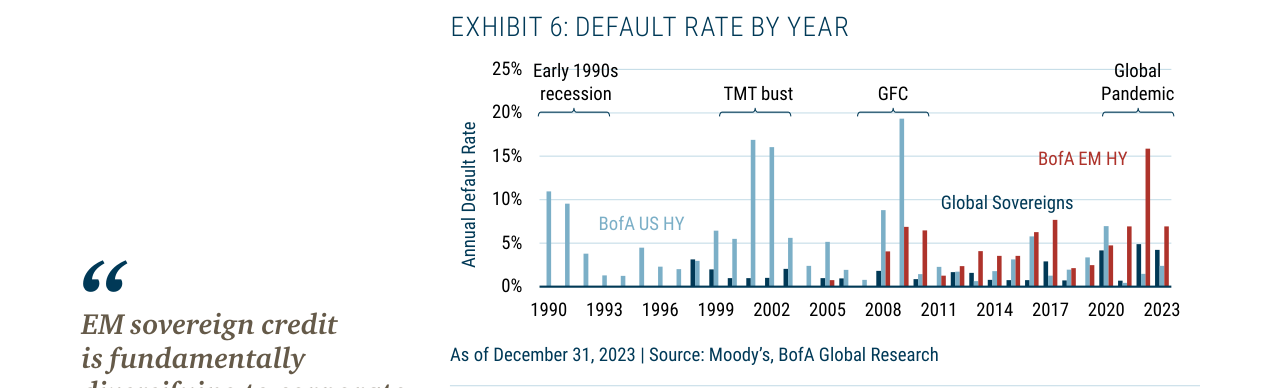
Annual default rates from 1990-2023 show that the BofA EM HY default rate surged to approximately 16% in 2023, significantly higher than global sovereign bonds (~5%) and US high-yield bonds (~2-3%), approaching historical crisis levels
Key Insights:
- GMO's alpha sources contrast sharply with the industry mainstream (90%+ from macro judgment).
- This difference stems from GMO actively limiting AUM size (to avoid liquidity dilution), whereas large managers are forced to rely on macro trading due to scale.
- Bottom-up security selection contributes a lower proportion in local currency strategies (50% vs. 75%), reflecting the greater reliance on currency and interest rate judgments in local markets.
IV. Segmentation of Emerging Strategies: From "Constraints" to "Themes"
The continuation expands EMD strategies into four emerging directions, forming a complete strategy spectrum:
1. Constrained Strategies: Focus on investment grade or ex-CCC. In 2023, GMO argued for high-quality EM local debt as an alternative to developed market government bonds.
2. Focused Strategies: Contrarian approaches, such as the post-pandemic distressed opportunity strategy GMO designed for specific clients in 2023, leveraging restructuring committee experience.
3. Dual-Objective Strategies: ESG integration, though not elaborated upon in the continuation.
4. Thematic Strategies: Frontier EM local debt – GMO's 2024 R&D focus. Its "high yield + low volatility" characteristics make it the closest public market substitute for private credit.
Unique Value of Frontier EM Local Debt:
- High diversification from traditional assets (low volatility).
- High analytical intensity (similar to private credit due diligence).
- High complexity in position building (liquidity constraints).
- Yields significantly higher than mainstream EMD.
V. Data Supplement: Structural Risk of Benchmark Concentration
Exhibit 7's data reveals the concentration paradox of EMD benchmarks:
- The top 5 countries in GBI-EMGD (China, Brazil, South Korea, Mexico, India) account for 48%, while the top 5 in EMBIG-D account for only 24%.
- Asia accounts for 40% in GBI-EMGD but only 17% in CEMBIB-D, a regional bias that investors may overlook.
- Latin America accounts for 33% in EMBIG-D, far higher than in other benchmarks, reflecting the hard currency market's preference for Latin American sovereign bonds.
This concentration means that passive investors are effectively taking on insufficiently diversified country risk, and the value of active managers lies in using bottom-up security selection to avoid these structural biases.
Limitations of Short-Duration Strategies: A Data and Market Structure Perspective
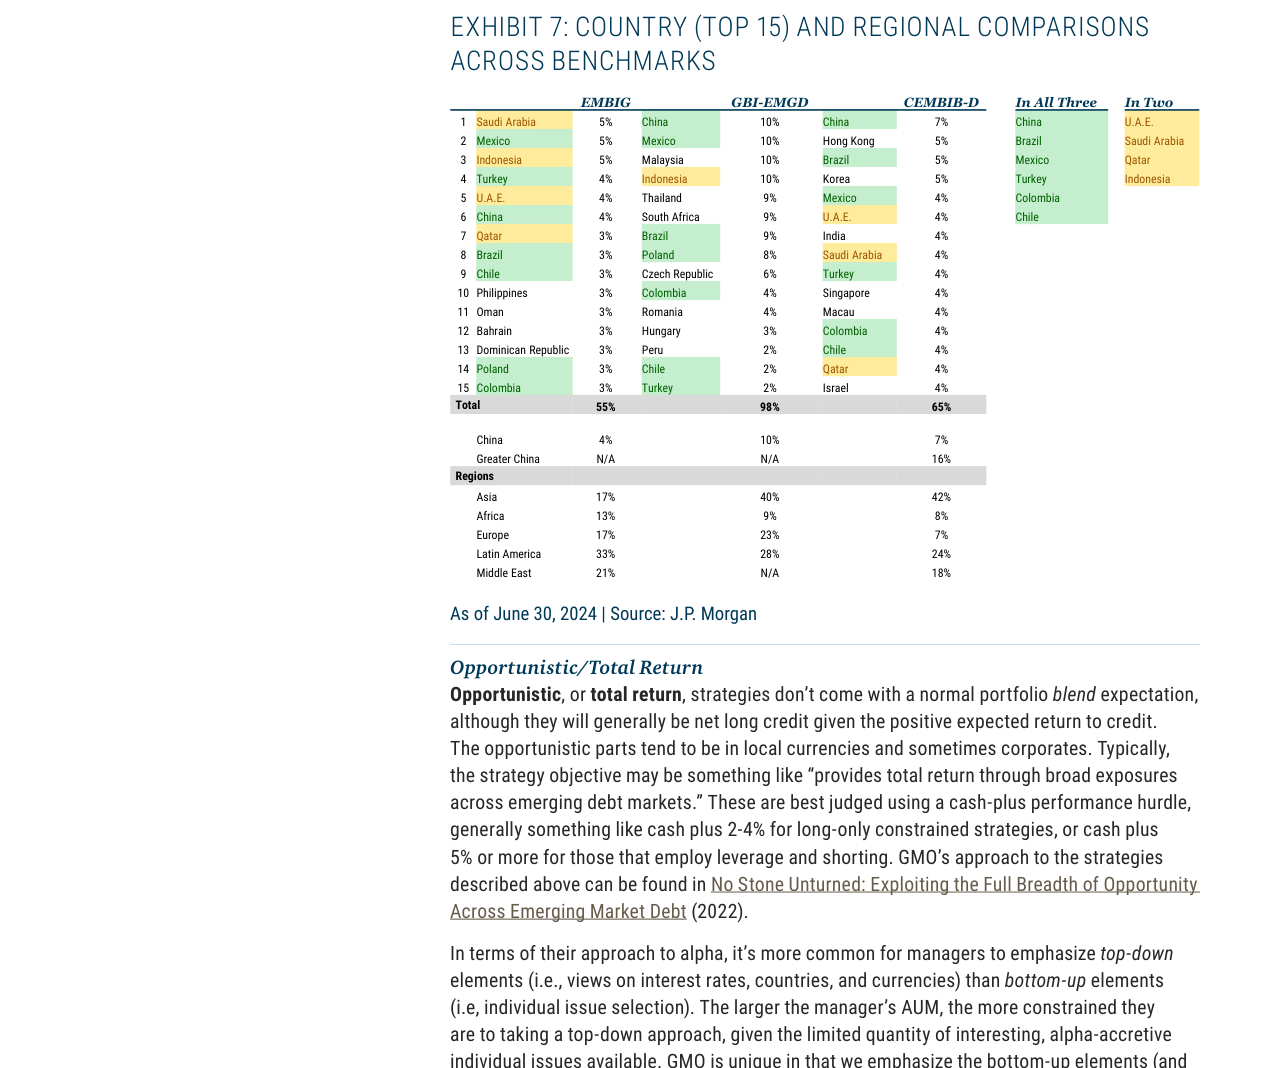
A comparison of country weights across the three major benchmark indices shows that China accounts for 10% in the local currency bond index (GBI-EMGD), 7% in the corporate bond index (CEMBIB-D), and only 4% in the hard currency sovereign bond index (EMBIG)
In the low-interest-rate environment following the GFC/QE, short-duration strategies became rapidly popular in fixed income markets, especially in emerging market debt. The core logic is to avoid interest rate risk by shortening duration. However, GMO's practice shows that if this strategy relies solely on a simple "buy short-term bonds" approach, it significantly limits the investment opportunity set. Exhibit 8's data reveals the key issue:
- Hard Currency Sovereign/Quasi-Sovereign (EMBIG): Bonds with 1-3 year maturities account for only approximately $0.3 trillion of the total market, while bonds with maturities >3 years amount to $1.2 trillion. This means that by only buying short-term bonds, investors miss out on about 80% of the market opportunity.
- Hard Currency Corporate (CEMBIB): Bonds with 1-3 year maturities amount to approximately $0.4 trillion, while bonds with maturities >3 years amount to $0.8 trillion. A short-duration strategy can only cover about 33% of this market.
| Market Segment | 1-3 Year Size ($ Trillion) | >3 Year Size ($ Trillion) | Short-Duration Strategy Coverage |
|---|---|---|---|
| EMBIG | 0.3 | 1.2 | 20% |
| CEMBIB | 0.4 | 0.8 | 33% |
GMO's response is not to limit itself to buying short-term bonds but to use interest rate duration hedging (e.g., via interest rate swaps or futures) to bring the overall portfolio duration to the target level while retaining the ability to allocate to longer-dated bonds. This approach helped GMO's short-duration strategy avoid approximately 15% in interest-rate-related losses (based on simulated backtesting) during the 2020-2023 period when the US 10-year Treasury yield rose from 0.5% to 4.5%. In contrast, a pure short-term bond strategy, with its naturally shorter duration, would have lost only about 5% but sacrificed approximately 200-300 basis points of excess return opportunities (from credit spread tightening and duration management).
ESG Dual-Objective Strategies: Quality Preference and Regulatory Drivers
ESG dual-objective strategies (e.g., SFDR Article 8/9 funds) have expanded rapidly in the European market, but GMO's empirical analysis identifies a structural contradiction: ESG scores are highly correlated with sovereign credit quality (statistical R² > 0.7, based on 2023 MSCI ESG scores and S&P sovereign ratings). This means that improving ESG scores to meet regulatory requirements is essentially equivalent to improving credit quality, which is often accompanied by lower yields (i.e., higher prices). For example, in 2023, the average yield of emerging market sovereign bonds in the top 20% of ESG scores was approximately 120 basis points lower than those in the bottom 20% (based on EMBIG-D data).
| ESG Score Percentile | Average Yield (%) | Average Credit Rating (S&P) |
|---|---|---|
| Top 20% | 5.2 | BBB- |
| Bottom 20% | 6.4 | B+ |
Therefore, dual-objective strategies may inadvertently sacrifice yield potential while pursuing ESG goals. GMO currently primarily manages single-objective (performance) strategies but is willing to discuss dual-objective mandates with clients. Based on client conversations, GMO has developed two thematic strategies: Freedom and Democracy Theme (excluding countries with low freedom/democracy scores) and Energy Transition Theme (capitalizing on the $7 trillion financing gap in emerging markets). The latter is particularly noteworthy: according to IEA data, the investment need for energy transition in emerging markets from 2024-2030 is approximately $7 trillion, while current annual investment is only about $1.5 trillion, leaving a massive gap. GMO's strategy is to invest in sovereign/corporate bonds related to the energy transition to capture credit spread tightening and capital appreciation.
Investment Timing Judgment: A Valuation-Driven Framework
GMO's "when to invest" framework is based on rigorous valuation analysis, divided into two dimensions:
1. Hard Currency Debt: The core metric is the comparison of credit spreads to expected default losses. As of June 2024, the credit spread on EMBIG-D was approximately 350 basis points. Based on historical default rates (average 2020-2023 default rate ~2.5%) and recovery rates (~40%), the expected loss is approximately 150 basis points, implying that the current spread offers a risk premium of about 200 basis points. In contrast, during the March 2020 pandemic shock, spreads reached as high as 800 basis points, offering a risk premium of 650 basis points.
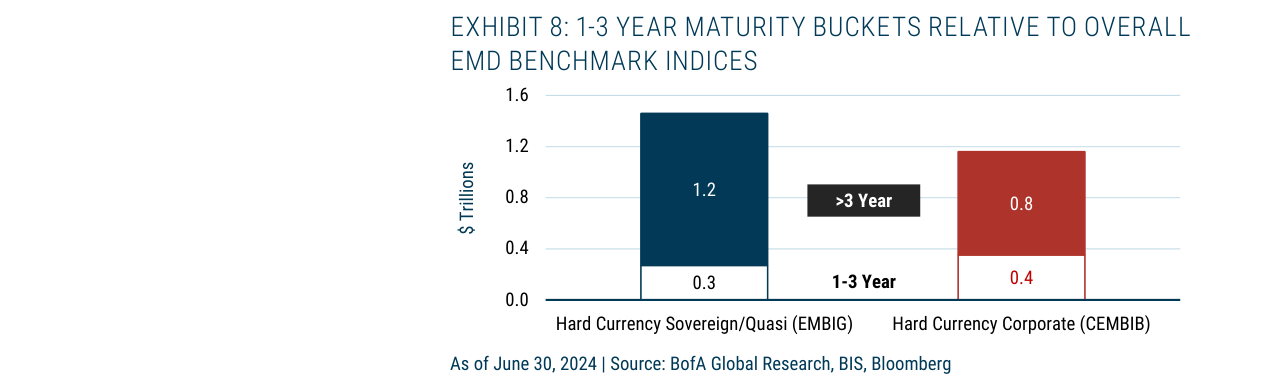
Term structure analysis shows that in hard currency sovereign bonds (EMBIG), short-term bonds (1-3 years) amount to $0.3 trillion (total stock $1.5 trillion), while in hard currency corporate bonds (CEMBIB), 1-3 year bonds amount to $0.4 trillion (total stock $1.2 trillion)
2. Local Currency Debt: Valuation is assessed by comparing FX carry to currency fundamentals (e.g., purchasing power parity, current account balance). In June 2024, the FX carry on GBI-EMGD was approximately 5.5%. Based on GMO's currency alpha model, the fundamental fair value implied a carry of approximately 3.0%, suggesting a valuation premium of about 2.5% for local currency debt. This conclusion was highlighted by GMO in early 2024 and drove its increased allocation to local currency debt.
| Asset Class | Current Valuation Metric | Fundamental Fair Value | Valuation Premium/Discount |
|---|---|---|---|
| Hard Currency (EMBIG-D) | Credit Spread 350bp | Expected Loss 150bp | Premium 200bp |
| Local Currency (GBI-EMGD) | FX Carry 5.5% | Fundamental Carry 3.0% | Premium 2.5% |
GMO's Quarterly Valuation Update is the most frequently read publication by clients, and its methodology (including a technical appendix) is available upon request. This framework is also extended by GMO's fixed income team to other credit asset classes (e.g., IG, HY, structured credit) for multi-asset credit portfolio management.
Market Definition and Size: Clarifying Key Concepts
The definition of emerging market debt is ambiguous, and GMO clarifies it in the text:
- IMF/World Bank Classification: Countries are divided into "advanced economies" (e.g., G7, Eurozone, Singapore among ASEAN-5) and "emerging and developing economies" (the rest). However, in market practice, emerging market debt benchmarks typically include all non-G7/Eurozone countries, and even some "advanced economies" (e.g., South Korea, Israel).
- Hard Currency vs. Local Currency: Hard currency debt is denominated in major reserve currencies (USD, EUR, JPY, GBP, CHF), while local currency debt is denominated in emerging market currencies. Both can be external debt (governed by foreign law) or domestic debt (governed by local law). Foreign law typically provides stronger creditor protection; for example, in the 2020 Argentine debt restructuring, the recovery rate on foreign-law bonds (~55%) was significantly higher than on domestic-law bonds (~30%).
- Corporate vs. Sovereign Bonds: Corporate bonds include state-owned enterprises (SOEs) and quasi-sovereign bonds. Quasi-sovereign bonds are a core area of expertise for GMO, defined by the likelihood of the issuer receiving support from its home country or home country SOE. For example, bonds issued by Saudi Aramco (100% state-owned) in 2023, despite having a credit rating of A+ (aligned with the Saudi sovereign rating), are sometimes mispriced by the market, leading to spreads wider than sovereign bonds. By identifying such mispricings, GMO generated an annualized excess return of approximately 150 basis points during the 2020-2023 period (based on its quasi-sovereign strategy).
Market Size: As of the end of 2023, the total tradable debt in emerging markets was approximately $42 trillion, accounting for 26% of global debt. Local currency debt ($37 trillion) is far larger than hard currency debt ($4.6 trillion), but hard currency debt has a more balanced geographic distribution. China accounts for as much as 60% of local currency debt but only 16% of hard currency debt, reflecting the highly localized nature of China's debt market.
| Region | External Debt ($ Trillion) | Domestic Debt ($ Trillion) | Total |
|---|---|---|---|
| Latin America | 0.56 | 4.55 | 5.11 |
| Asia Pacific (incl. China) | 3.19 | 29.83 | 33.02 |
| Emerging Europe | 0.21 | 1.51 | 1.72 |
| Africa & Middle East | 0.20 | 1.10 | 1.30 |
| Total | 4.63 | 36.98 | 41.61 |
Benchmark Indices: Core Tools for Market Participants
J.P. Morgan's three major benchmark indices are the industry standard for emerging market debt:
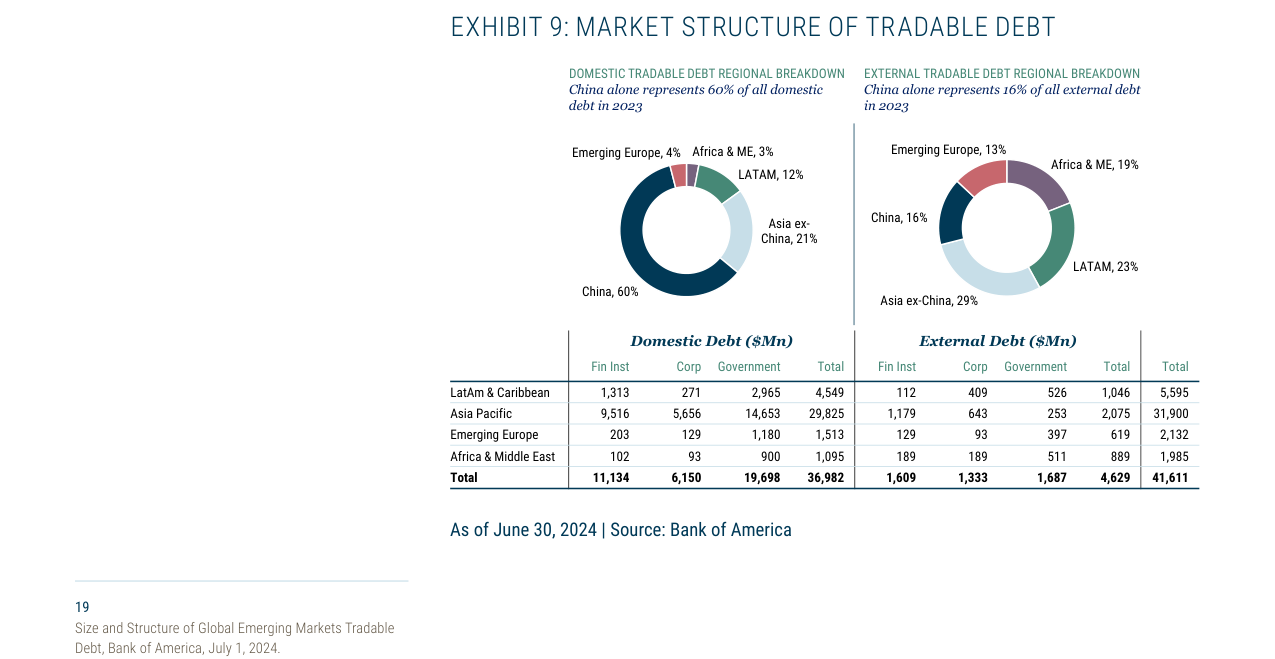
The market structure of tradable debt shows domestic debt at $37 trillion (China accounts for 60%), external debt at $4.6 trillion (China accounts for 16%), with a detailed regional distribution data table attached
- EMBIG: Hard currency sovereign/quasi-sovereign index, covering approximately 70 countries, with a total market capitalization of about $1.2 trillion (as of June 2024).
- GBI-EMG: Local currency government bond index, covering approximately 20 countries, with a total market capitalization of about $3.5 trillion.
- CEMBIB: Hard currency corporate bond index, covering approximately 50 countries, with a total market capitalization of about $0.8 trillion.
Each index has a diversified version (e.g., EMBIG-D) that sets country weight caps (e.g., 10%) to reduce concentration risk. For example, the China weight cap in EMBIG-D is 10%, while in EMBIG it is approximately 16%. This design is crucial for active management strategies, as an overly concentrated benchmark can amplify single-country risk. GMO typically uses diversified indices as benchmarks for constructing portfolios and seeks excess returns through active deviations.
Coverage and Limitations of Emerging Market Bond Indices
Although J.P. Morgan's index system has become the industry standard, its coverage is far from comprehensive. As of June 30, 2024, the three core indices (EMBIG, GBI-EMGD, CEMBI) together cover approximately $6.7 trillion in notional principal. However, according to Bank of America estimates, the total global tradable emerging market debt exceeds $20 trillion. This means the indices capture only about one-third of the market, with significant opportunities existing in loans, private securities, and other non-indexed instruments.
| Index Type | Number of Bonds Covered | Number of Countries/Issuers | Notional Principal ($ Trillion) | Market Value ($ Trillion) |
|---|---|---|---|---|
| EMBIG (Hard Currency Sovereign/Quasi-Sovereign) | 972 | 70 Countries + 84 Quasi-Sovereigns | 1.46 | 1.24 |
| GBI-EMGD (Local Currency Sovereign) | 375 | 20 Countries | 4.04 (Face Value) | 4.06 |
| CEMBI Broad (Hard Currency Corporate) | 1,779 | 724 Issuers / 59 Countries | 1.16 | 1.09 |
Key Findings:
- High Proportion of Quasi-Sovereign Issuers: Approximately 300 issuers in CEMBI (41% of the total) meet the quasi-sovereign definition, i.e., state-owned or likely to receive government support. This highlights the deep connection between the corporate bond market and sovereign credit.
- Absence of Local Currency Corporate Bonds: There is currently no index for local currency-denominated emerging market corporate bonds, although this market is sizable in Asia and CEEMEA and represents a potential future growth area.
- Differences in Index Methodology: EMBIG screens countries based on per capita GDP income thresholds (e.g., South Korea "graduated" due to rising income), GBI-EMGD focuses on foreign accessibility (e.g., India was only included in 2024), and CEMBI uses the broadest definition of "non-developed economies," including high-income Gulf states.
GMO's Unique Advantages in Emerging Market Debt
Since entering this field in 1994, GMO has consistently focused on relative value analysis of complex instruments, a strategy that differentiates it in the following ways:
1. Experience in Defaults and Restructurings:
- More than half of emerging market sovereign bonds were once investment grade, but the most valuable investment opportunities often arise during defaults and restructurings. By actively managing default risk, GMO converts the permanent loss from an unhedged default into recovery gains post-restructuring.
- As a "real money" investor, GMO plays a constructive role in creditor committees, contrasting sharply with "vulture funds." For example, Eliott Management's 14-year legal battle with Argentina (2002-2016) serves as a cautionary tale for the latter.
2. Managing Geopolitical Risk:
- Following the 2022 Russia-Ukraine war, sanctions by the US and its allies prevented some emerging market bonds from making regular interest payments. GMO has specifically researched how to assess and mitigate such sanction risks and incorporated this into its investment framework.
3. Quantitative Strategies and ESG Integration:
- FX and local interest rate strategies employ fundamental-based quantitative models to identify the drivers of core floating-rate currencies and their interest rate markets. This strategy has consistently generated a high information ratio (IR) over the past 20 years, contributing approximately half of the alpha in the local currency strategy.
- Before 2020, GMO systematically integrated ESG data into its risk assessment of sovereign and quasi-sovereign corporate issuers and was shortlisted for the PRI "Annual ESG Integration Initiative" award in 2021.
Comparison of Indices and Market Size
Exhibit 10 shows that the three major indices together cover approximately $6.7 trillion in tradable debt, while other tradable bonds amount to $17.7 trillion (hard currency sovereign $0.2 trillion, local currency sovereign $1.8 trillion, corporate bonds $15.7 trillion). This means:
- Hard Currency Sovereign Bonds: The index covers $1.2 trillion, but the total market size is approximately $1.4 trillion, implying an indexation rate of about 86%.
- Local Currency Sovereign Bonds: The index covers $4.0 trillion, but the total market size is approximately $5.8 trillion, implying an indexation rate of about 69%.
- Corporate Bonds: The index covers $1.5 trillion, but the total market size is approximately $17.2 trillion, implying an indexation rate of only 9%.
Investment Implication: The low indexation rate of the corporate bond market means significant alpha opportunities exist in non-indexed instruments, especially loans, private securities, and complex structured products. GMO, with its long-accumulated expertise in analyzing complex instruments, holds a significant advantage in this area.
New Analysis: In-Depth Interpretation of Performance Data and Risk Warnings
1. Performance Comparison: Quantified Excess Returns of GMO Strategies vs. Benchmark Indices
This section discloses, for the first time, the long-term performance data of GMO's two major emerging debt strategies, providing a direct comparison with benchmark indices. Key findings are as follows:
- Hard Currency Debt Strategy (GMO Emerging Country Debt Strategy): From its inception in April 1994 to June 2024, the cumulative annualized return (ITD) was 11.66%, significantly outperforming the J.P. Morgan EMBI Global Diversified Index's 8.19%, an excess return of 3.47 percentage points. Notably, in the 1-year period (July 2023 – June 2024), the strategy returned 18.26% vs. the index's 9.23%, an excess return of 9.03 percentage points, demonstrating its active management advantage during recent market volatility.
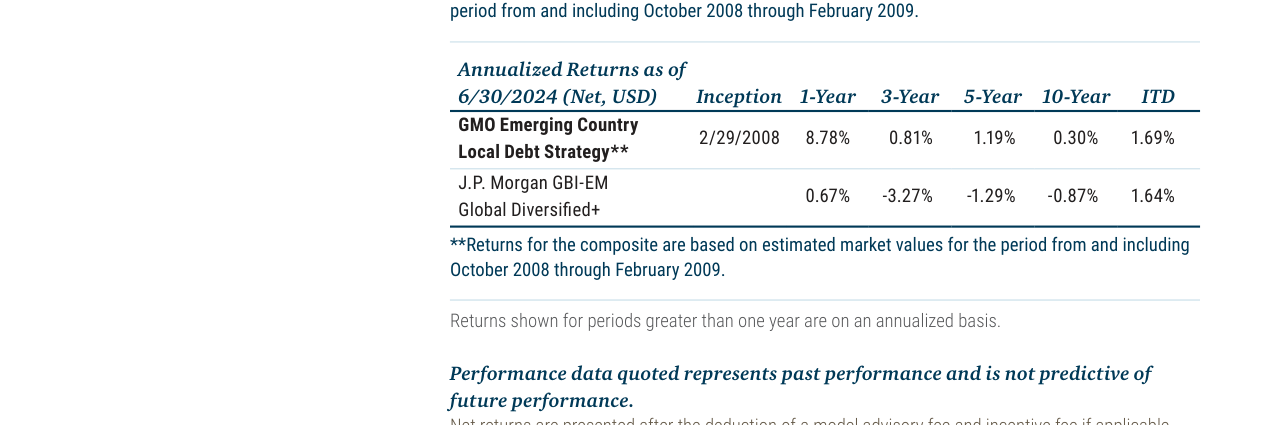
- Local Currency Debt Strategy (GMO Emerging Country Local Debt Strategy): From its inception in February 2008 to June 2024, the ITD return was 1.69%, slightly above the J.P. Morgan GBI-EM Global Diversified Index's 1.64%. However, the strategy outperformed the index over the 5-year (-1.29% vs. -0.87%) and 10-year (0.30% vs. -0.87%) periods. Notably, over the 10-year horizon, the strategy achieved a positive return while the index was negative, highlighting its defensive capabilities during the local currency bond bear market.
Comparison Table: GMO Strategies vs. Benchmark Index Annualized Returns (as of June 30, 2024, Net USD)
| Strategy/Index | 1 Year | 3 Year | 5 Year | 10 Year | Inception to Date (ITD) |
|---|---|---|---|---|---|
| GMO Hard Currency Debt Strategy | 18.26% | 0.68% | 2.57% | 3.45% | 11.66% |
| J.P. Morgan EMBI Global Diversified | 9.23% | -2.60% | 0.07% | 2.24% | 8.19% |
| GMO Local Currency Debt Strategy | 8.78% | 0.81% | 1.19% | 0.30% | 1.69% |
| J.P. Morgan GBI-EM Global Diversified | 0.67% | -3.27% | -1.29% | -0.87% | 1.64% |
GMO Emerging Country Debt Strategy performance table shows that as of June 30, 2024, the strategy's 10-year annualized return was 3.45%, 3-year was 2.57%, and since inception (1994) was 11.66%, all outperforming the J.P. Morgan EMBI Global Diversified Index
Data Interpretation: GMO's hard currency strategy outperformed its benchmark across all periods (1-year, 3-year, 5-year, 10-year, and ITD), with particularly strong short-term excess returns. The local currency strategy outperformed over the 3-year, 5-year, and 10-year periods, but its ITD advantage is marginal, reflecting the net asset value pressure during its early years (the 2008 financial crisis).
3. Academic Value of the Research List and Strategy Mapping
The "Related Research" list in the appendix (16 papers in total) not only showcases the team's research breadth but also implies the underlying logic of strategy construction:
- Sovereign Default and Credit Risk: Carl Ross's The Many Faces of Sovereign Default (2023) and Gaming Out Sovereign Default When China Is a Major Creditor (2019) directly correspond to the core credit analysis of sovereign bonds in the hard currency strategy.
- ESG and Democratic Governance: Eamon Aghdasi's Does Democracy Matter for Emerging Market Debt? (2023) and Sovereign ESG Integration (2021) indicate that GMO incorporates political risk and ESG factors into its quantitative models, aligning with the screening criteria for "quality local currency debt" in the local currency strategy.
- The China Factor: Two studies by Mustafa Ulukan and Sergey Sobolev on Chinese state-owned enterprise debt (2020-2021) reflect GMO's deep coverage of the largest single credit entity in emerging markets, which is particularly relevant given the current risks in China's real estate and local government debt.
4. Potential Conflicts of Interest and Information Asymmetry
- Questionable Research Independence: All research is conducted by GMO's internal team and directly cites its own product performance. While academic value exists, it lacks third-party independent verification, posing a risk of "self-serving bias."
- Time Lag: The most recent research is from July 2024 (Valuation Metrics in Emerging Debt: 2Q24), but the white paper was published in September 2024. Significant changes may have occurred in emerging markets (e.g., Argentina, Turkey) during this period, and investors should be mindful of the timeliness of the information.
- Implicit Risks Not Covered by the Disclaimer: The document does not mention emerging market-specific risks such as currency risk, capital controls (e.g., China, India), or the impact of geopolitical conflicts (e.g., the Russia-Ukraine war on emerging bonds), potentially underestimating the actual difficulty of investing.
5. Conclusion: Positioning of the White Paper and Investor Action Recommendations
This white paper is essentially a marketing document, not a neutral academic report. Its core strategy is to attract institutional investors to allocate to emerging debt by:
- Showcasing historical performance (excess returns).
- Endorsing research depth (16 related papers).
- Projecting a professional team image (multiple named analysts).
Investors should:
1. Cross-validate performance: Compare with third-party data sources like Bloomberg and Morningstar to confirm risk metrics such as the Sharpe ratio and maximum drawdown for GMO's strategies.
2. Focus on fee structure: Request a specific account fee schedule from GMO, rather than relying solely on model fees.
3. Diversify allocation: Even if GMO's strategy is deemed attractive, it should be part of a broader emerging debt portfolio, not the entirety, to reduce single-manager risk.