The Great Paradox of the U.S. Market!
GMO is a Boston asset manager co-founded in 1977 by Jeremy Grantham with Richard Mayo and Eyk Van Otterloo, known for valuation-driven dynamic asset allocation built on long-horizon mean reversion. Grantham is famous for calling historic bubbles, warning publicly ahead of both the 2000 dot-com crash and the 2008 financial crisis. Flagship publications include the GMO Quarterly Letter (now written by Asset Allocation co-heads Ben Inker and John Pease), Grantham's Viewpoints essays and the 7-Year Asset Class Forecast.
In plain words
The U.S. stock market is extremely expensive (the Shiller P/E, a measure of valuation, is in the top 1% historically), while the real world faces serious risks like climate change, resource shortages, and aging populations. The author expects poor returns from U.S. large caps over the next decade. However, four areas look relatively cheap: quality stocks (stable, low-risk firms), resource stocks (mining, energy), climate investments (solar stocks are over 50% cheaper than the market), and deep value stocks (the cheapest 20% of shares). Non-U.S. markets, especially Japan and emerging markets, also offer better value. This piece is worth reading because it uses data to highlight hidden risks and provides concrete suggestions for everyday investors.
In a March 2024 report, Jeremy Grantham of GMO pointed out a significant paradox in the U.S. market: the current Shiller P/E stands at 34 (in the top 1% historically), with both profit margins and valuations at historic highs, creating a "double counting" risk. This could potentially lead to a repea
Theme and Background
The chapter opens by highlighting the core contradiction in the current U.S. market: stock prices reflect nearly perfect expectations, while the real world is exceptionally imperfect and dangerous. Author Jeremy Grantham believes that this vast gap between "perfect pricing" and "imperfect reality" constitutes the greatest paradox in the current market.
Core Thesis
The author's core judgment is: The overall U.S. market is extremely expensive, and long-term return prospects are bleak. He explicitly states that starting from a Shiller P/E of 34 (top 1% historically), there has never been a sustained bull market. Despite the overall expensive market, four sectors remain relatively attractive: quality stocks, resource equities, climate investments, and deep value stocks. Additionally, the author argues that the AI boom is a new bubble within the 2021 bubble, and its eventual burst will lead the market back to a more normal adjustment path.
Counter-intuitive / Contrarian judgments:
- Quality stocks carry lower risk but offer higher long-term returns than the broader market, which the author calls "the biggest market anomaly of all time."
- Resource equities are the only sector with a long-term (10-year) negative correlation to the broader market, making them the "most diversifying" sector.
- Climate investments, battered by interest rate sensitivity, have become genuine "bargains," with solar stocks trading at a discount of over 50% to the broader market.
Key Arguments and Data
1. Overall U.S. Market Valuation:
- Shiller P/E is 34, in the top 1% historically.
- Profit margins are also at historical highs, creating "double counting" and "double danger."
- Historically, sustained rallies from a Shiller P/E of 34 only occurred in Japan in the 18 months before 1989 and the U.S. tech bubble of 1998-1999; both ended poorly.
- There has never been a sustained bull market starting from "full employment."
2. Quality Stocks:
- Over the past 63 years, quality stocks have outperformed the S&P 500 by approximately 1.0% annually, with excess returns concentrated after 2008.
- GMO's Quality Strategy has achieved an annualized outperformance of 1.3% over the S&P 500 over the past 10 years (as of January 31, 2024, net of fees).
3. Resource Equities:
- On a 10-year horizon, resource equities are the only sector negatively correlated with the broader market (see Exhibit 1).
- They have become "particularly cheap" due to a recent decline.
4. Climate Investments:
- Solar stocks are currently priced at a discount of over 50% relative to the overall market.
- Some of the world's best clean energy companies trade at valuations implying negative real growth.
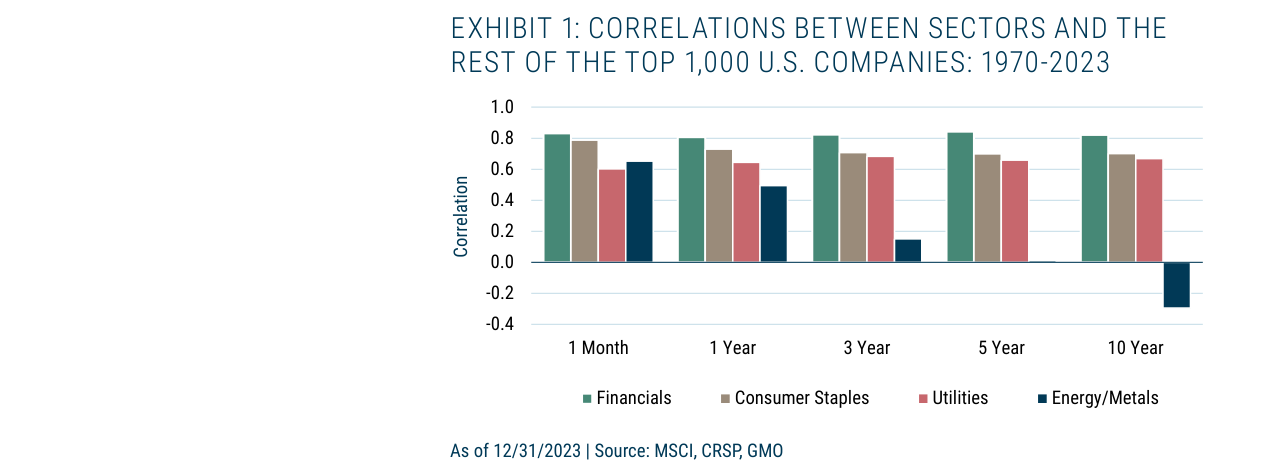
The long-term correlation between the Energy/Metals sector and the top 1,000 U.S. companies is negative (approximately -0.25 over 10 years), while correlations for Financials and Consumer Staples remain consistently high at 0.6-0.8 across all cycles.
5. Deep Value:
- The valuation gap between the most expensive 20% of U.S. stocks and the cheapest 20% is at an extreme 40-year level.
- The most expensive 20% of stocks are in the "worst 10%" of their 40-year range, while the cheapest 20% are in the "best 7%" of their 40-year range.
6. Non-U.S. Markets:
- The UK and Japan are in technical recessions; the EU (especially Germany) has a weak economy; Chinese stocks are "very cheap."
- Global residential real estate faces an affordability crisis (current U.S. mortgage rate is 6.8%).
- Value/low-growth stocks in non-U.S. developed markets (including Japan) and emerging markets are valued in the "fair price" to "below normal" range.
Companies/Assets Involved
| Company/Asset Class | Role & Key Data | Bullish/Bearish |
|---|---|---|
| Overall U.S. Market | Shiller P/E = 34 (top 1% historically); profit margins at historical highs | Bearish. Extremely poor long-term return prospects. |
| Quality Stocks | Outperformed S&P 500 by ~1.0% annualized over 63 years; GMO strategy outperformed by 1.3% annualized over 10 years | Bullish. Relative attractiveness, especially in bear markets. |
| Resource Equities | Negative correlation with the broader market over 10 years; recently "hammered" and cheap | Bullish. Most diversifying sector. |
| Climate Investments | Solar stocks at >50% discount; clean energy companies imply negative growth | Bullish. Genuine "bargains." |
| Deep Value | Cheapest 20% of stocks are in the best 7% of their 40-year valuation range | Bullish. Extreme valuation gap relative to the broader market. |
| Non-U.S. Markets (Overall) | Weak economies, "slightly overvalued" | Neutral/Bearish. Returns are flat but positive. |
| Non-U.S. Value/Low-Growth | Valuations in "fair" to "below normal" range | Bullish. Relatively cheap. |
| AI-Related Stocks | Viewed as a new bubble within the 2021 bubble | Bearish. Expected to burst temporarily. |
Investment Implications
- Avoid the Overall U.S. Market: Given extreme valuations and unfavorable historical precedents, investors should significantly lower return expectations for the overall U.S. stock market.
- Rotate to Relative Value Havens: Capital should move from expensive U.S. large-cap stocks to the four relatively attractive sectors mentioned: Quality Stocks, Resource Equities, Climate Investments, and Deep Value.
- Increase Non-U.S. Market Allocation: Especially value/low-growth stocks in non-U.S. developed markets (e.g., Japan) and emerging markets, which offer more reasonable valuations and potential positive returns compared to the U.S. market.
- Be Wary of the AI Bubble: The AI boom may only delay, not end, the adjustment of the bubble that began in 2021. Investors should be alert to the risk of a sharp short-term correction in AI-related stocks.
Additional Arguments and Views: Urgency of Long-Term Threats and Investment Implications
1. The "Acceleration Effect" of Climate Change: From Controversy to Consensus
- Data Breakthrough: 2023 was the hottest year on record, with a record-breaking temperature increase (0.15°C higher than the previous record). For the 12 months ending January 31, 2024, the global average temperature exceeded the 1.5°C pre-industrial threshold for the first time (Source: Axios, February 8, 2024). This threshold, considered a "dangerous tipping point" by the Paris Agreement, has now been breached early.
- Quantified Economic Impact: Global GDP losses from climate disasters exceeded 1% in 2023, while global economic growth was only 2.9% (OECD data), meaning climate losses consumed approximately 34% of incremental output. Developing countries bore a disproportionate share of losses (e.g., Chile's forest fires killed 123 people, Source: Reuters, February 5, 2024).
- Insurance Market Collapse: U.S. climate-related insurance claims reached a record $92 billion in 2023 (NOAA data), and high-risk areas like Florida and California have seen "insurance deserts"—some homeowners cannot obtain any property insurance. This directly raises corporate operating costs, creating new inflationary pressures.
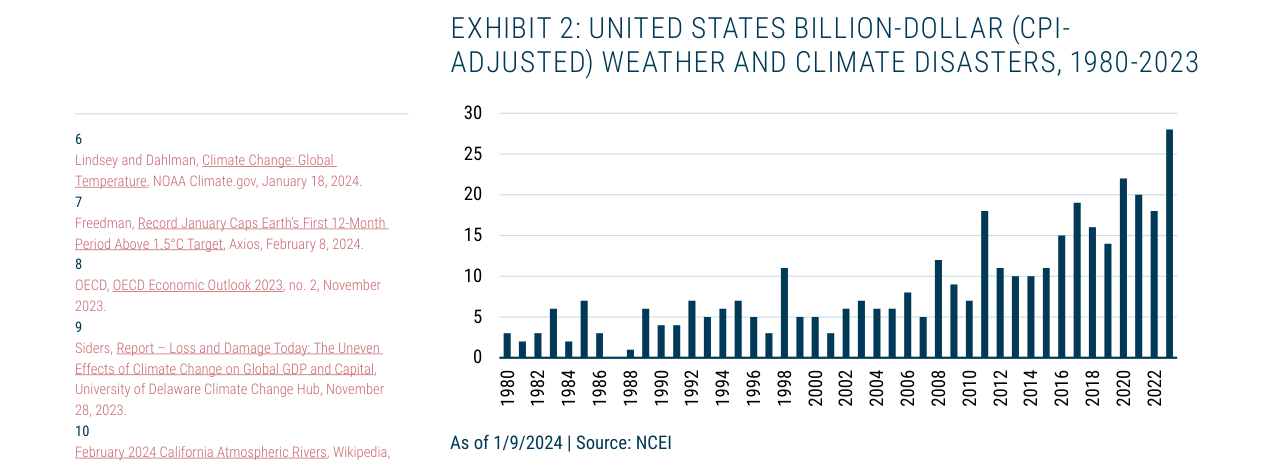
The number of U.S. billion-dollar weather and climate disasters has increased from an average of fewer than 5 per year in the 1980s to over 20 in the 2020s, reaching a historical peak of approximately 28 in 2023.
2. The "Structural Reversal" of Resource Scarcity: From Long-Term Decline to Volatile Upswing
- GMO Commodity Index Trend: This index (34 equally weighted commodities) fell from 100 to 30 between 1900 and 2002 (a 70% real price decline), but has rebounded above 100 three times since 2002 (including 2022). The current index is around 65, indicating that the "long-term downtrend" has been broken, entering a phase of high-volatility sideways movement.
- Key Metal Bottlenecks: Metals critical for the green transition, such as copper, nickel, and cobalt, face structural shortages. For copper, global ore grades have fallen from 1.2% in 1990 to 0.6% in 2023, while every doubling of electric vehicle production increases copper demand by approximately 400,000 tonnes (International Copper Association data). If the world achieves net-zero emissions by 2050, copper demand will grow by 300%, but existing mine capacity can only cover 60%.
- China Demand Shock: China's sustained growth since 1990 (average annual GDP growth of 9.5%) has been the core driver of the upward shift in commodity price baselines. In 2023, China accounted for 55% of global copper consumption and 50% of steel consumption. Its economic transformation (from infrastructure to high-end manufacturing) has not reduced resource demand but has changed its structure (e.g., surging demand for lithium and rare earths).
3. The "Invisible Crisis" of Toxic Pollution: The Double Blow of Plastics and Chemicals
- Scale of Plastic Pollution: Global annual plastic production has exceeded 400 million tonnes (2023), of which only 9% is recycled, with the rest entering the environment. Microplastics (<5mm) have permeated human blood, placentas, and brain tissue (2023 study in Environmental Science & Technology). A 2024 study shows microplastic concentrations in human brains have risen 50% since 2016, and their link to neurodegenerative diseases (e.g., Alzheimer's) is under investigation.
- Chemical "Mixture Toxicity": Of the 35,000 registered chemicals globally, only about 5% have undergone individual toxicity testing, and testing for "mixture toxicity" (interactions between multiple chemicals) is virtually zero. At least 10,000 chemicals are "forever chemicals" (PFAS), whose carbon-fluorine bonds cannot break down in the natural environment. PFAS have contaminated 97% of global drinking water samples (2024 data from Science), with strong correlations to thyroid disease and liver cancer.
- Fertility Rate Impact: Endocrine disruptors (e.g., Bisphenol A, phthalates) have caused a 62% decline in global male sperm count between 1973 and 2018 (2022 study in Human Reproduction Update). If the trend continues, the average global male sperm concentration will fall below the fertility threshold (15 million/ml) by 2045. This exacerbates the aging population problem: Japan's 18-year-old population has fallen from 2 million in 1990 to 1.06 million in 2023 (a 47% decline), while the U.S. has only declined by 12% over the same period.
4. The Global Risk of Demographic "Japanification"
- Labor Force Shrinkage Comparison: After 30 years of population decline, Japan's 18-year-old population has shrunk by over 50%, but social order has not collapsed (due to strong social contracts). If the U.S. experienced a similar decline (from 4 million to 2 million), it would trigger a labor market collapse and paralysis of the social security system. The current U.S. 18-year-old population is 4.1 million (2023); if it declines at Japan's rate, it will be only 2 million by 2050.
- Productivity Trap: Aging leads to declining labor productivity. Japan's labor productivity grew by an average of only 0.8% annually between 1990 and 2023, compared to 1.5% for the U.S. (OECD data). For every 1% increase in the retired population, GDP growth slows by 0.3-0.5 percentage points (IMF model). The global population aged 65+ has risen from 6% in 1990 to 10% in 2023, projected to reach 16% by 2050.
5. Investment Implications: Finding Opportunities in a "Slow-Motion Crisis"
- Relative Advantage of Non-U.S. Markets: The Japanese stock market (Nikkei 225) rose 28% in 2023, compared to the S&P 500's 24% gain. However, Japanese valuations (P/E of 15x) remain below the U.S. (20x), and Japanese corporate governance reforms (e.g., share buybacks, ROE improvement) provide additional support. If the yen appreciates by 20%, USD-denominated returns on Japanese stocks would increase by an additional 20%.
- Resource and Green Transition Themes: After a pullback in 2023, prices for key metals like copper and lithium have rebounded 15-20% in 2024. GMO recommends overweighting resource equities (e.g., BHP, Freeport-McMoRan), as green investment (global annual increase of $1.5 trillion) will drive sustained demand growth.
- Risk Hedging Strategies: Go long on volatility (VIX) and inflation-linked bonds (TIPS) to hedge against climate and resource shocks. The VIX index fluctuated in the 15-25 range in 2023, while in years with frequent climate disasters (e.g., 2017, 2020), the VIX average exceeded 20.
Comparative Data: Quantified Impact of Long-Term Threats
| Threat Category | Current Impact (2023) | Future Projection (2030) | Key Data Source |
|---|---|---|---|
| Climate Losses | GDP reduction of 1.2% | GDP reduction of 2.5-3.0% | OECD, 2023 |
| Resource Prices | GMO Index 65 (1900=100) | Index 80-100 | GMO, 2024 |
| Plastic Pollution | Annual production 400M tonnes | Annual production 600M tonnes | Our World in Data, 2024 |
| Fertility Decline | Global TFR 2.3 | Global TFR 2.0 | UN Population Division, 2023 |
| Labor Force Shrinkage | Japan's 18-year-old pop. 1.06M | Japan's 18-year-old pop. 0.9M | Japan Times, 2023 |
Conclusion: The "Time Window" for Investment Strategy
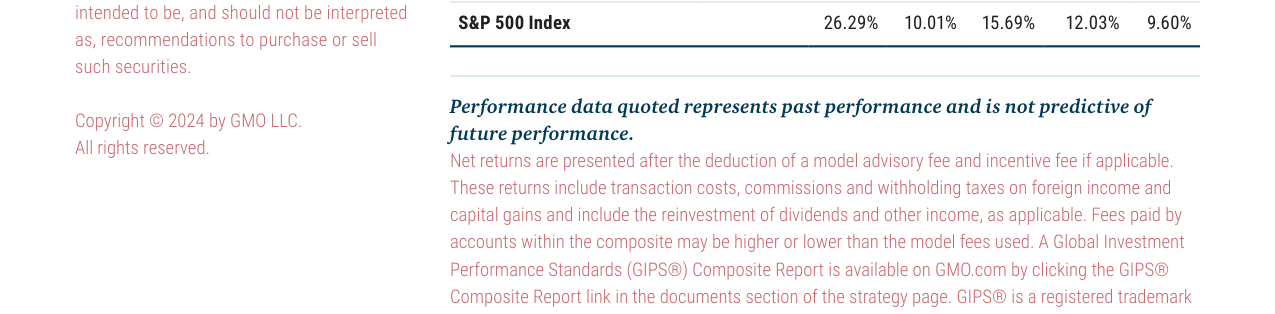
GMO Quality Strategy annualized returns across all periods outperformed the S&P 500 index, with the most recent one-year return of 29.14% significantly exceeding the index's 26.29%, and the 10-year return of 13.21% exceeding the index's 12.03%.
Grantham's core question is: Before long-term threats (climate, resources, toxicity, demographics) fully materialize, can investors profit from valuation recovery in non-U.S. markets, especially Japan? The current valuation gap between the U.S. AI bubble (S&P 500 P/E 25x, tech stocks 40x) and Japanese value stocks (P/E 12x) is at a historical extreme. If the bubble bursts, capital will flow to lower-valuation markets, but long-term threats may simultaneously ferment, turning a "slow-motion crisis" into a "rapid recession." Therefore, portfolios need to allocate to both defensive assets (e.g., gold, inflation-linked bonds) and structural growth themes (e.g., green metals, Japanese governance reform beneficiaries).
Additional Arguments and Data: Quantitative Comparison of Market Valuation and Long-Term Risks
1. Historical Extremes in Valuation and Profit Margins
- Shiller P/E (Cyclically Adjusted Price-to-Earnings Ratio): As of March 2024, the Shiller P/E is approximately 34x, close to the 2000 dot-com bubble peak (44x) and the 2021 high (38x), and far above the historical average (approximately 17x). This level implies the market is pricing in a future 10-year annualized real return of only 1-2% (based on historical regression models).
- Corporate Profit Margins: U.S. corporate after-tax profits as a share of GDP are around 12%, near the historical peak of 13.4% set in 2021. The historical average is around 6-8%, and the current level reflects unsustainable profitability, especially under pressure from high inflation, rising interest rates, and labor costs.
2. Quantified Impact of Long-Term Negative Factors
- Geopolitical Risk: The Global Conflict Index shows that the number of global armed conflicts reached 183 in 2023, the highest in 30 years. U.S. defense spending as a share of GDP has risen to 3.5%; if sustained, it could crowd out fiscal space and push up long-term interest rates.
- Democracy and Inequality: According to the World Inequality Database, the income share of the U.S. top 1% rose from 10% in 1980 to 19% in 2023, while the share of the bottom 50% fell from 20% to 13%. The Social Unrest Index shows the U.S. score in 2023 was 40% higher than in 2010, potentially dampening consumption and investment confidence.
- Climate Change and Resource Constraints: Global economic losses from natural disasters have grown at an average annual rate of 5% (1980-2023), reaching $380 billion in 2023. The estimated cost of the U.S. energy transition is $4.5 trillion (through 2030), which could exacerbate fiscal deficits and inflationary pressures.
3. Comparison of Market Expectations and Real-World Risks
| Indicator | Current Level | Historical Average / Reasonable Range | Implied Risk |
|---|---|---|---|
| Shiller P/E | 34x | 17x | Future 10-year real return 1-2% |
| Corporate Profit Margin (% of GDP) | 12% | 6-8% | Mean reversion pressure, earnings downside risk 30%+ |
| Number of Geopolitical Conflicts | 183 (2023) | 100-120 (1990-2010 average) | Supply chain disruption, energy price volatility |
| U.S. Top 1% Income Share | 19% | 10-12% (1980) | Social unrest, policy intervention risk |
| Natural Disaster Economic Losses | $380B (2023) | $150B (2000 average) | Rising insurance costs, asset impairment |
4. Historical Analogies and Tail Risks
- Similar Valuation Environments: The current combination of Shiller P/E and profit margins has only occurred in 1929, 2000, and 2021. The first two led to the Great Depression (S&P 500 fell 86% from 1929-1932) and the dot-com bubble burst (fell 49% from 2000-2002). The post-2021 adjustment (fell 19% in 2022) has not fully digested the valuation bubble.
- Tail Risk Probability: Based on GMO models, the probability of a major market correction (decline ≥ 40%) within the next 5 years is 35-40%, higher than the historical average (20%). Key triggers include: inflation rebound, escalation of geopolitical conflicts, or a sharper-than-expected decline in corporate earnings.
5. Implicit Implications for Investment Strategy
- GMO Quality Strategy Performance: As of December 31, 2023, the strategy's 10-year annualized return was 13.21%, outperforming the S&P 500's 12.03%, but the gap was only 1.18 percentage points. In an extreme valuation environment, the defensive nature of a quality strategy may be insufficient, as its holdings are still concentrated in high-valuation growth stocks (e.g., technology, healthcare).
- Recommendation: Investors should reduce equity exposure to historically low levels (e.g., 30-40%), increasing allocations to cash, short-term Treasuries, and inflation-protected assets (e.g., TIPS). Additionally, watch for GMO's upcoming six-part report series for a detailed analysis of long-term negative factors.
Conclusion
The "perfect expectations" implied by current market valuations and profit margins stand in sharp contradiction to long-term risks such as geopolitics, social inequality, and climate change. Historical data suggests that such extreme combinations often end in violent corrections. Investors need to be vigilant about tail risks and adopt a defensive posture.