Emerging Debt Energy Transition
GMO is a Boston asset manager co-founded in 1977 by Jeremy Grantham with Richard Mayo and Eyk Van Otterloo, known for valuation-driven dynamic asset allocation built on long-horizon mean reversion. Grantham is famous for calling historic bubbles, warning publicly ahead of both the 2000 dot-com crash and the 2008 financial crisis. Flagship publications include the GMO Quarterly Letter (now written by Asset Allocation co-heads Ben Inker and John Pease), Grantham's Viewpoints essays and the 7-Year Asset Class Forecast.
In plain words
This report looks at a unique opportunity in emerging market bonds tied to the shift from coal to clean energy. It argues that these bonds—often backed by government guarantees or contracts—are less risky than many think, yet offer higher yields than similar US corporate bonds. For ordinary investors, this means a chance to earn better returns while supporting global climate goals, through funds that invest in these assets. The key insight challenges the common belief that emerging market debt is always risky, making it worth a look.
The GMO white paper proposes a new approach to financing the energy transition in emerging markets (EM). Its core argument is that EM countries present significant opportunities in both greenhouse gas emission reduction and investment returns. Currently, approximately 80% of EM power generation capa
Theme and Background
This chapter discusses the unique investment opportunities in financing the energy transition in Emerging Markets (EM). The report notes that EM countries contribute a disproportionate share of global greenhouse gas emissions, with approximately 80% of their power generation capacity still reliant on fossil fuels. To achieve net-zero targets, non-renewable energy capacity must be reduced from 80% to about 30% within a decade, while EM countries must also meet significant new electricity demand driven by population growth, rising incomes, and transportation electrification.
Core Thesis
The author's core investment argument is that the EM energy transition represents a dual opportunity for both emission reduction impact and investment returns, with sovereign states serving as the central force driving the transition. Counterintuitive judgments include:
- Fossil fuel assets should not be entirely excluded: Within the framework of sovereign net-zero plans, certain fossil fuel assets (e.g., backup power generation for grid stability) remain investable without the risk of becoming "stranded assets."
- Transition success should be measured at the sovereign level, not the company level: For example, a state-owned coal company (such as Vietnam's Mong Duong) that phases out according to plan better reflects sovereign net-zero progress than a state-owned oil and gas company (such as Colombia's Ecopetrol) acquiring green assets.
- Utilities are an ideal foundational investment sector: Although approximately 40% of EM greenhouse gas emissions come from utilities, the technical feasibility of achieving carbon neutrality in this sector within 30 years is high.
Key Arguments and Data
1. Massive financing gap:
- EM currently has 1,500 GW of installed capacity that needs to be "greened," plus an additional 3,000 GW of new capacity required, totaling 4,500 GW of demand.
- Based on a construction cost of $2.5 billion per GW, total financing needs amount to $11 trillion.
- EM governments have budgeted only $4 trillion, leaving a $7 trillion gap that must be filled by the private sector.
2. Investment scale and rating distribution:
- Currently investable public market securities total approximately $300 billion, of which nearly 80% are investment grade.
- BB-rated issuers account for most of the remainder and may face rating upgrades.
- Private market (direct lending) opportunities are at least 2 times the size of the public market.
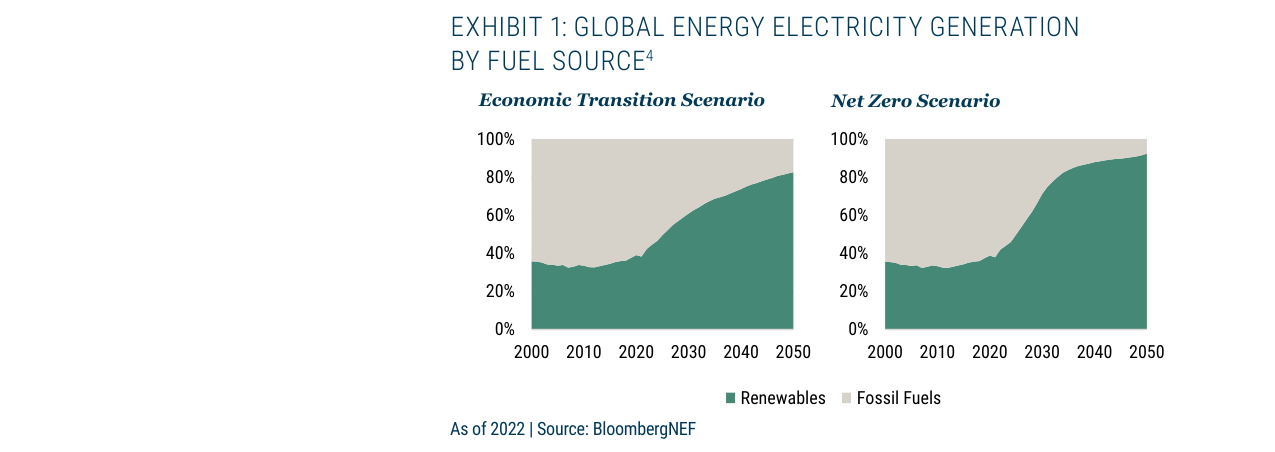
Under economic transition and net-zero scenarios, the share of renewable energy in the global electricity generation mix is projected to rise from approximately 35% in 2000 to about 80%-100% by 2050, with a corresponding decline in the share of fossil fuels
3. Comparison of sector transition potential (see table below):
| Sector | EM GHG Emissions Contribution (Consumption Side) | Technical Transition Feasibility | Investment Logic |
|---|---|---|---|
| Power Infrastructure | High (40%) | High | Can transition into renewable energy entities; ideal foundation |
| Transportation/Infrastructure/Industry/Metal Mining | Medium-High | Medium-High | Can undergo economic transition; included in expanded investment universe |
| Coal Mining/Oil & Gas | Medium-Low (Operations Side) | Low | Excluded due to low technical transition feasibility and emissions primarily from downstream consumption |
4. Empirical evidence of sovereign-driven transition:
- Vietnam's Mong Duong (state-owned coal company): Phasing out gradually under the sovereign plan, with no stranded asset risk; investable until closure.
- Colombia's Ecopetrol (state-owned oil and gas company): Acquiring ISA (a transmission company) only changes ownership without actually advancing sovereign net-zero goals.
Companies/Assets Involved
- Mong Duong (Vietnam): A state-owned coal company, positioned as a "phased-out asset" within the sovereign net-zero plan, with no stranded risk and investable.
- Ecopetrol (Colombia): A state-owned oil and gas company that diversified through the acquisition of ISA (a transmission company), but the author believes this does not genuinely contribute to sovereign net-zero progress, only improving its ESG score.
- Utilities (overall): Source of approximately 40% of EM emissions, but with high technical transition feasibility; serves as an investment foundation.
- Financial Intermediaries: Provide exposure to energy transition assets in jurisdictions with limited investment opportunities.
Investment Implications
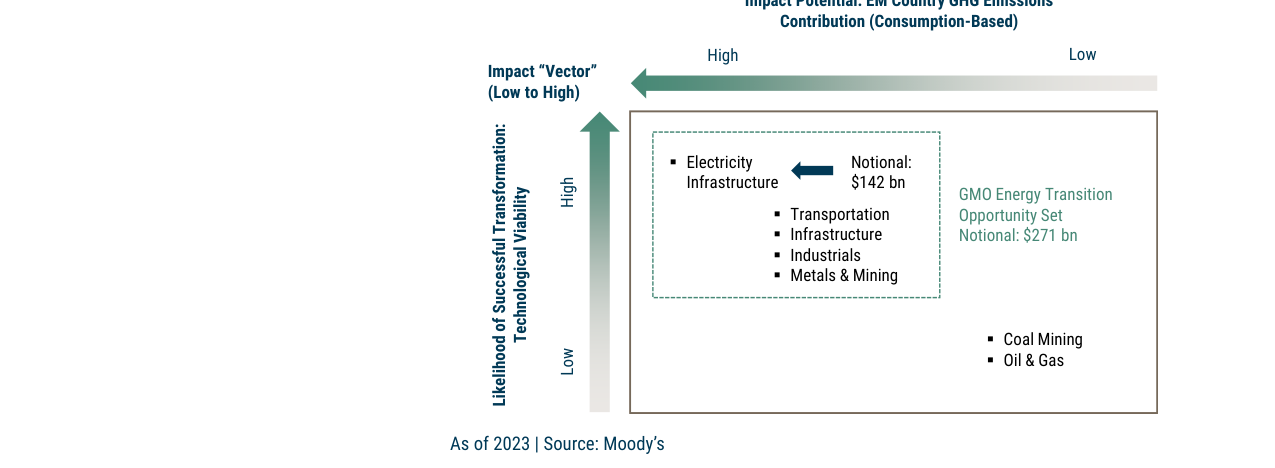
Assessing the transition impact potential of various sectors: the power infrastructure opportunity is $142 billion, the total GMO energy transition opportunity set is $271 billion, and coal and oil & gas sectors are excluded due to low transition feasibility
- Focus on sovereign-driven initiatives: Investments should center on sovereign net-zero plans, selecting state-owned utilities and projects (under PPP frameworks) backed by government contracts or ownership, rather than relying solely on ESG scores.
- Prioritize utilities: The power infrastructure sector is central to the transition and technically feasible; it should serve as the foundation of the investment portfolio.
- Expand to transitionable sectors: Leveraging the advantage of sovereign diversification, sectors such as transportation, infrastructure, and metal mining—which have high consumption-side emissions but can undergo economic transition—can be included.
- Exclude oil & gas and coal mining: Due to their low technical transition feasibility and relatively small contribution to operational emissions.
- Leverage private markets: The $7 trillion financing gap implies that private direct lending opportunities are at least twice the size of the public market, and this scale will continue to grow.
As a third-party investment research analyst, the following are analysis notes on the GMO white paper chapter.
Theme and Background
This chapter argues that Emerging Market (EM) energy transition bonds represent a high-credit-quality, diversified investment opportunity with risk-adjusted returns superior to comparable Developed Market (DM) assets. The report's core thesis is that EM corporate bonds (including quasi-sovereign and project finance) have historically exhibited lower default intensity and loss rates than DM corporate bonds, while offering higher credit spreads, providing investors with a "spread after net loss" advantage.
Core Views
The author believes that the average credit quality of EM energy transition bonds can reach investment grade, allowing investors to allocate funds from their DM credit bond portfolios without generating significant tracking error and achieving a higher Sharpe ratio. The report presents a counterintuitive judgment: the credit risk of EM corporate bonds (especially infrastructure-related ones) is lower than that of comparable DM bonds, not higher. Furthermore, GMO emphasizes that through its proprietary quasi-sovereign investment process, it can identify and invest in assets whose energy transition plans are undervalued by the market or that carry a "fossil fuel discount," thereby generating excess returns.
Key Arguments and Data
The report supports its core views with historical data and comparative analysis.
1. Credit Risk and Return Advantage: By comparing the EM energy transition opportunity set with US corporate bonds across different rating categories, the data demonstrates that EM bonds feature "higher spreads and lower expected losses."
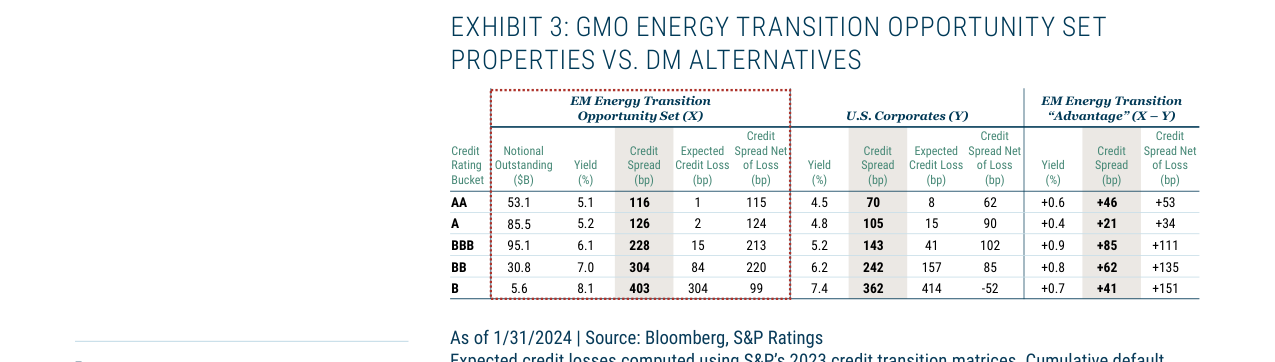
Comparing credit metrics across ratings for the EM Energy Transition Opportunity Set vs. DM US Corporates, BBB-rated EM credit spreads of 228 bps offer an 85 bps net spread advantage over DM (143 bps)
Table: EM Energy Transition Bonds vs. US Corporate Bonds – Credit Spread and Loss Comparison
| Credit Rating Range | EM Energy Transition Credit Spread (bp) | US Corporate Credit Spread (bp) | EM Expected Credit Loss (bp) | US Corporate Expected Credit Loss (bp) | EM Net Spread Advantage After Loss (bp) |
|---|---|---|---|---|---|
| AA | 115 | 62 | 1 | 8 | +53 |
| A | 124 | 90 | 2 | 15 | +34 |
| BBB | 213 | 102 | 15 | 41 | +111 |
| BB | 220 | 85 | 84 | 157 | +135 |
| B | 99 | -52 | 304 | 414 | +151 |
Source: GMO White Paper, based on Bloomberg, S&P data.
The report notes that EM infrastructure bonds benefit from structural/contractual enhancements (e.g., covenants, collateral, minimum revenue guarantees) and contingent support from investment-grade sovereign governments, which reduces their default risk.
2. Controllable Tracking Error: Using the BBB rating as an example, the historical spread differential between EM corporate bonds (CEMBI Broad Diversified) and US corporate bonds (Bloomberg US Corporate) typically fluctuates around 50 bps, except during extreme events like the Global Financial Crisis and the COVID-19 pandemic. Based on a 5-year duration, this corresponds to a maximum mark-to-market underperformance of less than 2.5%. Historical data shows the Sharpe ratio for EM investment-grade corporate bonds is 0.73, higher than the DM ratio of 0.69.
3. Impact of Energy Transition on Credit Quality: The report uses model simulations to show that energy transition plans can improve corporate credit quality (e.g., by reducing financial volatility). The chart below (Exhibit 6) illustrates the changes in credit spreads, expected losses, and potential valuation uplift for bonds of different ratings before and after implementing an energy transition (ET). For example, for a BBB-rated bond post-ET, the credit spread narrows from 213bp to 102bp, the net spread after loss decreases from 111bp to 85bp, alongside additional return potential from "fossil fuel discount" compression and active management.
Companies/Assets Mentioned
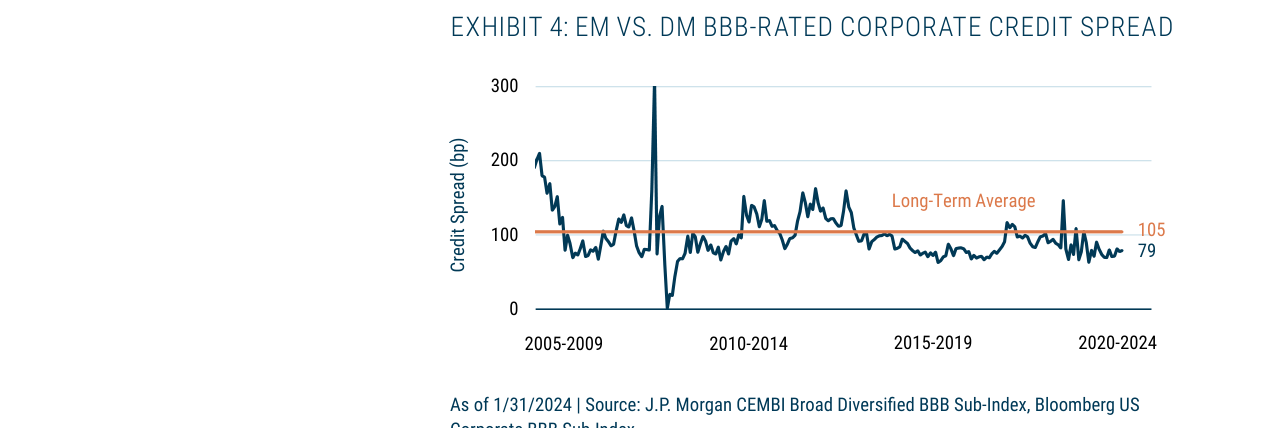
Historical data from 2005-2024 shows the average credit spread for EM BBB-rated corporate bonds was 105 bps, significantly higher than the 79 bps for DM
The report mentions several specific companies as case studies to illustrate its investment logic:
- CFE (Comisión Federal de Electricidad): Mexico's state-owned electric utility. The report believes its energy transition plan is undervalued by the market, making it a potential investment target (bullish).
- Paiton: A coal-fired power plant in Indonesia. The asset itself has no transition plan, but due to its quasi-sovereign status and a persistent "fossil fuel discount" in the market, its credit spread is wide. GMO believes it could still be investable if its total return potential (net of expected losses) is attractive.
- Other Companies Mentioned: The report lists more companies in a chart (Exhibit 7), including renewable energy companies (e.g., Adani Renewable, Greenko), transmission and distribution companies (e.g., AES Chile, EnfraGen), and utilities undergoing transition (e.g., Electrobras, PLN). These companies are used to demonstrate how GMO uses its scoring system to find mispriced opportunities near the "fair credit spread line."
Investment Implications
- Allocation Direction: Investors should consider reallocating a portion of their DM credit bond allocation towards EM corporate and project finance bonds related to the energy transition. This asset class offers higher net spreads without a significant increase in credit risk, and its tracking error impact on a traditional 60/40 portfolio is manageable.
- Source of Excess Returns: Active management is key. Investors should focus on fund managers capable of deeply analyzing sovereign energy transition plans, assessing the credit quality of quasi-sovereign entities, and identifying mispricing opportunities such as "fossil fuel discounts" or "undervalued transition plans."
- Risk Perception Correction: The market generally perceives EM bonds as riskier, but the report argues that in the specific area of energy transition, due to the structural protections and sovereign support of infrastructure bonds, their credit loss risk is actually lower than comparable DM assets. Investors need to revise this traditional perception.
Continuation Analysis: GMO's Quantitative Framework for Energy Transition Strategy and ESG Limitations
1. Empirical Advantages of Quantitative Credit Scoring and Spread Mapping
In the continuation, GMO presents its unique quantitative analysis framework (Figure 8), mapping the 5-year average credit spread (y-axis) against an aggregate fundamental score (x-axis, converted to rating agency letter grades). The key innovations of this method are:
- Migration of the Quasi-Sovereign Investment Process: Adapting a credit analysis framework originally used for sovereign debt (e.g., fiscal sustainability, institutional quality) to corporate bonds, particularly applicable to state-owned enterprises and energy transition-related issuers in emerging markets.
- Fair Credit Spread Line: A theoretical spread level for different credit qualities is determined via statistical regression. Securities deviating from this line are considered mispriced (over/under-valued). For instance, if a BBB-rated issuer's spread is 200 bps above the fair line, it may offer an excess return opportunity.
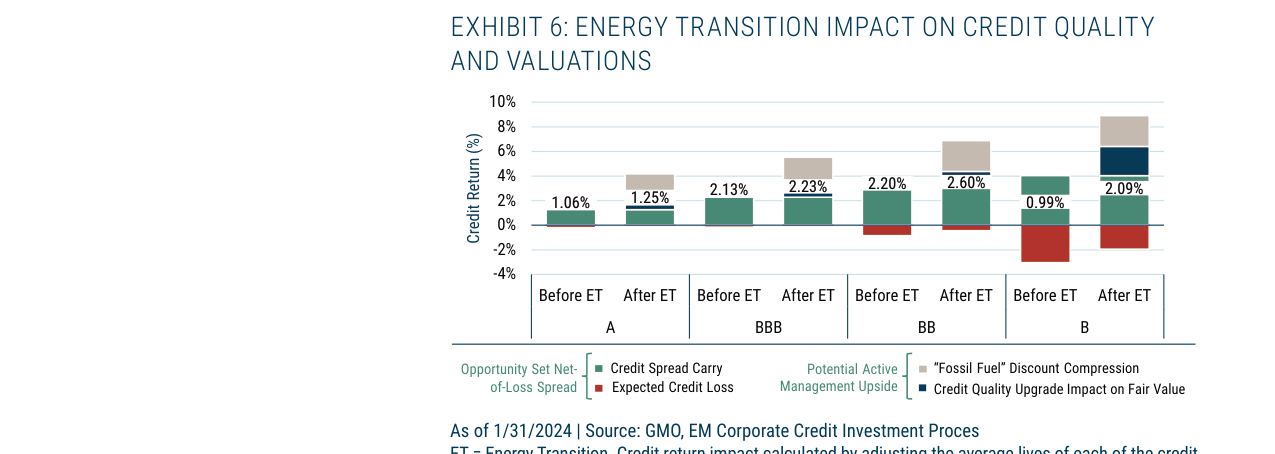
Energy transition significantly boosts returns for lower-rated credits, with BB-rated rising from 2.20% to 2.60% and B-rated from 0.99% to 2.09%, while higher-rated A and BBB show smaller increases
Data Support: As of January 31, 2024, the GMO Energy Transition Opportunity Set covers more than twice the number of issuers as the J.P. Morgan JESG CEMBI Broad Diversified Utilities Sub-Index, implying greater diversification potential and lower single-issuer concentration risk.
2. Structural Deficiencies of ESG Ratings in Energy Transition
The continuation offers sharp criticism of mainstream ESG investment approaches. The core arguments can be summarized as:
| Dimension | Mainstream ESG Rating Method | GMO Energy Transition Method |
|---|---|---|
| Objective Clarity | Conflates multiple objectives (environmental, social, governance measured simultaneously) | Focuses on credit risk and opportunities related to energy transition |
| Data Consistency | Large score discrepancies between different providers (Sustainalytics, MSCI, etc.) | Based on an internally consistent fundamental scoring framework |
| Outcome Effectiveness | Leads to "diluted outcomes," making it difficult to drive actual emission reductions | Directly identifies capital allocation opportunities related to energy transition |
| Coverage | JESG sub-index covers only half of the issuers | Opportunity set covers a broader range, including non-utility companies involved in transition |
Key Insight: ESG ratings attempt to simultaneously achieve the goals of "measuring corporate sustainability" and "guiding capital flows," but these two objectives have an inherent conflict in the energy transition space. For example, a company with high current carbon emissions but actively investing in carbon capture technology might be undervalued by traditional ESG ratings due to its high current emissions, but viewed as an investment opportunity under GMO's framework due to its transition potential.
3. Capital Needs and Market Growth for EM Energy Transition
The continuation reiterates the core thesis: Global emission reduction targets cannot be met without private capital participation. Specific data support includes:
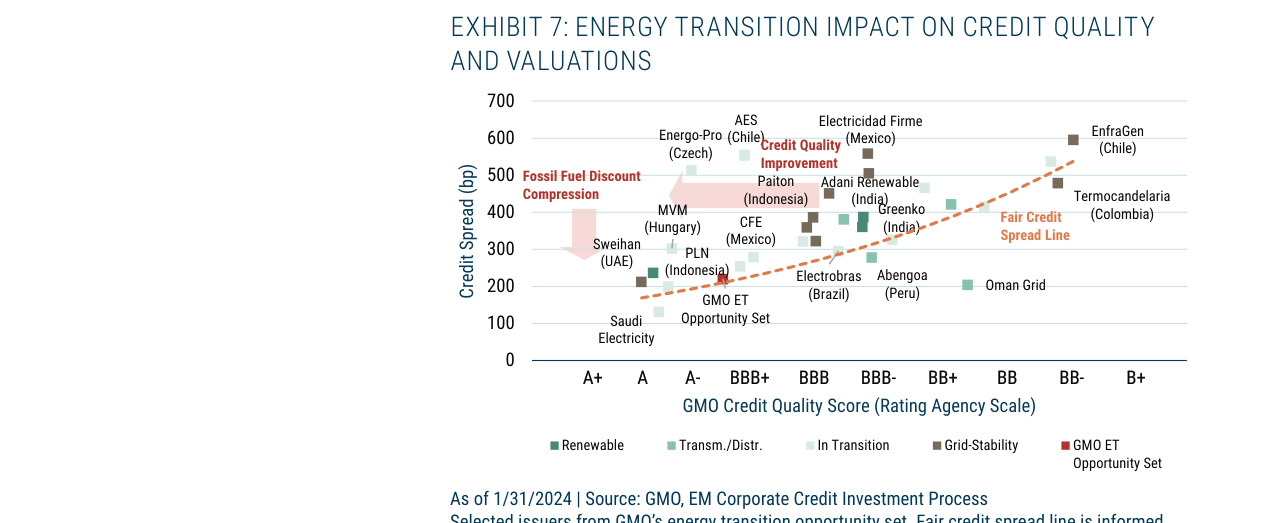
Scatter plot showing the relationship between issuer credit spreads and GMO credit quality scores. The GMO Energy Transition Opportunity Set has potential return from fossil fuel discount compression and credit quality upgrades relative to the fair credit spread line
- Scale of Investment Needs: The capital required for the energy transition in emerging markets far exceeds the supply capacity of the public sector (multilateral development banks, governments). According to IEA estimates, annual clean energy investment in emerging markets needs to exceed $1 trillion by 2030.
- Market Growth Trend: Instruments like green bonds and sustainability-linked bonds (SLBs) are growing at an average annual rate of 20-30% in emerging markets, providing a sufficient liquidity pool for active management.
4. The Necessity of Active Management: Beyond Passive and ESG Indices
The continuation implies, through the team's background (Sergey Sobolev and Mustafa Ulukan are both CFA charterholders with experience in investment banking, the World Bank, and private equity), that successful investing in this area requires:
- Cross-Asset Class Analytical Skills: Simultaneously understanding sovereign credit risk (e.g., national policy stability) and corporate fundamentals (e.g., project cash flows).
- Experience with Complex Financing Structures: EM energy transition projects often involve blended finance, guarantee structures, etc., requiring specialized due diligence.
- Dynamic Adjustment Capability: Energy transition policies (e.g., the EU's Carbon Border Adjustment Mechanism, CBAM) and geopolitical risks (e.g., the transition speed of Middle Eastern oil producers) require continuous monitoring.
Conclusion: Quantitative Framework + Active Management vs. Passive ESG
GMO's framework is essentially a factor investing strategy – treating energy transition as an independent credit risk factor and identifying pricing deviations through quantitative scoring. Compared to passive methods relying on external ESG ratings, its advantages are:
1. Higher Information Ratio: Covering a broader range of issuers through internal research, reducing "rating blind spots."
2. Clearer Attribution: Spread deviations can be decomposed into credit risk, liquidity premium, and energy transition thematic premium.
3. Greater Adaptability: Scoring weights can be adjusted based on market conditions (e.g., placing more emphasis on cash flow stability in a high-interest-rate environment).
For institutional investors, this approach may be more suitable as a satellite allocation within a fixed-income portfolio, rather than a core holding.