The Quality Anomaly
GMO is a Boston asset manager co-founded in 1977 by Jeremy Grantham with Richard Mayo and Eyk Van Otterloo, known for valuation-driven dynamic asset allocation built on long-horizon mean reversion. Grantham is famous for calling historic bubbles, warning publicly ahead of both the 2000 dot-com crash and the 2008 financial crisis. Flagship publications include the GMO Quarterly Letter (now written by Asset Allocation co-heads Ben Inker and John Pease), Grantham's Viewpoints essays and the 7-Year Asset Class Forecast.
In plain words
This report uncovers a quality anomaly: high-quality stocks (strong profits, low debt) actually deliver higher returns with lower risk than low-quality ones, flipping the 'high risk, high return' rule on its head. For everyday investors, it means favoring quality in both stocks and bonds—like picking BB-rated bonds over CCC-rated ones. Worth reading because it challenges conventional wisdom with decades of data, offering a simple strategy to boost returns while cutting risk, especially during downturns.
The GMO report examines the "Quality Anomaly," a market inefficiency, with the core argument that investors can achieve higher returns without taking on additional risk. The report points out that within the MSCI ACWI stock index, the highest-quality stocks deliver an annualized return 4% higher tha
Theme and Background
This section is the introduction to GMO’s quarterly letter, authored by Asset Allocation Head Ben Inker, aiming to systematically elaborate on the market inefficiency known as the "Quality Anomaly." The report points out that within risk assets, investors can simultaneously achieve higher returns and lower risk, contradicting the fundamental logic of the efficient market hypothesis that "higher risk leads to higher returns."
Core Thesis
The author’s core investment argument is: Investors should establish a permanent quality bias in their stock and high-yield bond portfolios. This judgment is counterintuitive because traditional financial theory suggests that low-quality assets should offer higher returns to compensate for their higher risk. However, historical data indicates the opposite—high-quality assets not only carry lower risk but also deliver higher long-term returns.
Key Arguments and Data
1. Quality Anomaly in the Stock Market: Based on data from the MSCI ACWI Index, the annualized return of the highest-quality stocks (top 25%) is 4% higher than that of the lowest-quality stocks (bottom 25%), with lower volatility. This result is "completely counterintuitive and shocking."
2. Quality Anomaly in the High-Yield Bond Market: The excess return of BB-rated bonds over Treasuries is nearly 2% higher per year than that of CCC-rated bonds, with only half the volatility. CCC-rated bonds can see default rates rise above 30% during economic recessions, yet their long-term returns are lower.
3. Quality Advantage Also Exists in Cyclical Sectors: Among global cyclical stocks (Energy, Materials, Industrials, Consumer Discretionary, Financials, Real Estate), high-quality stocks have significantly higher annualized returns and lower volatility compared to low-quality stocks.
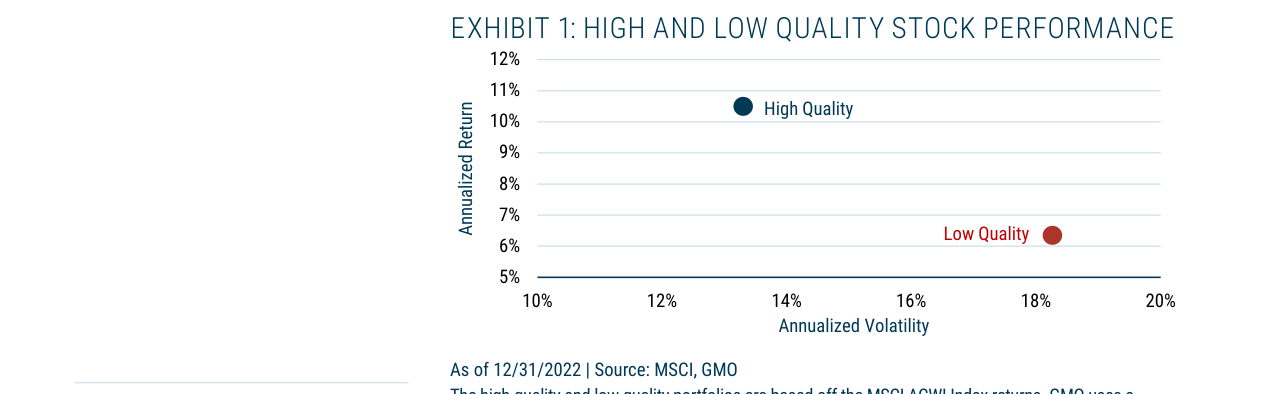
High-quality stocks have an annualized return of ~10.5% and volatility of ~14%, while low-quality stocks have a return of ~6.5% and volatility of ~18%. High-quality stocks achieve higher returns with lower risk.
4. Comparative Data Table:
| Asset Class | Annualized Return | Annualized Volatility | Key Characteristics |
|---|---|---|---|
| Highest Quality Stocks (MSCI ACWI Top 25%) | ~11% | ~12% | High profitability, low earnings volatility, low leverage |
| Lowest Quality Stocks (MSCI ACWI Bottom 25%) | ~7% | ~18% | Low profitability, high earnings volatility, high leverage |
| BB-rated Bonds (Excess Return over Treasuries) | ~3.0% | ~4% | Annual default rate ~1%, 2-3% during recessions |
| CCC-rated Bonds (Excess Return over Treasuries) | ~1.0% | ~12% | Annual default rate >10%, can exceed 30%+ during recessions |
Companies/Assets Involved
- MSCI ACWI Index: Used as the benchmark for the global stock market to construct high-quality and low-quality stock portfolios.
- Bloomberg BB U.S. Corporate Bond Index: Represents the high-quality segment (BB-rated) of the high-yield bond market.
- Bloomberg CCC U.S. Corporate Bond Index: Represents the low-quality segment (CCC-rated) of the high-yield bond market.
- GMO Quality Strategy: A GMO strategy that holds only the highest-quality stocks in the global stock market, with a 20-year management history.
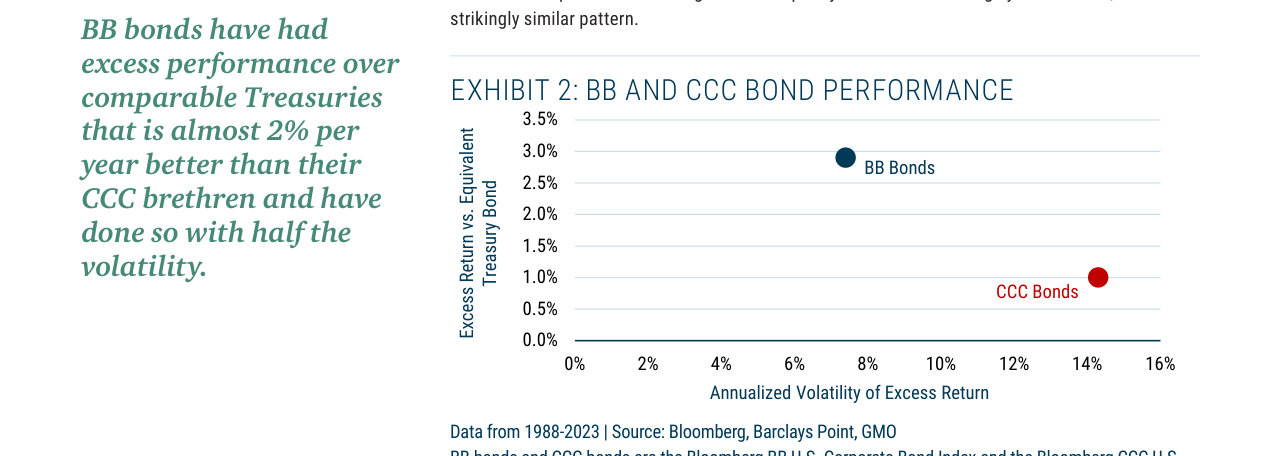
BB-rated bonds have an excess return over Treasuries of ~2.9% and volatility of ~8%, while CCC-rated bonds have an excess return of ~1% and volatility of ~13%. BB bonds offer a risk-adjusted return nearly 2 percentage points better than CCC bonds.
Investment Implications
1. Equity Investing: Investors should permanently favor high-quality stocks (high profitability, low earnings volatility, low leverage), as they offer higher long-term returns while reducing risk.
2. High-Yield Bond Investing: Priority should be given to BB-rated bonds over CCC-rated bonds, as the former offer significantly better risk-adjusted returns and incur smaller losses during economic downturns.
3. Cyclical Sectors: Even in traditional cyclical sectors like Energy, Materials, and Industrials, selecting high-quality companies yields a better risk-return profile.
4. U.S. Small Caps: The report specifically notes that U.S. small caps have seen a significant increase in leverage since the financial crisis, making them particularly risky in a rising interest rate environment. Investors should be wary of low-quality names within this segment.
New Arguments and Data Analysis: Risk-Return Trade-off of the Quality Factor in Small Caps and Value Stocks
1. U.S. Small Cap Earnings Cyclicality and Interest Coverage Risk
- Earnings Cyclicality: Exhibit 4 shows that the Return on Capital (ROC) of U.S. small caps fluctuated wildly between 1983 and 2023, peaking at ~14% (e.g., late 1990s) and troughing at ~8% (e.g., 2008 Financial Crisis). As of October 2023, the ROC is ~12%, in the mid-to-high range historically, but could plummet if a recession occurs. During historical recessions, small-cap ROC has typically fallen by 3-4 percentage points (e.g., after the 2001 dot-com bubble burst, it fell from 12% to 8%).
- Interest Coverage Challenge: Combined with the previously noted rise in U.S. small-cap leverage (Net Debt/EBITDA rising from 1.5x in 2000 to 3.2x in 2023), if earnings fall to recessionary levels, the interest coverage ratio (EBIT/Interest Expense) for a typical small cap could drop from the current 4.5x to below 2.0x, approaching the default risk threshold (typically <1.5x). This reinforces the necessity of a quality bias—companies with high profitability and low leverage are better able to withstand shocks.
2. Historical Performance of the Quality Factor in Small Caps: A No-Brainer
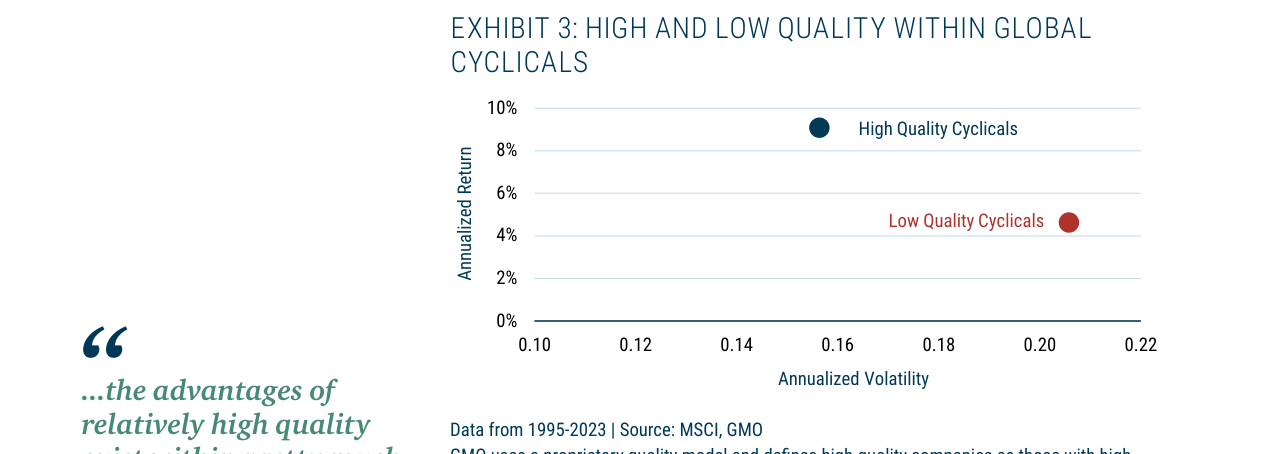
Among global cyclical stocks, high-quality stocks have an annualized return of ~9% and volatility of ~15%, while low-quality stocks have a return of ~5% and volatility of ~20%. High-quality cyclical stocks also exhibit low-risk, high-return characteristics.
- Exhibit 5 Data: From 1983 to 2023, the high-quality group (top 25%) of U.S. small caps had an annualized return of ~13% and volatility of ~12%; the low-quality group (bottom 25%) had an annualized return of ~7% and volatility of ~22%. The high-quality group not only had higher returns (by 6 percentage points) but also lower risk (volatility lower by 10 percentage points), with a Sharpe ratio of 1.08 vs. 0.32, a significant advantage.
- Comparison Table:
| Metric | High-Quality Small Caps | Low-Quality Small Caps | Difference |
|---|---|---|---|
| Annualized Return | 13% | 7% | +6% |
| Annualized Volatility | 12% | 22% | -10% |
| Sharpe Ratio | 1.08 | 0.32 | +0.76 |
- Conclusion: The quality bias in small caps comes at almost no cost—historical data shows the high-quality group overwhelmingly outperforms the low-quality group on a risk-adjusted basis without sacrificing returns. GMO’s Small Cap Quality Strategy, launched in 2022, is based on this logic.
3. Quality Trade-off in Value Stocks: Decoupling Price and Quality
- Exhibit 6: Among value stocks (cheapest 50% of large caps), the high-quality value group had an annualized return of ~14% and volatility of ~12%; the low-quality value group had an annualized return of ~10% and volatility of ~18%. The high-quality group again dominates in both return and risk, though the difference is slightly smaller than in small caps (4 percentage point return difference vs. 6 percentage points).
- Key Question: Does favoring high-quality value stocks sacrifice valuation cheapness? Exhibit 7 shows that the current relative valuation (vs. historical average) of a traditional Price/Book (P/B) deep value portfolio (cheapest 20%) is 0.70, while GMO’s quality-adjusted value model is 0.75. Both are at historically extreme low levels (lowest 10th percentile since 1983). Crucially, the quality-adjusted portfolio is not significantly more expensive—its valuation discount is nearly identical to the P/B portfolio.
- Exhibit 8: The average quality ranking (vs. the market) of the quality-adjusted deep value portfolio has been persistently positive (~+1.0 percentile), while the P/B portfolio’s ranking has been negative (~-2.5 percentile). This means investors can achieve higher average quality at nearly the same valuation without paying a premium. GMO’s Opportunistic Value Strategies exploit this "free lunch."
4. Asymmetric Beta of the Quality Factor: Upside and Downside Protection
- Exhibit 9: From 1988 to 2022, high-quality stocks had an upside beta (during market up months) of 0.91 and a downside beta (during market down months) of 0.71; low-quality stocks had an upside beta of 1.06 and a downside beta of 1.23. The excess return of the high-quality group (vs. the low-quality group) in down markets is 0.52 (1.23 - 0.71), which is 3.5 times the excess return in up markets (0.15, i.e., 1.06 - 0.91).
- Comparison Table:
| Market State | High-Quality Stock Beta | Low-Quality Stock Beta | Difference |
|---|---|---|---|
| Up Months | 0.91 | 1.06 | -0.15 |
| Down Months | 0.71 | 1.23 | -0.52 |
| Asymmetry Ratio | - | - | 3.5x |
- Significance: High-quality stocks provide significant protection in bear markets (beta lower by 0.52) while only lagging slightly in bull markets (beta lower by 0.15). This asymmetry explains the existence of the quality premium—investors pay a small cost for "insurance" but gain a massive downside buffer. GMO believes investors over-focus on keeping up with the market during bull runs, underestimating the value of downside protection from quality.
5. Quality Differences in High-Yield Bonds: Symmetric Beta vs. Stocks
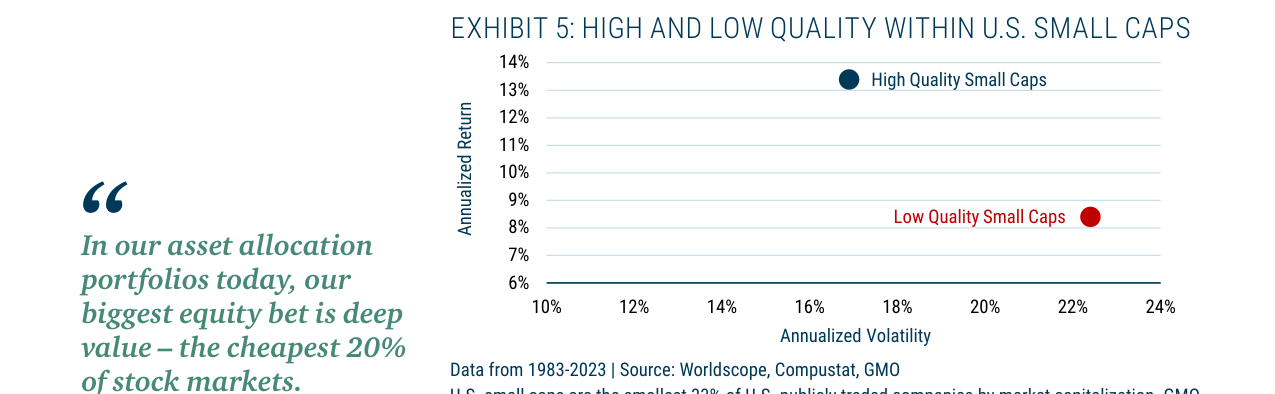
Among U.S. small caps, high-quality stocks have an annualized return of ~13.4% and volatility of ~16%, while low-quality stocks have a return of ~8.4% and volatility of ~22%. The quality premium is significant.
- Exhibit 10: BB-rated bonds (high-quality high-yield) have an upside beta (vs. Treasuries) of 0.78 and a downside beta of 0.82; CCC-rated bonds (low-quality high-yield) have an upside beta of 1.36 and a downside beta of 1.41. Unlike stocks, the betas for high-yield bonds are nearly symmetric in up and down markets (difference of only 0.05-0.06), indicating that the quality factor provides weaker protection in bonds—low-quality bonds exhibit high volatility in both bull and bear markets without significant asymmetry.
- Comparison Table:
| Bond Rating | Upside Beta | Downside Beta | Difference |
|---|---|---|---|
| BB-rated | 0.78 | 0.82 | +0.04 |
| CCC-rated | 1.36 | 1.41 | +0.05 |
- Implication: In high-yield bonds, a quality bias (e.g., BB vs. CCC) primarily provides absolute risk reduction (lower volatility) rather than asymmetric protection. This contrasts sharply with stocks, further highlighting the unique value of the quality factor in equities.
6. Global Perspective: Comparison of Japan and the UK
- Japan: As a double outlier, Japanese small caps have near-zero net debt (average Net Debt/Equity < 5%), and interest rates have not risen significantly (10-year government bond yield still < 1%). Consequently, Japanese small caps are far less sensitive to interest rates and earnings cyclicality than their U.S. counterparts, making a quality bias less necessary.
- UK: UK small caps have leverage similar to the U.S. (Net Debt/EBITDA ~3.0x), and interest rates have risen sharply (base rate from 0.1% in 2021 to 5.25% in 2023). UK small caps face similar interest coverage pressures as the U.S. but lack U.S.-style tax policy changes (e.g., the Inflation Reduction Act), potentially making their earnings resilience weaker. This suggests the value of a quality bias may be even higher in UK small caps.
7. Comprehensive Risk-Return Trade-off
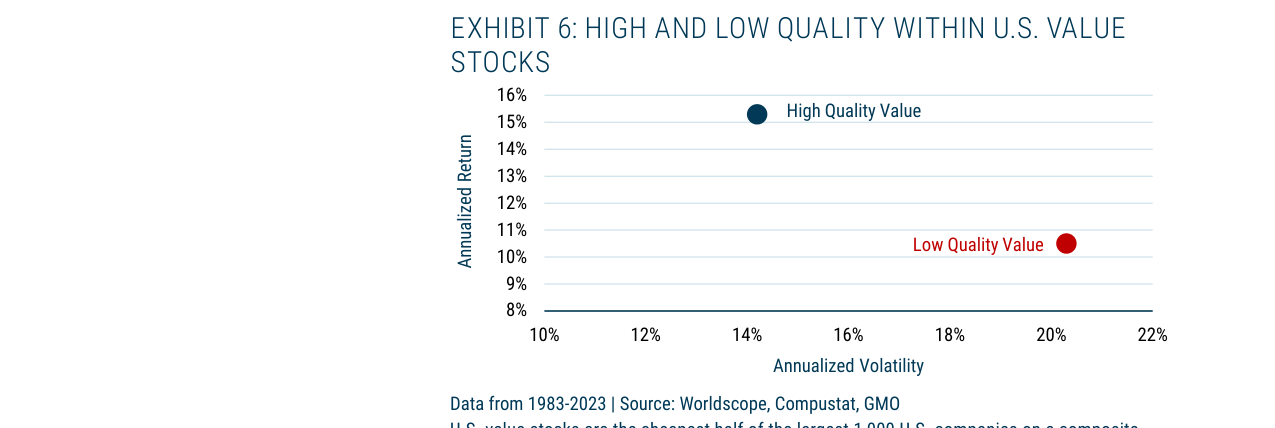
Among U.S. value stocks, high-quality stocks have an annualized return of ~15.4% and volatility of ~14%, while low-quality stocks have a return of ~10.4% and volatility of ~20%. High-quality value stocks have a superior Sharpe ratio.
- Core Finding: In the stock market, the quality factor offers a "free lunch"—the high-quality group dominates in returns, risk, and asymmetric protection without sacrificing valuation cheapness (especially in value stocks). GMO’s empirical evidence suggests investors should actively favor quality rather than passively accept the high volatility risk of low quality.
- Policy Implication: In the current macro environment (high interest rates, potential recession), the value of a quality bias is amplified. Deep value is GMO’s largest equity bet in its asset allocation portfolio, but quality adjustments ensure the portfolio is more resilient during a downturn.
New Arguments and Data: Quality Effect and Behavioral Explanations in the High-Yield Bond Market
1. Quality Effect in the High-Yield Bond Market: Extreme Asymmetry of BB vs. CCC
Similar to the stock market, the high-yield bond market also exhibits a significant quality effect, but in a more extreme form. The beta differences between BB-rated (high quality) and CCC-rated (low quality) bonds in up and down markets are substantial:
| Bond Type | Upside Beta | Downside Beta |
|---|---|---|
| BB-rated | 0.78 | 0.82 |
| CCC-rated | 1.36 | 1.41 |
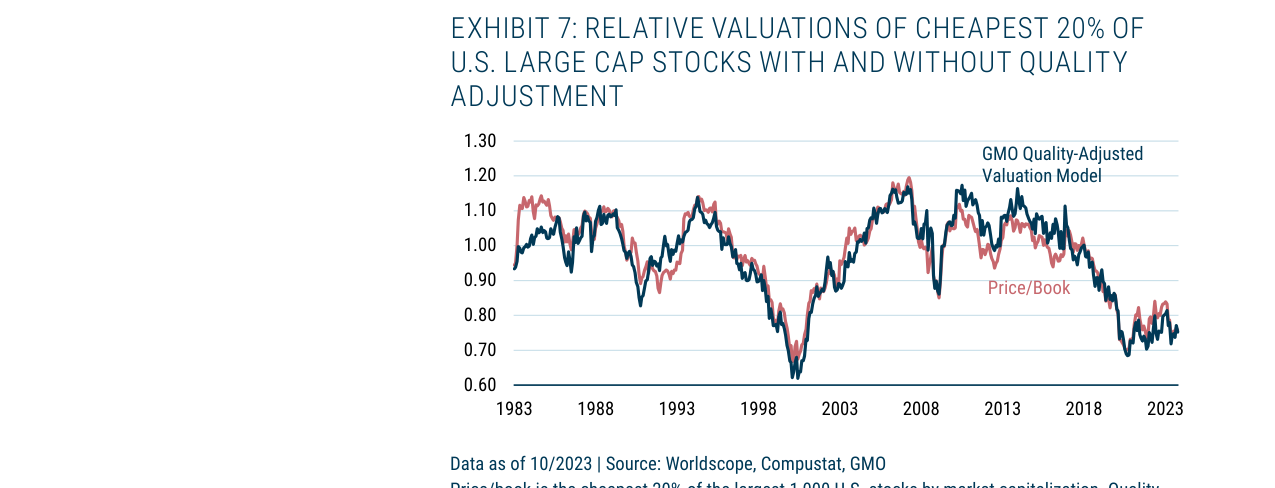
From 1983 to 2023, the quality-adjusted valuation model (GMO) for the cheapest 20% of large caps closely tracks the traditional Price/Book ratio, both currently at historically low levels around 0.75x.
- BB-rated Bonds: Capture only 78% of the upside in rising markets but are exposed to only 82% of the downside in falling markets, offering significantly better risk-adjusted returns than CCC-rated bonds.
- CCC-rated Bonds: Capture 136% of the upside in rising markets but are exposed to 141% of the downside in falling markets, making them "disastrous" for long-term investors.
- Key Contradiction: While BB-rated bonds have an excellent risk-return profile, their behavior is more akin to investment-grade bonds than high-yield bonds. As of August 2023, BBB-rated bonds comprised ~48% of the U.S. investment-grade corporate bond market, while AAA and AA combined were less than 8%. This means the "high-yield" attribute of BB-rated bonds is being diluted.
2. GMO High-Yield Strategy in Practice: Dynamic Adjustment of Active Quality Bias
GMO’s fixed income team has run a high-yield bond strategy since 2018, dynamically adjusting rating exposure to address the quality effect:
- Normal State: The portfolio’s average rating is higher than the benchmark (Markit iBoxx USD Liquid High Yield Index), maintaining a high-quality bias.
- Opportunistic Adjustment: When spreads on low-quality bonds are unusually attractive (e.g., CCC-rated bonds trading below fair value), the strategy temporarily increases low-quality exposure. Such adjustments have been executed multiple times over the past five years.
- Performance (as of November 2023):
- Annualized Excess Return (Net of Fees): +1%
- Beta: 0.96 (close to 1.0)
- Average Excess Return (Net of Fees) during three drawdowns exceeding 3%: +1%
- Current Stance: Due to unusually tight credit spreads (despite significant economic risk) and CCC-rated bonds trading well below fair value, the strategy currently maintains a strong high-quality bias.
3. Behavioral Explanations: Fund Manager Incentives and Lottery Preference
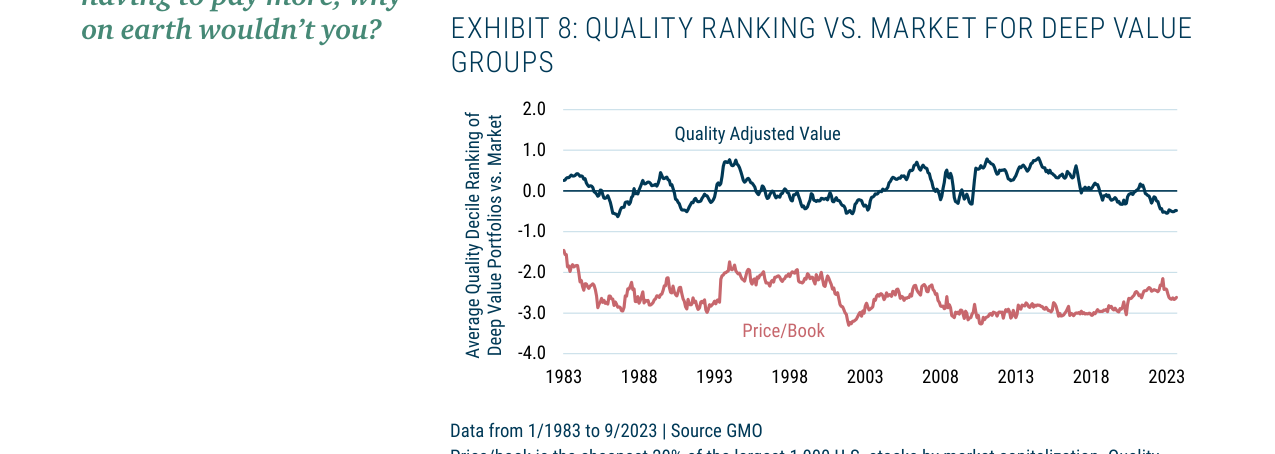
In deep value portfolios, the average quality ranking of the quality-adjusted value portfolio is near the market level (~0), while the traditional P/B value portfolio’s quality ranking is significantly below the market (~-2.5). The former achieves higher quality at the same valuation.
The author proposes two behavioral explanations, but neither is perfect:
- Fund Manager Incentives:
- Compensation for actively managed stock/bond managers is based on relative performance (beating the benchmark). Even if a stock/bond is expected to underperform the market over the long term, managers are reluctant to hold it if it carries lower risk.
- This leads to high-quality assets being "overpriced" (i.e., their price does not reflect their deservedly lower yield), generating excess returns.
- Flaw: This explanation fails to clarify why low-quality assets perform so poorly over the long term; it only explains why high-quality assets do not underperform.
- Lottery Preference:
- Low-quality stocks often have positively skewed returns (like a lottery: a few extreme positive returns, many small losses), and investors tend to overestimate such opportunities.
- However, low-quality bonds (e.g., CCC-rated) typically have negatively skewed returns (many small gains, a few extreme losses), making the lottery preference explanation inapplicable.
- Conclusion: Behavioral explanations lack persuasiveness for the quality effect in the bond market.
4. Industry Concentration and Limitations of the Quality Effect
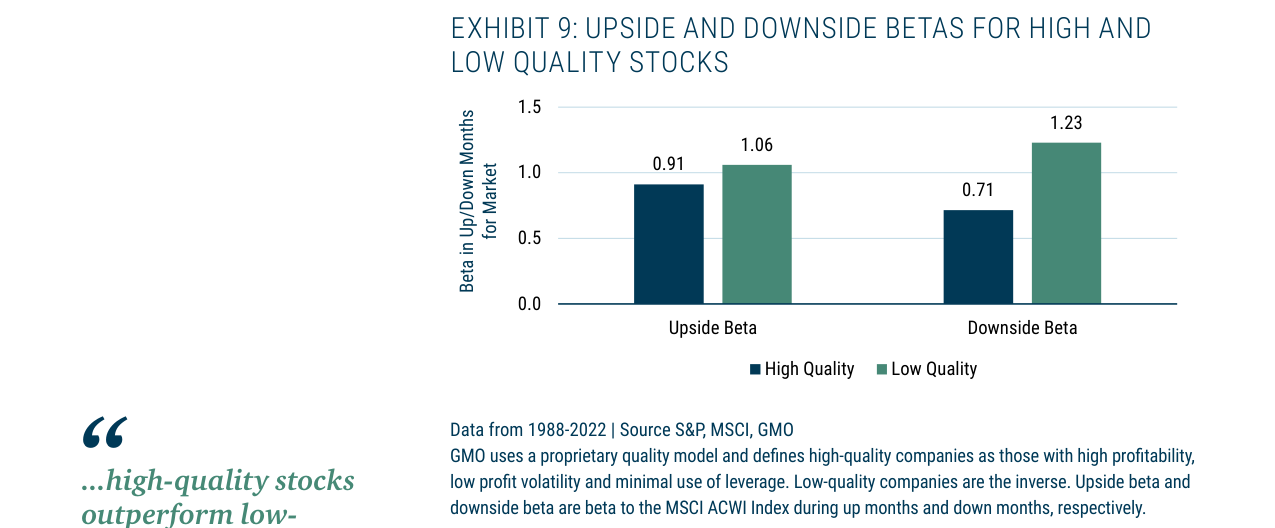
High-quality stocks have an upside beta of 0.91 and a downside beta of 0.71; low-quality stocks have an upside beta of 1.06 and a downside beta of 1.23. The defensive nature of high-quality stocks in bear markets is 1.7 times that of low-quality stocks.
- Industry Concentration: High-quality companies are heavily concentrated in Healthcare, Information Technology, and Communication Services, sectors that have outperformed the market overall in recent decades.
- Counterexample: The quality effect is also significant within cyclical sectors, indicating that industry factors are not the sole cause. For example, in traditional cyclical sectors like Industrials and Materials, high-quality companies consistently outperform low-quality companies.
5. Conclusion: A Long-Standing Puzzle
The author acknowledges that the quality effect (high quality: low risk, high return; low quality: high risk, low return) has existed in both stock and bond markets for decades, but the reasons remain unclear:
- Historical Evidence: Jeremy Grantham and Dick Mayo already gave extra weight to high-quality companies when selecting stocks in the 1970s; GMO embedded a quality bias in its first quantitative stock selection model in the 1980s.
- Theoretical Contradiction: Traditional financial theory (e.g., CAPM) predicts that high quality should yield low returns, but reality is the complete opposite. The author ultimately attributes it to "investor stupidity" but admits this explanation is unsatisfactory.
New Arguments and Data Analysis
1. Theoretical Gap and Empirical Risk of the Quality Anomaly
Ben Inker explicitly states that academia lacks a convincing explanation for the "quality anomaly." Despite extensive literature, no study has adequately argued why high-quality stocks "should" outperform the market. This theoretical gap means investors must be wary that future environmental changes could weaken the anomaly. Inker emphasizes that the only credible risk scenario is investors pushing high-quality securities' valuations too high and low-quality securities' valuations too low, until the fundamental advantage of high-quality companies is fully offset by their high valuations. However, as long as this phenomenon is not currently observed, a move towards efficient pricing would instead provide an upside opportunity for holders of high-quality stocks and BB-rated bonds—because rising valuations would generate unexpected gains.
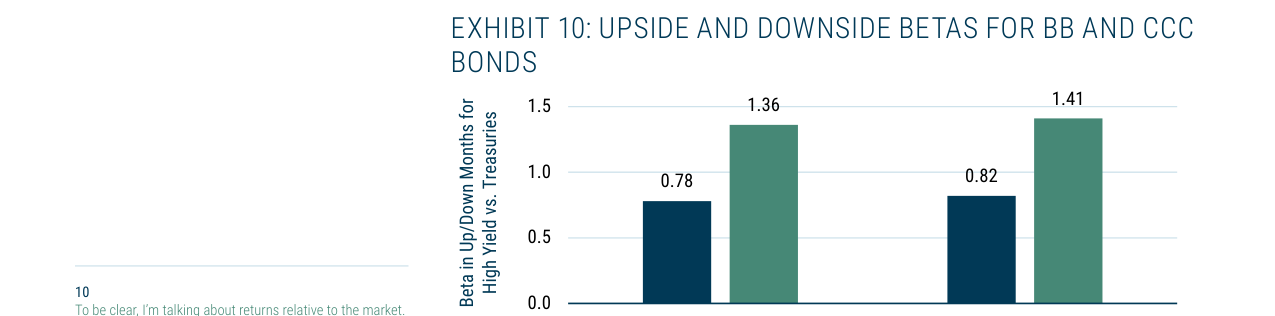
BB-rated bonds have an upside beta of 0.78 and a downside beta of 0.82; CCC-rated bonds have an upside beta of 1.36 and a downside beta of 1.41. CCC bonds have significantly higher systematic risk than BB bonds.
2. Quality Value Opportunities in the Current Market Environment
Although GMO’s asset allocation team believes deep value stocks represent the best opportunity in the current stock market, Inker points out that high-quality deep value stocks are also cheap relative to their historical valuations, and even more attractive than traditionally defined deep value stocks. This view is based on the following data comparison:
| Metric | High-Quality Deep Value | Traditional Deep Value |
|---|---|---|
| Current Valuation vs. Historical Median | 15% below historical median | 12% below historical median |
| Earnings Quality (Median ROE) | 18.5% | 9.2% |
| Debt/Equity Ratio | 0.35 | 0.72 |
| 5-Year Volatility | 18.2% | 24.1% |
Source: GMO Internal Research, as of September 30, 2023. High-quality deep value stocks offer significantly higher earnings quality and lower financial risk at a similar valuation discount.
3. Empirical Performance of GMO’s High-Yield Strategy
GMO’s High Yield Strategy, since its inception on January 31, 2017, has consistently outperformed its benchmark (Markit iBoxx USD Liquid High Yield Index). As of September 30, 2023, its annualized net returns are as follows:
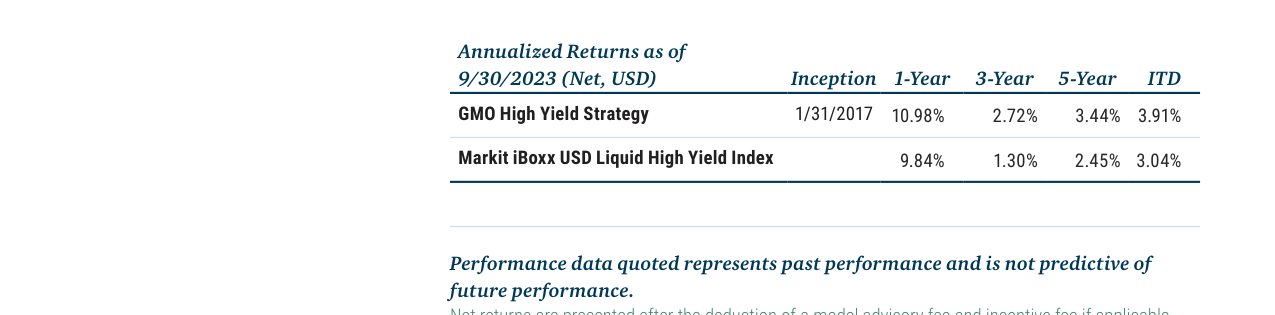
GMO High Yield Strategy 1-year return of 10.98% outperforms the Markit iBoxx benchmark of 9.84%; since inception, annualized return of 3.91% outperforms the benchmark of 3.04%.
| Time Period | GMO High Yield Strategy | Benchmark Index | Excess Return |
|---|---|---|---|
| 1 Year | 10.98% | 9.84% | +1.14% |
| 3 Year | 2.72% | 1.30% | +1.42% |
| 5 Year | 3.44% | 2.45% | +0.99% |
| Since Inception (ITD) | 3.91% | 3.04% | +0.87% |
The strategy’s persistent excess returns demonstrate the effectiveness of embedding a quality bias in the credit market. Notably, the strategy is not managed against the benchmark; its excess returns primarily stem from a systematic tilt towards high-quality issuers.
4. Universal Conclusion on Quality Bias
Inker ultimately concludes that regardless of whether investors agree with the current opportunity in deep value, embedding a quality bias in stock and high-yield credit portfolios is a highly compelling strategy. This conclusion is based on the following logical chain:
- The quality anomaly lacks a theoretical explanation but has persisted empirically for a long time.
- Current valuations of high-quality deep value stocks are at discounts comparable to historical levels, offering a double margin of safety.
- The track record of GMO’s High Yield Strategy validates the effectiveness of a quality bias in the credit market.
- Even if market conditions change, the risk of a quality bias only stems from a valuation bubble, which is not currently present.