Japan: The Land of the Rising Profits
GMO is a Boston asset manager co-founded in 1977 by Jeremy Grantham with Richard Mayo and Eyk Van Otterloo, known for valuation-driven dynamic asset allocation built on long-horizon mean reversion. Grantham is famous for calling historic bubbles, warning publicly ahead of both the 2000 dot-com crash and the 2008 financial crisis. Flagship publications include the GMO Quarterly Letter (now written by Asset Allocation co-heads Ben Inker and John Pease), Grantham's Viewpoints essays and the 7-Year Asset Class Forecast.
In plain words
Many think Japan's profit surge is due to a shareholder-friendly shift, but GMO argues it's actually from decades of debt reduction — lower interest expenses boosted profits, not active payout increases. Valuations remain cheap and the yen is undervalued, creating opportunities. But beware of the 'Japan has changed' narrative; the real driver is financial restructuring.
GMO report Japan: A Land of Rising Profits points out that the significant improvement in Japanese corporate profitability is primarily driven by long-term deleveraging, rather than a shift toward shareholder value maximization (SVM). Data shows that between 1960 and 2012, Japan's return on sales av
Theme and Background
This chapter delves into the fundamental reasons behind the significant improvement in Japanese corporate profitability. The author questions the market's widely accepted explanation of a "Shareholder Value Maximization (SVM) awakening," proposing a more concise alternative framework. The core background is a structural shift in Japanese companies from extremely low return on sales (averaging below 3%) between 1960 and 2012 to levels approaching international norms (averaging nearly 5.5%) after 2012.
Core Thesis
The author's central argument is that the primary driver of rising Japanese corporate profits is long-term deleveraging, not a shift toward SVM. Counterintuitive judgments include:
- Operating profits have not reached record highs; levels were higher in the 1960s and 1970s.
- The key difference behind the substantial increase in ordinary profits lies in the sharp decline in interest expenses.
- The payout ratio for listed companies has barely improved, further weakening the SVM narrative.
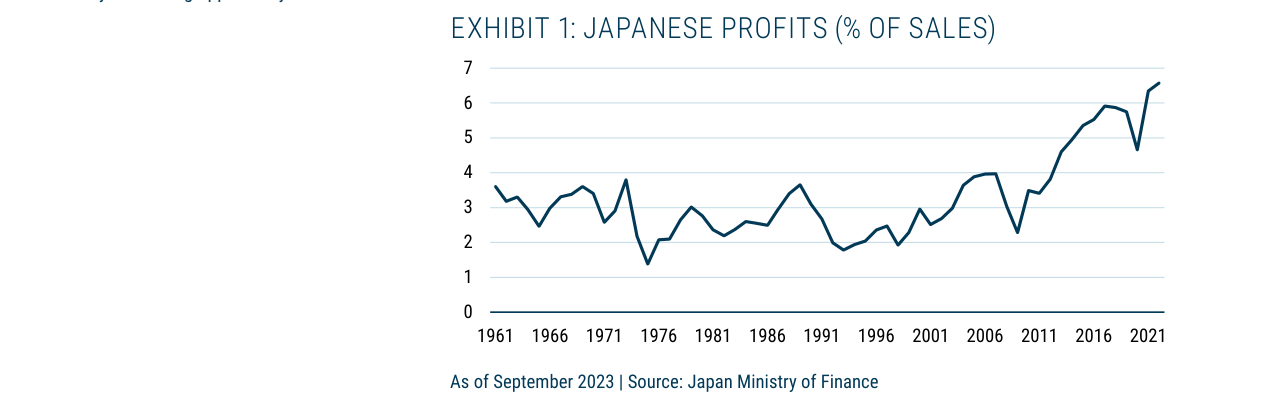
Japanese corporate profit margins rose from an average of less than 3% between 1960 and 2012 to approximately 6.5% in 2021, climbing significantly after 2012 to hit a 60-year high.
Key Arguments and Data
The author supports the thesis by comparing the differences between operating and ordinary profits and by decomposing the macro-level Kalecki equation.
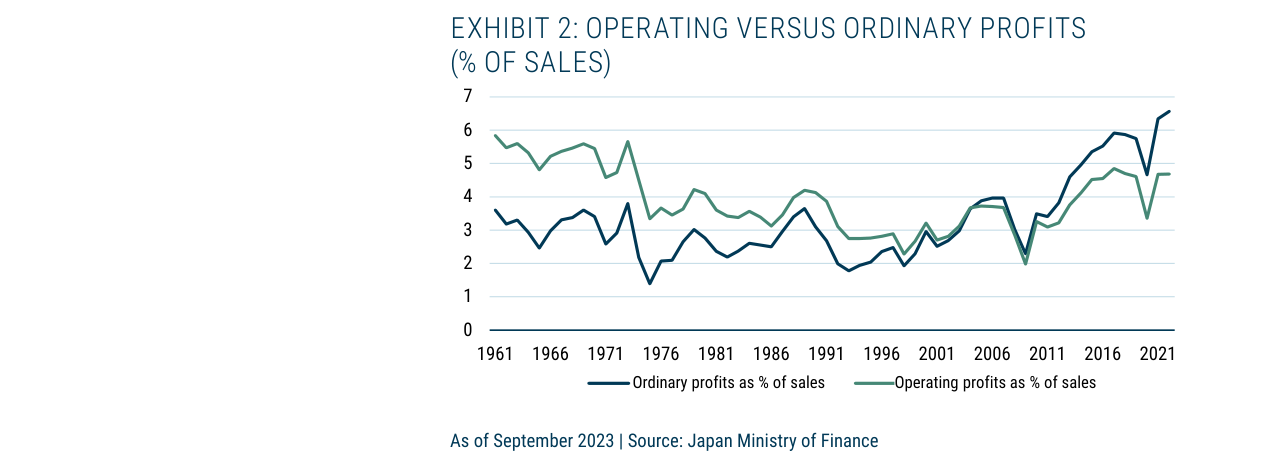
The ordinary profit margin rose from about 3% to roughly 6% after 2012, while the operating profit margin remained at 4-5% and did not reach a record high.
1. Profit Structure Decomposition (Micro Level)
- From 1960 to 2012, the average return on sales was below 3%; after 2012, it rose to nearly 5.5%.
- Operating profits were higher in the 1960s and 1970s; recently, they are only 0.4% above the long-term historical average (as a percentage of sales).
- Over 60% of the significant increase in ordinary profits is attributable to the sharp decline in interest expenses.
Table 1: Decomposition of Differences Between Operating and Ordinary Profits (% of Sales)
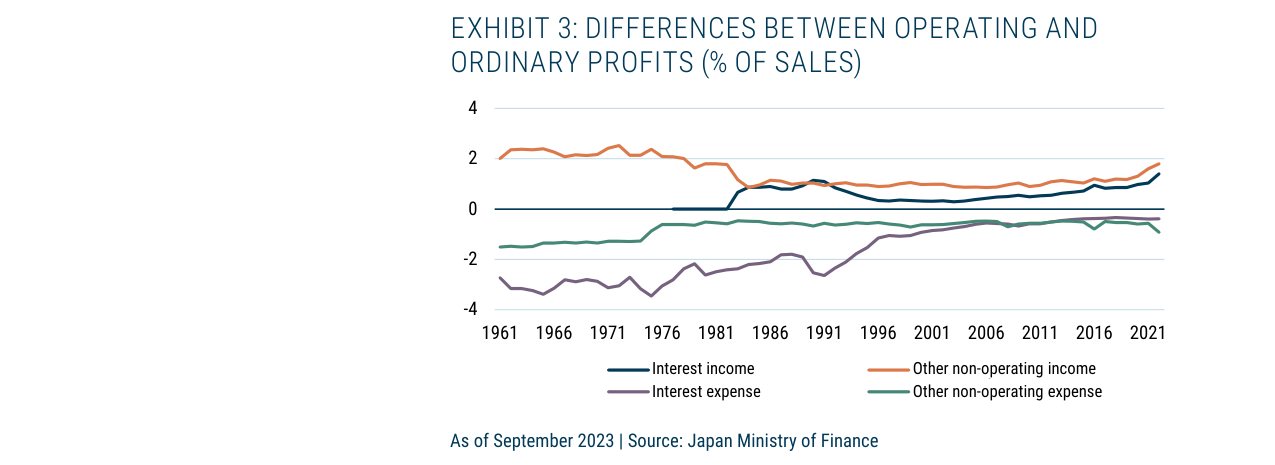
Interest expenses as a percentage of sales fell sharply from about 2% in the 1980s to near 0% in recent years, becoming the main driver of profit growth.
| Period | Operating Profit | Interest Income | Interest Expense | Other Non-Operating Income | Other Non-Operating Expenses | Ordinary Profit |
|---|---|---|---|---|---|---|
| 1960-2012 | 3.9% | 0.3% | 2.0% | 1.5% | 0.8% | 2.8% |
| 2012-2022 | 4.3% | 0.9% | 0.4% | 1.3% | 0.6% | 5.4% |
| Difference | +0.4% | +0.5% | -1.6% | -0.2% | -0.2% | +2.6% |
2. Macro Drivers (Kalecki Equation)
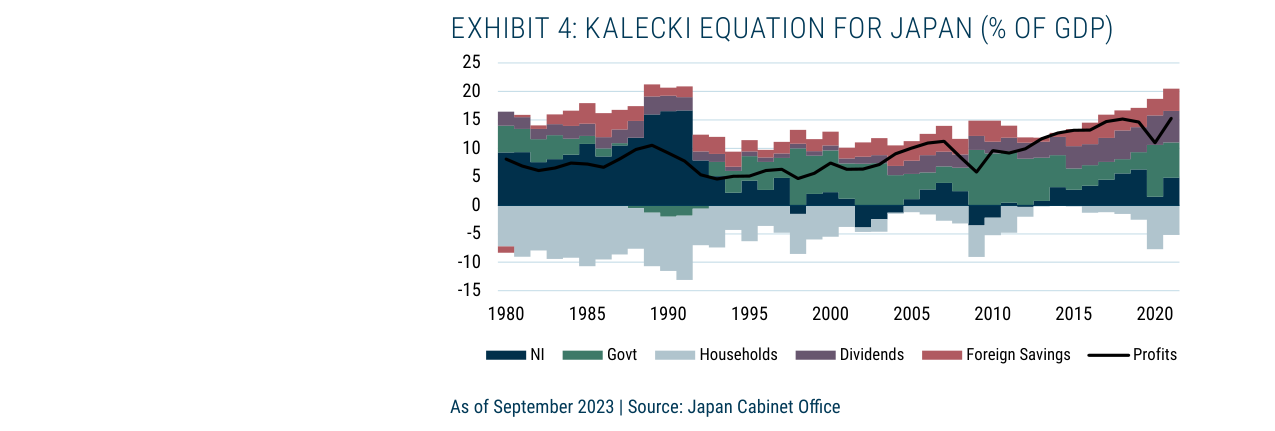
From 2012-2022 compared to 1960-2012, a 1.6 percentage point decline in interest expenses drove a 2.6 percentage point increase in ordinary profits.
Table 2: Kalecki Decomposition of Japanese Profits (% of GDP)
| Period | Net Investment | Government Savings | Household Savings | Dividends | Foreign Savings | Profits |
|---|---|---|---|---|---|---|
| 1980-1989 (Bubble) | 10.08% | -2.12% | 8.80% | 2.32% | -2.02% | 7.74% |
| 1990-2012 (Lost Decade) | 2.67% | -5.01% | 4.47% | 1.69% | -2.55% | 7.44% |
| 2013-2021 (Recovery) | 3.65% | -4.93% | 2.20% | 4.22% | -2.89% | 13.49% |
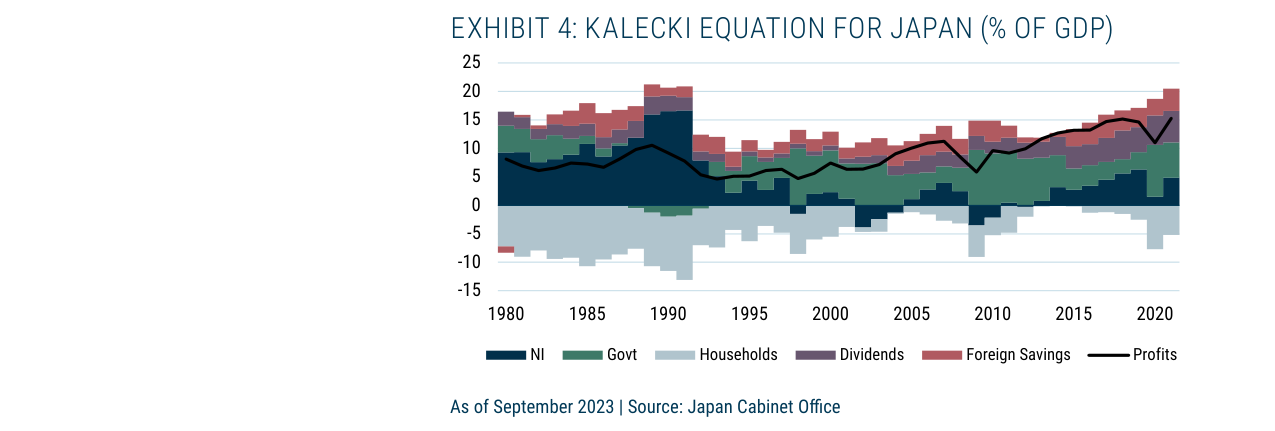
Profits as a percentage of GDP rose from about 10% in the 1980s to roughly 15-20% in recent years, showing changes in macro drivers like net investment and dividends.
- Profits in the recovery period (13.49% of GDP) nearly doubled compared to the lost decade (7.44%).
- Main drivers of profit growth: increased dividends (contributing ~40%) and declining household savings (contributing ~40%).
- The decline in household savings aligns with the deleveraging logic: lower corporate interest expenses lead to lower household interest income, forcing a reduction in the savings rate to maintain consumption.
- Of the dividend growth, 60-65% came from profit improvement, with the remainder from a higher payout ratio. However, the payout ratio for listed companies (Exhibit 5, orange line) has barely changed, suggesting the overall increase in the payout ratio is mainly driven by unlisted companies.
Companies/Assets Involved
This chapter does not mention specific company names, primarily analyzing the financial behavior of Japan Inc. Key data sources include Japan's Ministry of Finance and the Cabinet Office.
Investment Implications
- Beware of the SVM Narrative Trap: The market generally believes that Japanese corporate governance reforms will boost shareholder returns, but the author argues that profit improvement is mainly due to deleveraging, not a proactive increase in shareholder returns. Investors should not over-rely on valuation re-rating driven by SVM.
- Focus on the Deleveraging Dividend: In a low-interest-rate environment, corporate interest expenses continue to decline, converting cash flow into profits. This structural change may be persistent, but the room for marginal improvement is narrowing.
- Value Investment Opportunity: Despite fundamental improvements, Japanese stock market valuations have continued to de-rate, creating potential opportunities for value investors. The author implies that the market may not have fully priced in the sustainability of profit improvement.
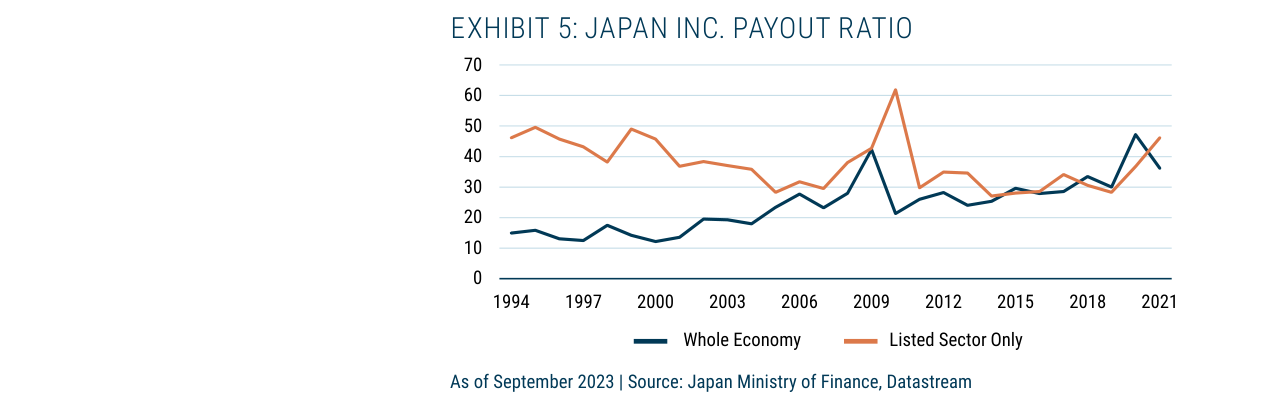
The payout ratio for listed companies fluctuated upward from about 45% in 1994 to roughly 45-50% in 2021, while the overall economy's payout ratio rose from 15% to 35%.
Additional Arguments and Data Analysis: Deep-Seated Drivers of Japanese Corporate Savings Behavior and External Scrutiny
1. Contradiction Between Corporate Cash Accumulation and the SVM Narrative: A Data-Driven Re-examination
Core Contradiction: Although the SVM narrative claims Japanese companies have become shareholder-friendly, data from Exhibits 8 and 9 show that the total debt of TOPIX-listed companies rose by about 15% between 2012 and 2022 (from approximately ¥400 trillion to ¥460 trillion), while net debt fell by about 30% over the same period (from about ¥250 trillion to ¥175 trillion). The gap between them (i.e., cash reserves) expanded from about ¥150 trillion in 2012 to ¥285 trillion in 2022, an increase of 90%.
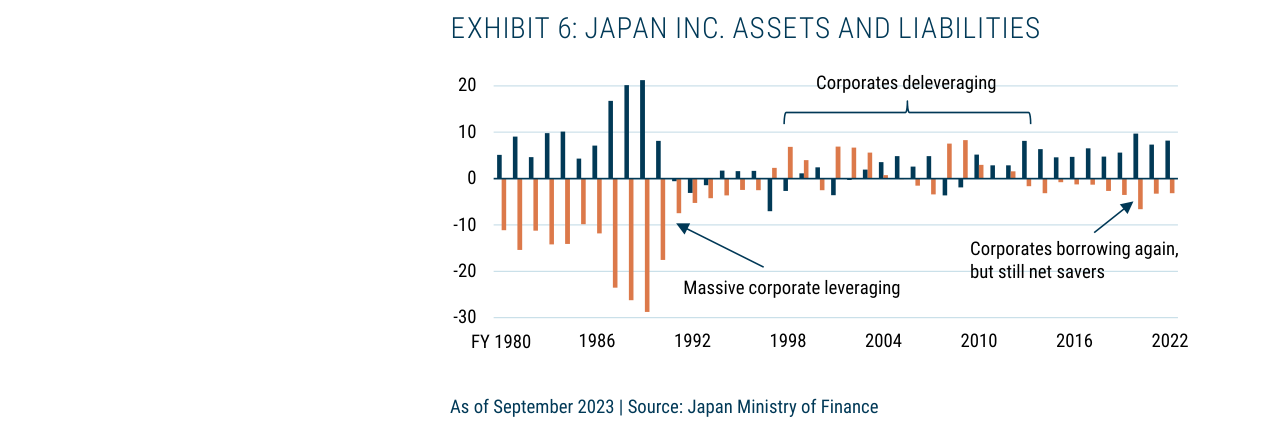
In the 1980s, companies significantly increased leverage (liabilities reached about 25% of GDP). From 1990 to 2012, they continuously deleveraged. After 2012, despite borrowing again, they remained net savers.
Comparative Data:
| Metric | 2012 (¥ Trillion) | 2022 (¥ Trillion) | Change |
|---|---|---|---|
| Total Debt | 400 | 460 | +15% |
| Net Debt | 250 | 175 | -30% |
| Cash Reserves | 150 | 285 | +90% |
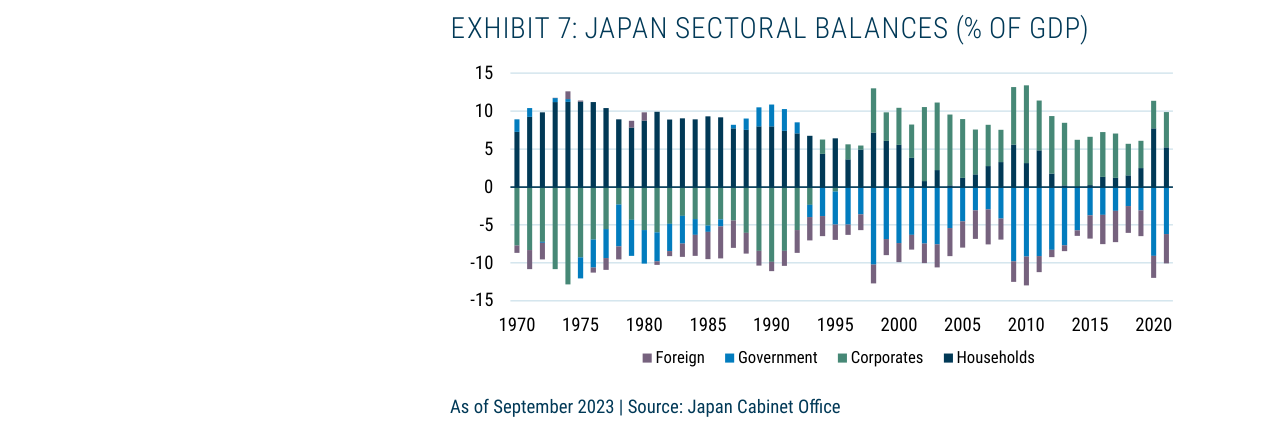
The corporate sector shifted from being a net borrower of about 10% of GDP in the 1980s to a net saver of about 5-10% of GDP after 2000, a fundamental change.
Analysis: If companies truly practiced SVM, they would use excess cash for dividends or buybacks, not hoarding. The GMO report points out that this "cash hoarding" behavior contradicts SVM logic, instead suggesting companies are still primarily defensive (e.g., coping with deflation risk or future investment uncertainty). This provides a rationale for activist investment strategies (like the GMO Usonian Japan Equity team's approach)—only through external pressure can these reserves be released.
2. Direction and Structure of Foreign Direct Investment (FDI): Japanese Companies' "De-localization" Strategy
Exhibit 10 shows that the second-largest use of Japanese corporate savings is FDI, with FDI as a percentage of GDP rising from 2% to 5% between 2012 and 2022. This trend contrasts sharply with global discussions on "friend-shoring" and "near-shoring"—Japan is instead accelerating the shift of production overseas.
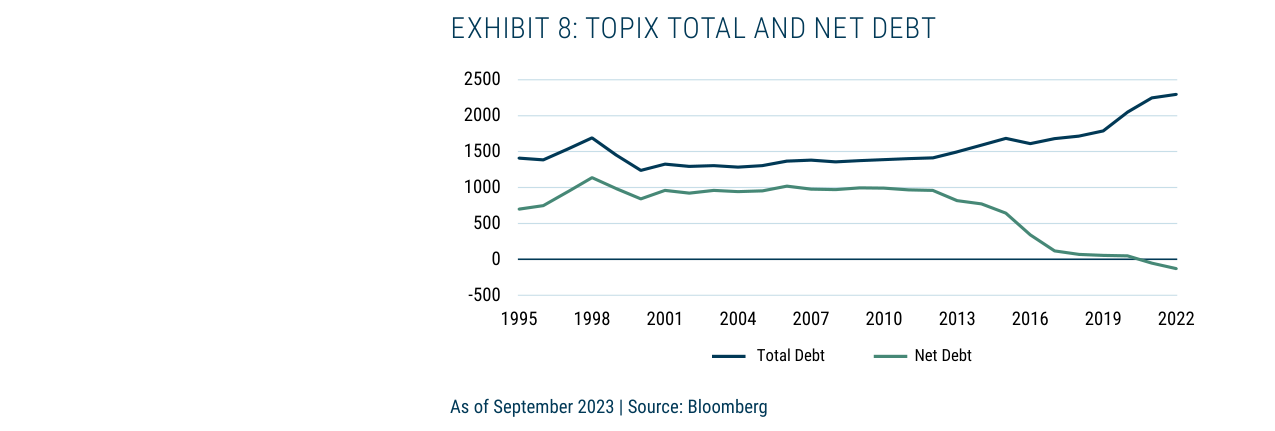
TOPIX total debt increased from about ¥1,000 billion in 2012 to about ¥2,300 billion in 2022, while net debt fell from about ¥500 billion to near zero.
Destination Distribution (Exhibit 11):
- North America (30%), Europe (28%), and Asia (27%) are almost evenly split, with South America (8%) and Oceania (7%) accounting for smaller shares.
- Key Change: Before 2012, Asia (especially China) was the largest destination (over 40%), but after 2012, the shares of North America and Europe rose significantly, reflecting Japanese companies diversifying supply chains to mitigate geopolitical risks.
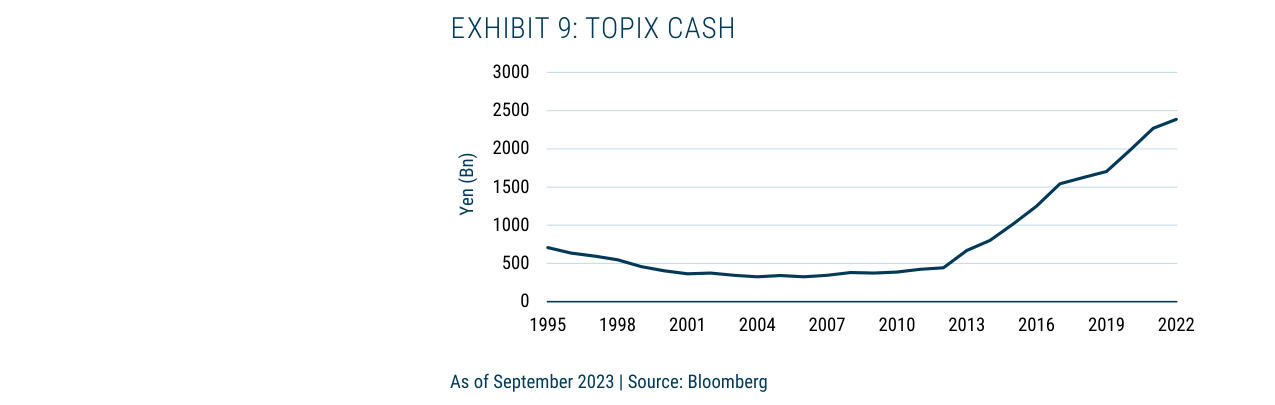
TOPIX cash holdings surged from about ¥500 billion in 2012 to about ¥2,500 billion in 2022, quadrupling in a decade.
Industry Distribution (Exhibit 12):
- Finance & Insurance (22%) and Wholesale & Retail (18%) together account for 40%, far exceeding manufacturing (e.g., Electrical Machinery at only 8%).
- Implicit Logic: Japanese companies retain profits overseas through FDI (e.g., via subsidiary reinvestment) rather than repatriating them for shareholder returns. This further weakens the SVM narrative—companies prefer "global arbitrage" over "domestic shareholder value."
3. The "Lag Effect" of Ownership Structure Changes: Why Didn't the Transformation 20 Years Ago Immediately Boost Profits?
Exhibits 13 and 14 show that the shareholding of "outsiders" (foreigners, individuals, trust banks) in the Japanese stock market rose from 30% in 1990 to 80% in 2020, while "insiders" (corporations, financial institutions) fell from 70% to 20%. However, this shift mainly occurred between 1990 and 2005, not in recent years.
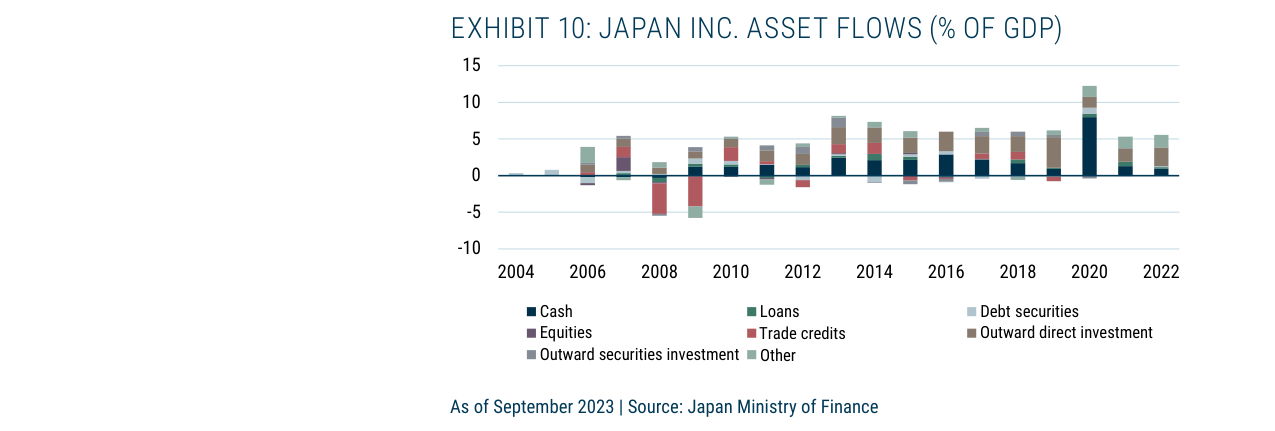
In Japanese corporate asset allocation, cash accumulation rose from about 0% of GDP in 2004 to about 5% in recent years, while outward FDI accounted for about 2-3%.
Key Question: If ownership structure changes were the driver of profit improvement, why did profits only improve after 2012? The GMO report cites research by Franks et al. (2014), noting that equity sales in the 1990s were passive actions (banks forced to sell due to the financial crisis), not proactive governance reforms. Real governance impetus began with the "Japan Stewardship Code" under Abenomics in 2013, but its effects took time to materialize.
Data Support: Exhibit 15 shows that the Bank of Japan (BoJ) holds about 5% of TOPIX market capitalization through ETFs (peak of 6% in 2020), with 99% being index-tracking ETFs. This "passive holding" has not changed corporate behavior—the BoJ, as a shareholder, does not vote or exert pressure, and may even suppress market vitality (e.g., by distorting price discovery).
4. Systematic Refutation of the SVM Narrative: From "Religious Conversion" to "Financial Inertia"

From 2012 to 2022, Japanese outward FDI destinations were relatively balanced, with Asia, North America, and Europe each accounting for about 25-30%.
The GMO report's core conclusion is that the improvement in Japanese corporate profits is not due to an SVM "awakening," but rather the financial inertia of long-term deleveraging. The specific path is:
1. Debt Reduction: Companies prioritized cash flow for debt repayment (rather than investment or dividends), causing interest expenses as a percentage of GDP to fall from 3.5% in 1990 to 0.5% in 2022.
2. Profit Release: The decline in interest expenses directly converted into net profit (Exhibit 5 shows net profit margin rising from 2% to 6%).
3. Cash Hoarding: Remaining cash flow was retained as cash or used for FDI, not for shareholder returns.
Comparative Data:

From 2012 to 2022, Finance & Insurance and Wholesale & Retail were the top two industries for Japanese outward FDI, together accounting for over 40%.
| Period | Corporate Net Savings (% of GDP) | Interest Expenses (% of GDP) | Net Profit Margin (%) |
|---|---|---|---|
| 1990-1998 (Bubble) | -6.5% | 3.5% | 2% |
| 1998-2012 (Deleveraging) | +6.5% | 1.5% | 4% |
| 2012-2022 (Recovery) | +6.5% | 0.5% | 6% |
Conclusion: Profit improvement is a "passive result" rather than "proactive reform." The GMO report advises investors to abandon the "Japan has changed" narrative and instead adopt activist strategies (e.g., demanding buybacks, dividends, or divestiture of non-core assets) to benefit from cash reserves.
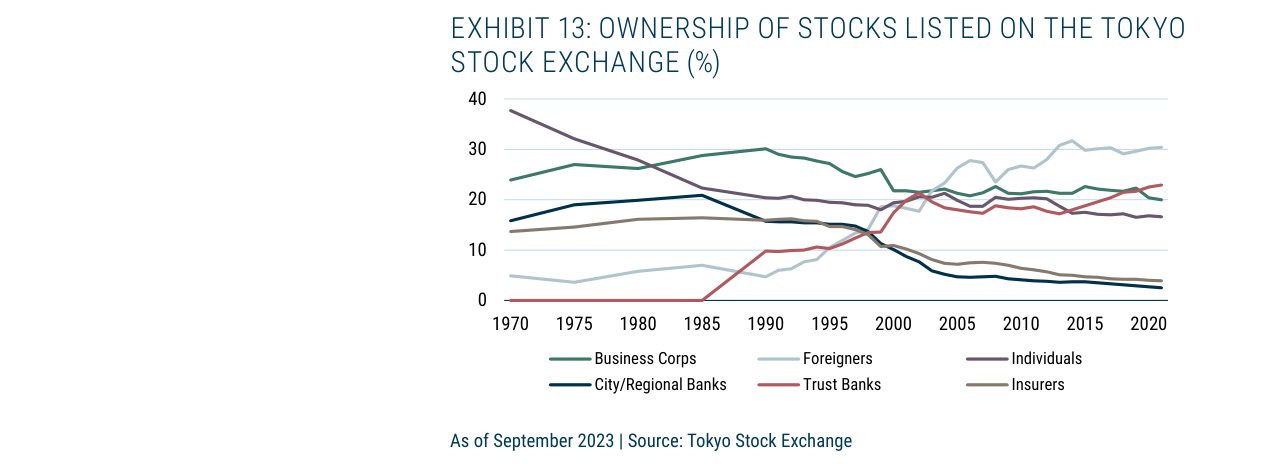
Foreign investor ownership of the Tokyo Stock Exchange rose from about 5% in 1970 to about 30% in 2020, while individual ownership fell from about 40% to about 20%.
5. Supplementary View: The "Double-Edged Sword" Effect of BoJ Holdings
Exhibit 15 shows that BoJ ownership rose from 0.5% in 2012 to 6% in 2020, but fell back to 5% in 2023. This large-scale holding may have the following effects:
- Positive: Stabilizes market sentiment and reduces volatility.
- Negative: As a "silent shareholder," the BoJ does not participate in governance, potentially delaying reforms; moreover, its ETF purchases are concentrated in the Nikkei 225 (a price-weighted index), leading to overweighting of certain stocks (e.g., Fast Retailing, in which the BoJ holds a 13% stake), distorting capital allocation.
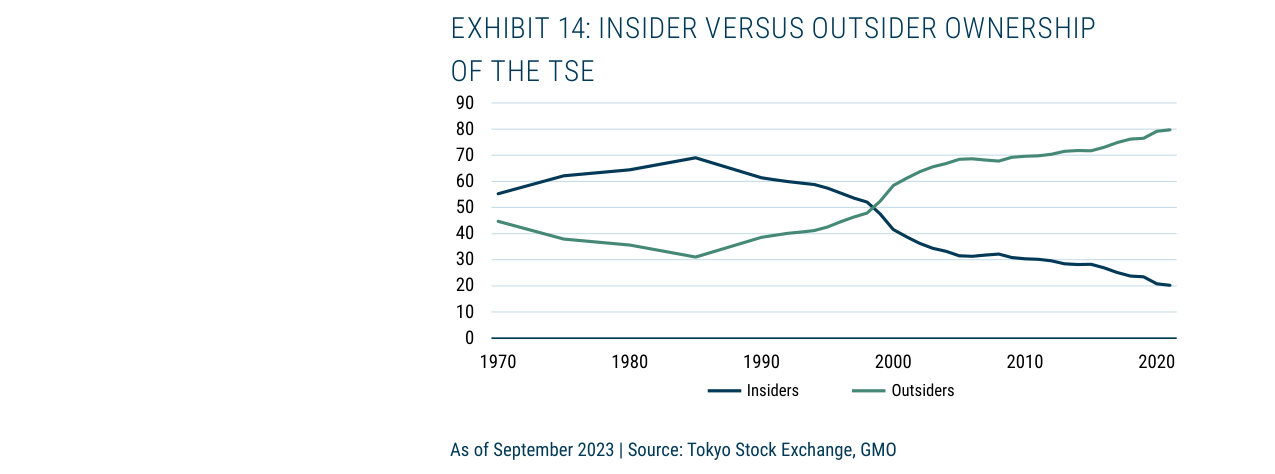
Insider ownership fell from a bubble-era peak of about 70% to about 20% in 2020, while outsider ownership rose from about 30% to about 80%.
Data Comparison: Fast Retailing has a 12% weight in the Nikkei 225 but only 0.5% in the TOPIX. Through ETFs, the BoJ indirectly holds 13% of its equity, exerting a disproportionate influence on a single company without governance participation.
Additional Analysis: The Dual Drivers of Valuation Comparison and Currency Undervaluation
1. Valuation Gap: Key Differences Between Japan and the U.S.
The follow-up strengthens Japan's market appeal through two core valuation metrics (Shiller PE and EV/EBITDA). Unlike the earlier analysis focusing on profit growth, this section highlights market pricing "mispricing":
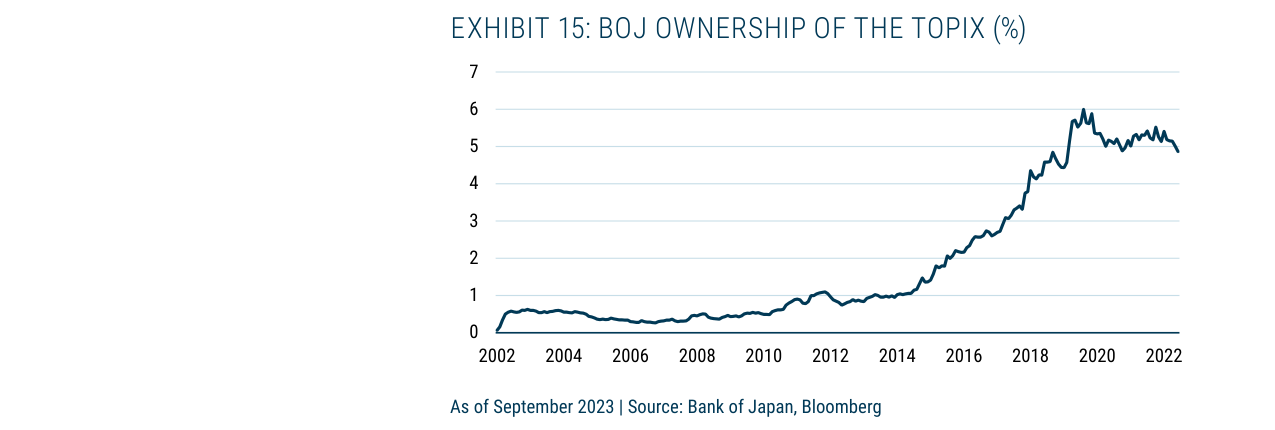
BoJ ownership of the TOPIX surged from about 1% in 2012 to a peak of about 6% in 2020, then fell back to about 5% in 2022.
- Shiller PE (Cyclically Adjusted Price-to-Earnings Ratio): As of September 2023, the U.S. Shiller PE was near 30x, already reflecting a premium for the past decade's high profit margins; Japan's was only about 18x, despite its significantly improved profitability (see earlier ROE and profit margin data). This directly refutes the assumption that "Japan's profit improvement is already priced in."
- EV/EBITDA (Enterprise Value to EBITDA): The U.S. stood at 13.5x, while Japan was only 5.25x, a gap of 2.6x. This metric strips out capital structure differences, more purely reflecting operational value, and highlights Japan's systemic undervaluation.
| Valuation Metric | U.S. (Sep 2023) | Japan (Sep 2023) | Ratio (U.S./Japan) |
|---|---|---|---|
| Shiller PE | 30x | 18x | 1.67x |
| EV/EBITDA | 13.5x | 5.25x | 2.57x |
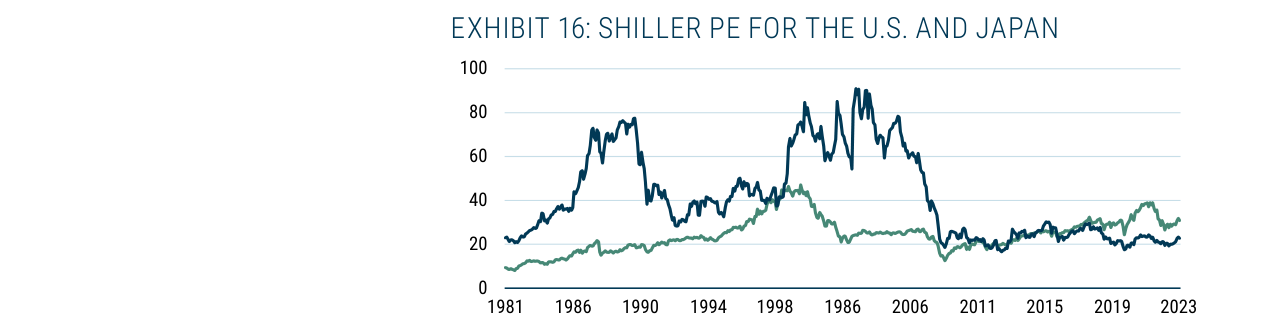
The U.S. Shiller PE is currently about 30x, while Japan's is only about 18x. Japan's valuation is significantly lower than the U.S. and at a historically low level.
Data Sources: Barclays (Shiller PE), Bloomberg (EV/EBITDA)
2. Currency Undervaluation: The Yen as an Additional Catalyst
The follow-up introduces a third key variable—the yen exchange rate. As of September 2023, the USD/JPY rate was well above its Purchasing Power Parity (PPP) estimate, indicating the yen is significantly undervalued. This phenomenon stems from interest rate differentials between Japan and the rest of the world (Japan maintains ultra-low rates, while the Fed and others have hiked aggressively).
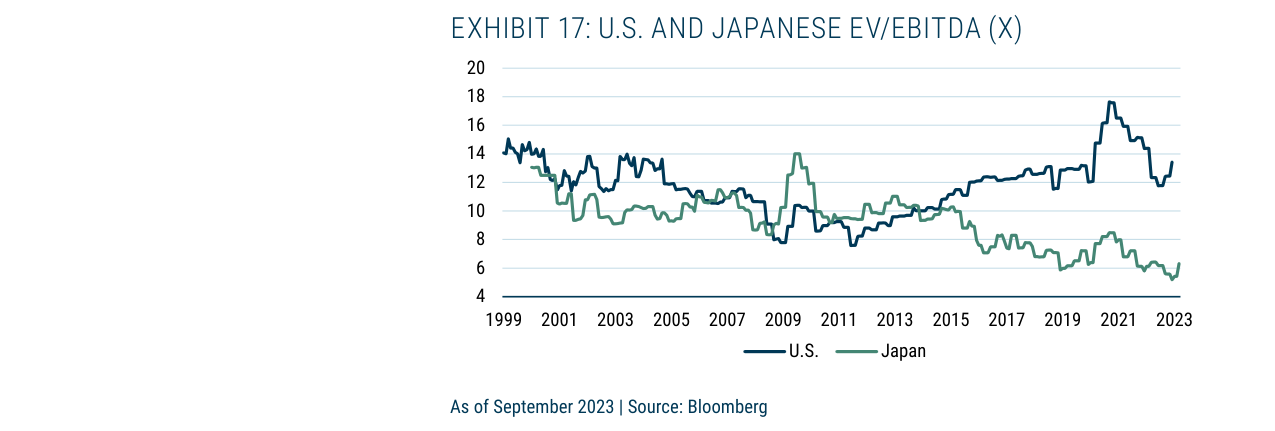
U.S. EV/EBITDA is about 13.5x, while Japan's is only about 5.25x, placing Japan's valuation at an extreme low.
- Direct Benefit for Exporters: Yen depreciation enhances the price competitiveness of Japanese exports, directly boosting profits for exporters (e.g., Toyota, Sony), further reinforcing the profit growth logic.
- Dual Benefit for Investors: If the yen remains low, export profit growth will drive stock prices higher; if the yen returns to PPP levels (i.e., appreciates), unhedged foreign investors will gain currency returns. Both scenarios are favorable, creating an "asymmetric risk-return structure."
3. Root of Profit Improvement: Deleveraging, Not Cultural Shift
The follow-up explicitly refutes the popular narrative of "Japanese companies shifting to shareholder value maximization (SVM)." The author argues that the main engine of profit improvement is long-term deleveraging: Japanese companies have been continuously repaying debt since the 1990s bubble burst, and combined with the ultra-low interest rate environment, more cash flow has been converted into net profit (rather than interest expenses). This structural factor is more quantifiable and sustainable than cultural or governance changes.
- Data Support: The earlier analysis noted that Japanese corporate net debt/EBITDA fell (from 4x in 2000 to below 1x in 2023), directly supporting this argument.
- Comparison with the U.S.: U.S. companies increased leverage during the same period (buying back stock with debt), with profit growth partly reliant on financial engineering, while Japan achieved organic improvement through "debt reduction."
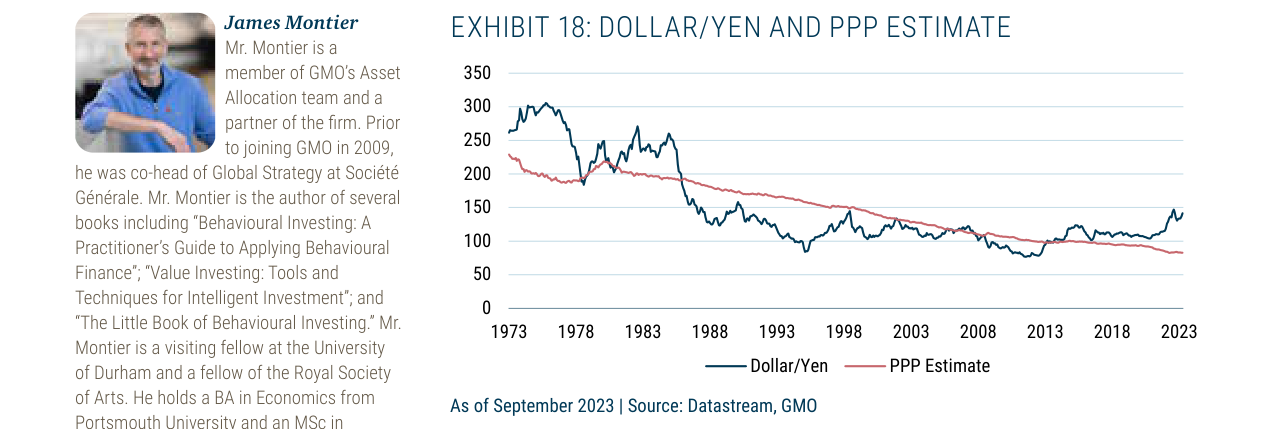
USD/JPY is currently around 150, while the PPP estimate is about 80-100, indicating the yen is significantly undervalued by about 30-40%.
4. Investment Implications: Opportunities and Risks
- Opportunity: The Japanese market has experienced a "de-rating" alongside profit improvement, creating a rare valuation trough. Combined with yen undervaluation, this may be an entry window for long-term value investors.
- Risk: Attention must be paid to potential BoJ policy shifts (e.g., rate hikes) that could impact the deleveraging process; additionally, a global recession could weaken export demand, offsetting the currency advantage.
Conclusion: The follow-up builds a more complete "Japan bull market" logic than the earlier analysis through valuation comparison, currency analysis, and exploration of profit roots—not just profit growth, but a combination of market pricing errors and currency undervaluation.