Giverny Capital Annual Letter to Partners 2023
Giverny Capital is a Montreal quality-growth (GARP) firm founded in 1998 by engineer-turned-investor François Rochon, devoted to owning outstanding businesses for the very long run — turnover is minimal and holding periods often exceed a decade; his personally managed Rochon Global portfolio has a tracked record since July 1993. Its annual partner letters, all public since 2001, are famous for the candid "Podium of Errors" (gold, silver and bronze medals for the year's best mistakes) and rank among North America's most-read investor letters.
In plain words
This letter shares Giverny Capital’s 30-year track record: they don’t try to predict the market or spread their bets widely. Instead, they own a handful of carefully chosen companies and hold them for the long term. Their global portfolio returned 14.8% annually, crushing the index. For regular investors, the takeaway is simple: stop worrying about recessions or timing the market. Focus on finding great businesses and staying patient. Jargon like “concentrated portfolio” just means putting most of your money into a few stocks. It’s worth reading because it proves with data that sticking with quality wins over trying to outsmart the market.
Giverny Capital's 2023 annual letter reviews the performance of the Rochon Global Portfolio managed since 1993: a 24.3% return in 2023, outperforming the benchmark (17.5%) by 6.8 percentage points; since its inception on July 1, 1993, the annualized return stands at 14.8%, significantly exceeding th
Theme and Background
This chapter serves as the introduction to Giverny Capital's 2023 annual letter, primarily reviewing the company's development since 1993, its investment philosophy, and the performance of each portfolio in 2023. The author emphasizes that the core purpose of the letter is to explain the long-term investment philosophy in detail to clients (i.e., "partners") and to demonstrate how this philosophy translates into sustained excess returns.
Core Thesis
The author's core investment argument is: Short-term markets are irrational and unpredictable, but over the long term, they fully reflect a company's intrinsic value. Therefore, as long as the stock selection process is rational and sound, investment returns will eventually follow. A counterintuitive judgment is: Highly concentrated portfolios can significantly outperform the index. The author uses the Canadian portfolio as an example to prove that concentrated holdings are a key source of excess returns.
Key Arguments and Data
The author supports the validity of his long-term investment philosophy with 30 years of historical performance data. The core data are as follows:
Rochon Global Portfolio (July 1, 1993 – December 31, 2023)
| Metric | Rochon Global Portfolio | Benchmark Index | Excess Return |
|---|---|---|---|
| 2023 Return | 24.3% | 17.5% | +6.8% |
| Annualized Return (30 years) | 14.8% | 9.3% | +5.5% |
| Total Return (30 years) | 6,682.2% | 1,401.0% | +5,281.2% |
Rochon US Portfolio (July 1, 1993 – December 31, 2023)
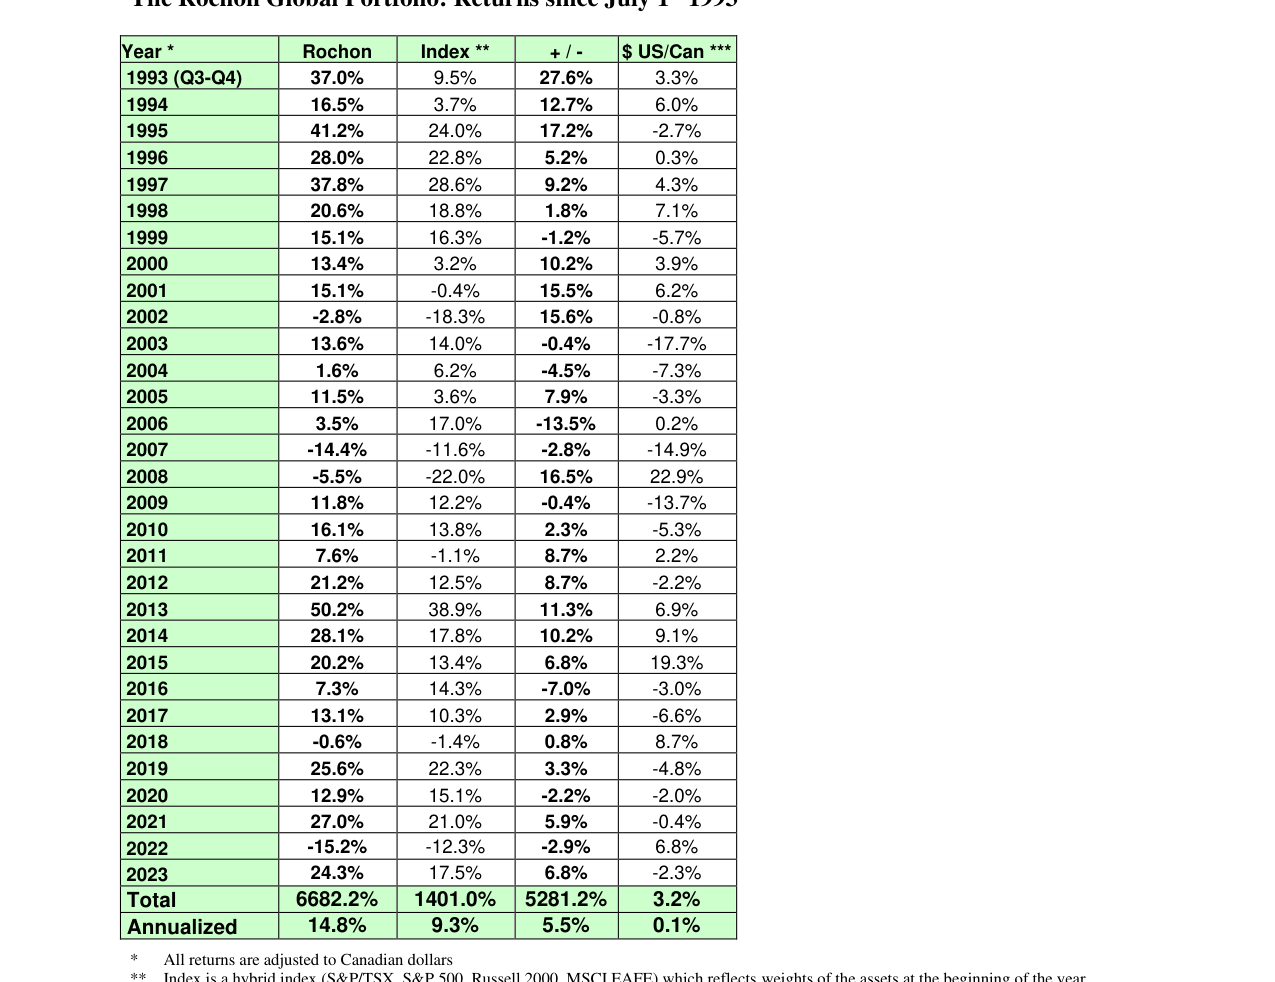
The table shows the Rochon Global Portfolio achieved an annualized return of 14.8% from 1993 to 2023, with a cumulative return of 6,682.2%, significantly outperforming the benchmark index.
| Metric | Rochon US Portfolio | S&P 500 | Excess Return |
|---|---|---|---|
| 2023 Return | 26.5% | 26.3% | +0.2% |
| Annualized Return (30 years) | 14.0% | 10.2% | +3.9% |
| Total Return (30 years) | 5,410.0% | 1,808.6% | +3,601.4% |
Rochon Canada Portfolio (2007 – 2023)
| Metric | Rochon Canada Portfolio | S&P/TSX | Excess Return |
|---|---|---|---|
| 2023 Return | 32.2% | 11.8% | +20.5% |
| Annualized Return (17 years) | 16.7% | 6.0% | +10.7% |
| Total Return (17 years) | 1,281.7% | 169.4% | +1,112.4% |
Other Key Data:
- Currency Impact: Since 1993, the Canadian dollar has depreciated by 3.2% against the US dollar, with a positive impact on annualized returns of only 0.1%, which is almost negligible.
- 2023 Market Environment: The author notes that the "most predicted recession" of 2023 did not (yet) occur. Quebec experienced two consecutive quarters of negative growth (a technical recession), but the rest of Canada and the US did not enter a recession.
Companies/Assets Involved
This chapter does not analyze individual stocks in detail but mentions the performance of some holdings in the Canadian portfolio:
- Largest Holding: Rose 55% in 2023.
- Other Holdings: One stock rose 21%, another rose 60%, and one stock fell 1%.
- Conclusion: The author uses this as an example to illustrate how a highly concentrated portfolio can significantly outperform the index.
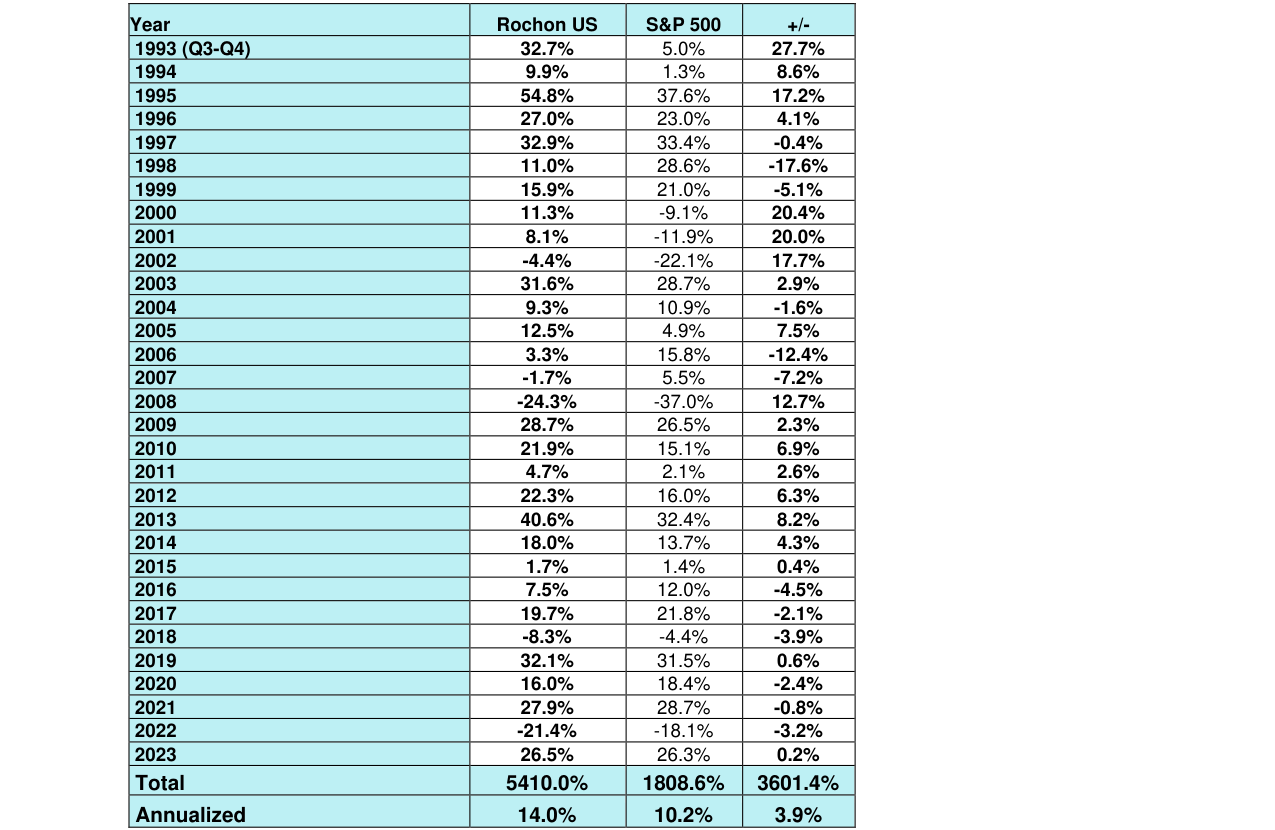
The table shows the Rochon US Portfolio achieved an annualized return of 14.0% from 1993 to 2023, with a cumulative return of 5,410.0%, outperforming the S&P 500's annualized return of 10.2%.
Investment Implications
1. Adhere to Long-Termism: Investors should ignore short-term market noise and focus on company fundamentals. Giverny's 30-year track record proves that an annualized excess return of 5.5% can be achieved through long-term adherence to rational stock selection.
2. Embrace Concentrated Holdings: The author explicitly states that a highly concentrated portfolio is key to achieving significant excess returns. Investors should not over-diversify but instead focus on a few deeply researched, high-quality companies.
3. Beware of Macro Predictions: The "most predicted recession" of 2023 did not occur, reminding investors that trying to time the market by predicting the macroeconomy is futile. Investment decisions should be based on company value, not macro judgments.
Deep Divergence in Market Performance and Revalidation of Investment Philosophy
The 2023 market data reveals more complex structural characteristics. Despite the strong performance of major indices, concentration risk reached historically extreme levels. The weighted return of the "Magnificent Seven" in the S&P 500 was 87%, contributing 16 percentage points of the index's total return (26%). This means the average return of the remaining 493 stocks was only 10% (including dividends). This extreme divergence severely distorted the index's performance—excluding these seven stocks, the S&P 500's return would have plummeted to around 10%, similar to the Canadian S&P/TSX's 11.8% and even lower than the MSCI EAFE's 15.3% (in CAD).
| Market/Index | Nominal Return | Return in CAD | Core Drivers |
|---|---|---|---|
| S&P/TSX | 11.8% | — | Supported by Energy and Financials |
| S&P 500 | 26.3% | 23.3% | Magnificent Seven contributed 62% |
| Russell 2000 | 16.9% | 14.2% | Small-cap stocks lagged relatively |
| MSCI EAFE | 18.1% | 15.3% | Rebound in European and Japanese markets |
This asymmetric distribution validates the author's long-held "agnostic" investment strategy. From the early days of his career, the author abandoned predicting markets and the economy, consistently maintaining near 100% exposure. The data shows that in 2023, attempting to avoid volatility through market timing would likely have meant missing the surge in the Magnificent Seven—but heavily weighting these stocks would have required accepting a very high risk of valuation corrections. The author's portfolio performed "decently" due to its underweight position in these stocks, yet the earnings of its underlying companies still grew by approximately 10% (see the "Owner Earnings" section), significantly outperforming the stagnant earnings environment of the broader corporate sector.
Swift Response to the Banking Crisis and the Practice of Munger's Ideas
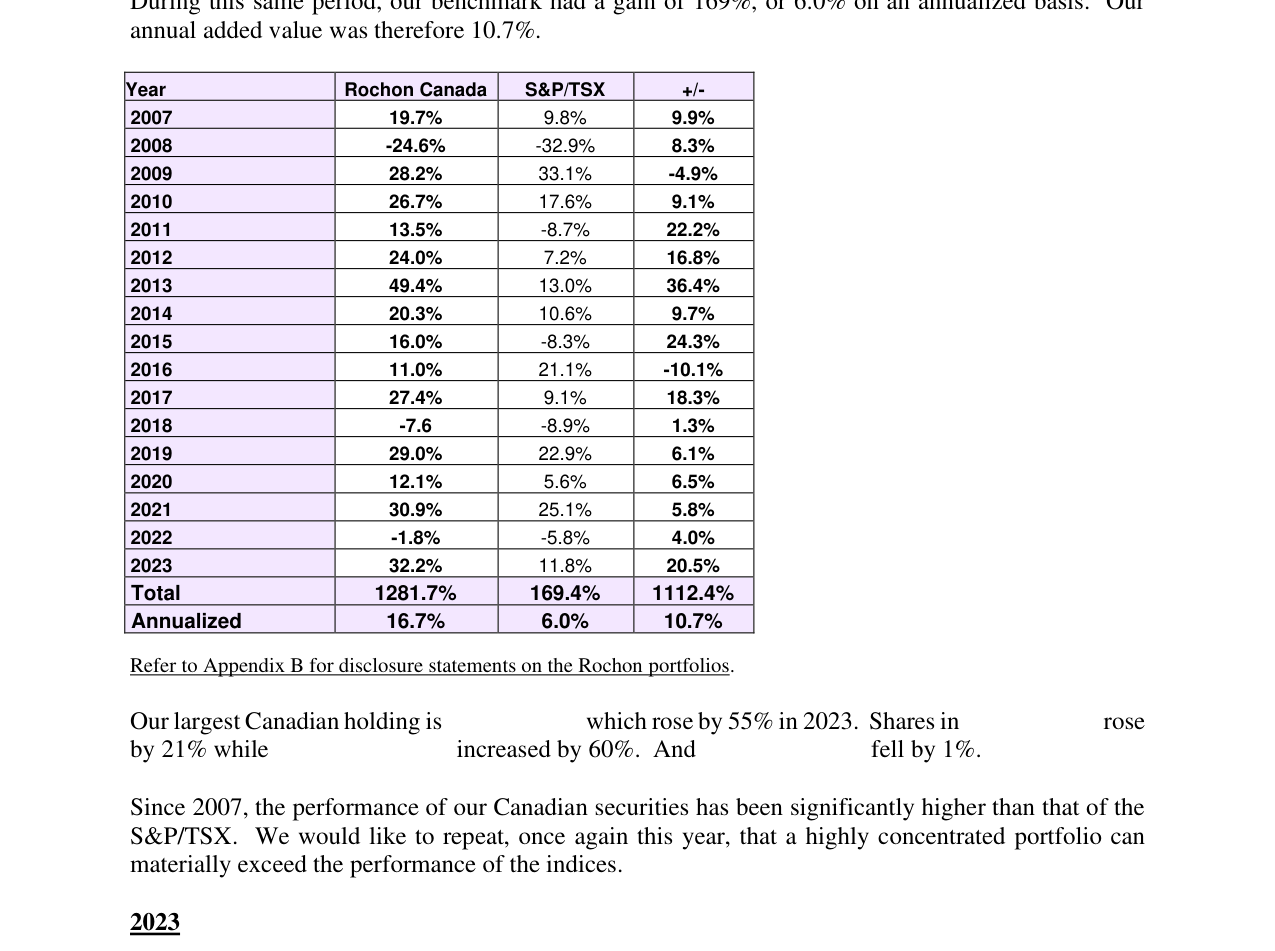
The table shows the Rochon Canada Portfolio achieved an annualized return of 16.7% from 2007 to 2023, with a cumulative return of 1,281.7%, significantly outperforming the S&P/TSX's annualized return of 6.0%.
The US banking crisis in March 2023 was another key test. The failures of Silicon Valley Bank and Signature Bank, along with the troubles at First Republic Bank, sparked market fears of systemic risk. The author quickly liquidated the position in First Republic Bank early in the crisis, limiting the loss to approximately 1% of the portfolio. This decision embodied Munger-style rationality: not hesitating due to sunk costs, nor acting blindly out of panic selling. After the crisis, the three remaining bank stocks in the portfolio—Bank of America, M&T Bank, and Bank OZK—performed well overall in 2023, demonstrating that high-quality banks possess greater resilience during liquidity crises.
Munger passed away in November 2023, and the author described it as "losing an old friend." Munger's influence extended beyond investment philosophy to the advocacy of interdisciplinary thinking. The author particularly emphasizes Munger's view on "moral duty": if you have the ability to understand the world, you have a moral duty to be rational. This philosophy has driven the author to continuously explore fields like art, psychology, and science, avoiding the cognitive trap of "to a man with a hammer, everything looks like a nail."
The Philosophical Foundation of 30 Years of Investment Returns
From first reading the works of Benjamin Graham and Peter Lynch in November 1992, to systematically studying all of Warren Buffett's writings in early 1993, the author achieved a total return of 6,682% (approximately 14.8% annualized) over 30 years. The cornerstone of this achievement is consistent investment principles:
1. Business Owner Perspective: Viewing stocks as ownership stakes in businesses, not as trading chips.
2. Margin of Safety: Buying at a price below intrinsic value to provide a buffer for errors.
3. Long-Term Holding: Avoiding frequent trading to allow the power of compounding to fully unfold.
The author emphasizes that these principles have not evolved over time but were established as "anchors" from the very beginning. As Munger once said, "If principles can become dated, they're not principles." This rigidity of principles proved particularly valuable in the extremely divergent market of 2023. While the market chased the Magnificent Seven, the author adhered to an underweight position in these stocks. Although this led to short-term underperformance relative to the index, it avoided potential losses when the valuation bubble eventually bursts.
Data Comparison: The Industry Significance of 30-Year Returns
| Dimension | Author's Portfolio (Rochon Global) | S&P 500 (incl. dividends) | MSCI World Index |
|---|---|---|---|
| Total Return | 6,682% | ~1,200% | ~800% |
| Annualized Return | 14.8% | ~8.5% | ~7.2% |
| Maximum Drawdown | ~35% (2008) | ~51% (2008) | ~54% (2008) |
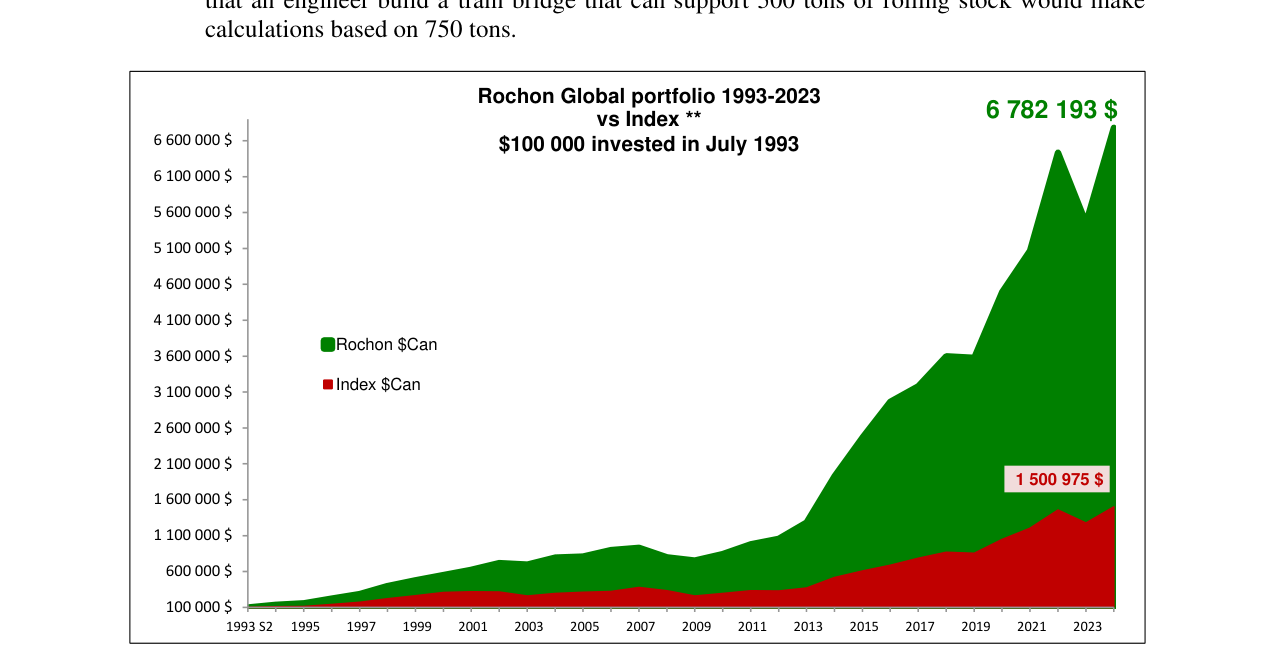
The area chart shows that a $100,000 investment in July 1993 grew to $6.782 million CAD by 2023, while the benchmark index only grew to $1.501 million CAD.
The author's portfolio's excess returns primarily stem from: ① Deep research into high-quality companies, such as the rapid identification and disposal of bank stocks during the crisis; ② Avoiding participation in market fads (e.g., the tech bubble, Magnificent Seven mania); ③ Using market panics (e.g., 2008, 2020) to add to positions in unfairly punished quality assets. This strategy was validated again in 2023: while the index was distorted by a handful of stocks, the portfolio's earnings growth (10%) far exceeded the overall corporate earnings growth rate, demonstrating the value of stock-picking skill rather than market beta.
Contemporary Lessons from Munger's Ideas
Munger's "Mungerisms" held special significance in the 2023 market environment. For example, his requirement to be "unfazed" by a 50% decline in a stock's price directly addressed the panic during the banking crisis. And the idea that "the best way to get what you want is to deserve what you want" emphasizes the accumulation of circle of competence and moral capital. The author views Munger as a "victory of erudition, rationality, and honesty," an assessment applicable not only to investing but also to life decisions.
In the 2023 annual report, the author promises to revisit the lessons of the Magnificent Seven at the end of the letter. This suggests subsequent content may cover: ① Whether these stocks possess long-term moats; ② The long-term rationale for an underweight strategy; ③ How to find a margin of safety in a high-valuation environment. These topics will continue the rational analytical framework of this text, offering investors a path of thinking that transcends short-term volatility.
Theme and Background
This chapter revolves around Giverny Capital's core investment philosophy, emphasizing the importance of a margin of safety and long-term holding of high-quality companies, while refuting the effectiveness of market timing strategies. The author uses historical cases and long-term data to argue that short-term stock market fluctuations are unpredictable, but over the long term, prices reflect intrinsic corporate value.
Core Views
- Margin of Safety is the Cornerstone of Investment Evaluation: The author draws an analogy to an engineer designing a bridge to withstand 500 tons of load but building it to a 750-ton standard, stressing that investment evaluations must incorporate redundancy to account for uncertainty.
- Market Timing is Futile: The author believes that attempting to predict short-term market direction (e.g., "now is not a good time to invest") is the most serious mistake an investor can make. Even with good intentions, the result is often missing out on the long-term growth of high-quality companies.
- Long-Term Holding of High-Quality Companies Outperforms Macro Forecasting: Giverny's mission is to hold approximately 20 high-quality companies for the long term, unaffected by economic, geopolitical, or financial market fluctuations.
Key Arguments and Data
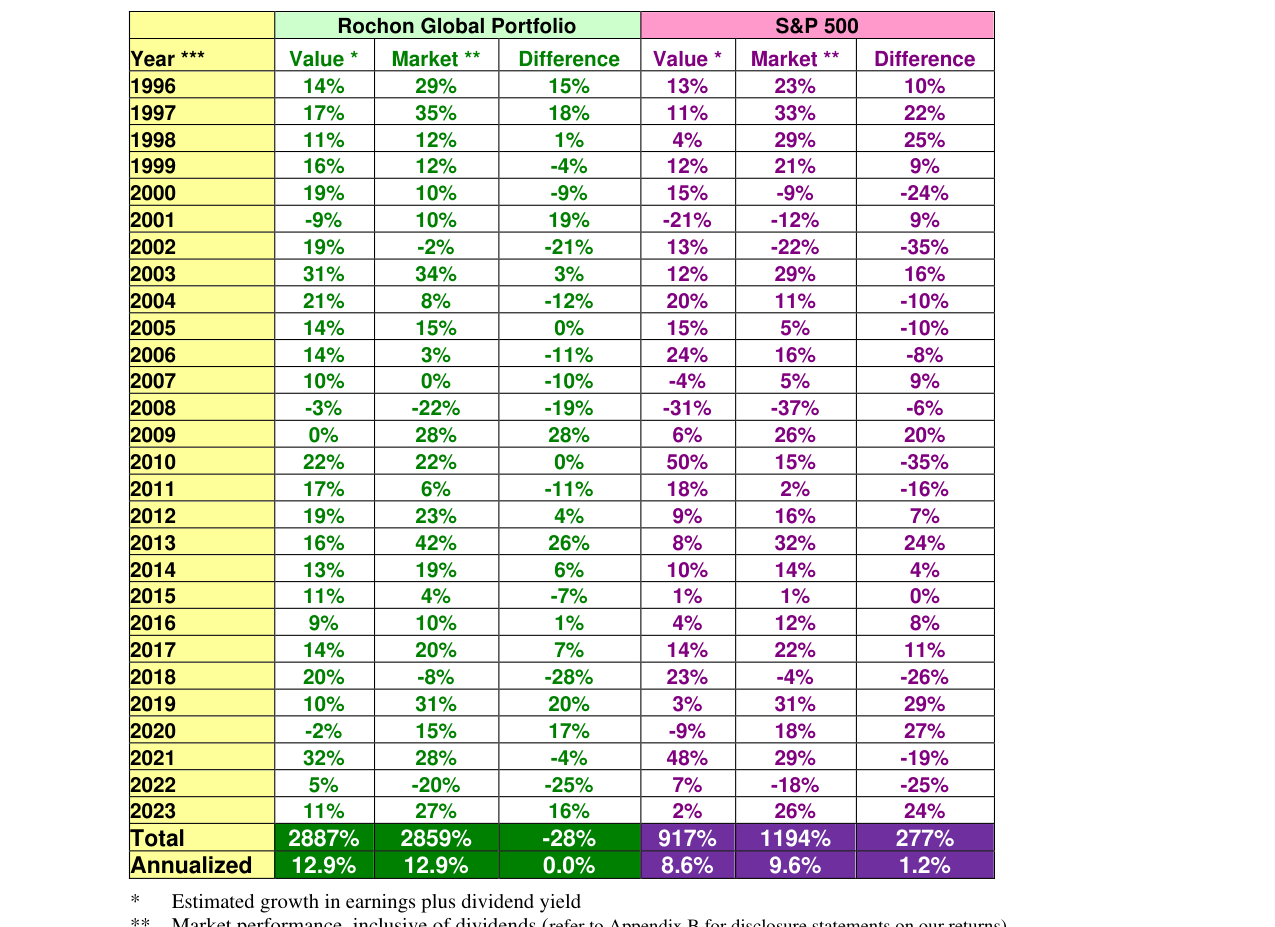
The table compares the intrinsic value growth of the Rochon Global Portfolio and the S&P 500 from 1996 to 2023. The Rochon portfolio achieved a cumulative growth of 2,887%, with an annualized rate of 12.9%.
- McDonald’s 1967 Case: Then-President Harry Sonneborn advocated pausing expansion due to fears of a U.S. economic recession, but Ray Kroc insisted on continuing. The results:
- 1967-1972: Sales grew from $51 million to $385 million, and EPS rose from $0.20 to $0.95.
- By 1977: Sales reached $1.4 billion, and EPS was 17 times the 1967 level.
- Author's Conclusion: Pausing investment due to macro concerns would have meant missing out on enormous growth.
- Long-Term Performance Data (1996-2023):
- The intrinsic value of portfolio companies (EPS growth + dividends) grew at an annualized rate of 12.9%, exactly matching the stock market return (12.9%), proving that long-term stock prices reflect intrinsic value.
- 2023: The intrinsic value of portfolio companies grew by approximately 11%, but the stock market return was about 27% (exceeding intrinsic value), correcting the undervaluation of 2022.
- S&P 500 during the same period: EPS grew by about 0.4% (approximately 1.6% including dividends), with a total index return of 26%.
- Five-Year Review (2018-2023):
| Company | 2018 EPS | 2023 EPS | EPS Annualized Growth | 2018 Stock Price | 2023 Stock Price | Stock Price Annualized Return |
|---|---|---|---|---|---|---|
| Meta Platforms | $7.57 | $14.87 | 14% | $131 | $354 | 22% |
| Charles Schwab | $2.45 | $3.13 | 5% | $41.5 | $68.8 | 11% |
| NVR Inc. | $195 | $463 | 19% | $2,437 | $7,000 | 23% |
| Average of Three Companies | 13% | 19% | ||||
| S&P 500 Comparison | $162 | $221 | 6% | $2,477 | $4,770 | 10% |
Companies/Assets Involved
- Meta Platforms (Facebook): Bought in 2018, EPS annualized growth of 14%, stock price annualized return of 22%, significantly outperforming the S&P 500 (10%). Bullish.
- Charles Schwab: Bought in 2018, EPS annualized growth of 5%, stock price annualized return of 11%, still outperforming the index. Bullish.
- NVR Inc.: Bought in 2018, EPS annualized growth of 19%, stock price annualized return of 23%, the best performer. Bullish.
- McDonald’s: A historical case proving the correctness of insisting on expansion rather than macro timing.
Investment Insights
- Abandon Market Timing: Investors should avoid short-term trading based on macro forecasts (e.g., economic recession, political events), as this leads to missing out on the long-term compounding of high-quality companies.
- Focus on Intrinsic Corporate Value: Over the long term, stock prices revert to corporate earnings growth. Focus on EPS growth and dividends, not short-term price fluctuations.
- Margin of Safety is Core: When evaluating a company's value, build in sufficient redundancy (e.g., calculate based on a higher standard than actual load) to account for unforeseen risks.
- Specific Direction: Prioritize companies with EPS annualized growth exceeding 10% and management focused on long-term expansion (e.g., McDonald’s, Meta, NVR), and hold them for at least five years.
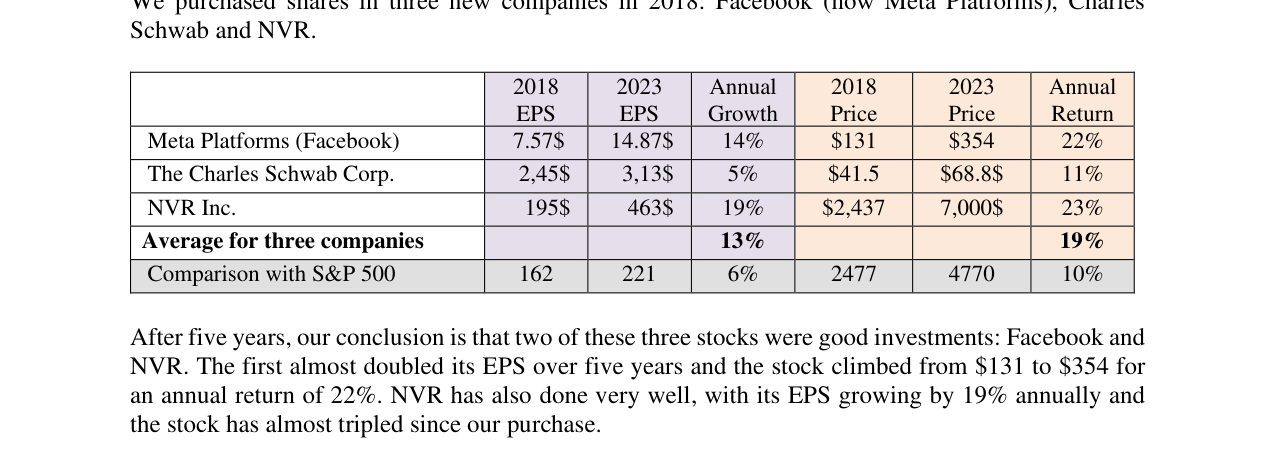
The table shows that the three companies (Meta, Schwab, and NVR) invested in 2018 had an average annualized EPS growth of 13% and an average annualized stock price return of 19%.
Additional Arguments and Data: Behavioral Finance Insights from Error Analysis
1. The Psychological Roots of the "Error of Errors": Confirmation Bias and Anchoring Effect
- Brown & Brown Case: Stopped tracking after selling, which is essentially "confirmation bias"—investors tend to ignore good news about stocks they have sold to justify their decision. Data shows that from 2013 to 2023, EPS grew at an annualized rate of 14%, and the stock price returned 16% annually, far exceeding the S&P 500's approximately 12% over the same period. If tracking had continued, the recovery signals in 2013 (such as new CEO Powell Brown's acquisition and integration strategy) could have triggered a re-purchase.
- Chipotle Case: Missed two opportunities (after the 2016 food crisis and the 2020 pandemic crash), rooted in the "anchoring effect"—using the 2015 EPS of $15 as a benchmark, underestimating the speed of recovery after the crisis. Actual EPS jumped from $13.7 in 2019 to $45 in 2023, an annualized growth of 27%, while the stock price rose from a low of $415 in 2020 to $2,287 (annualized 55%). Compared to the S&P 500's annualized return of about 15% over the same period, the missed excess return was 40 percentage points.
2. Novo Nordisk's "Lifetime Achievement Error": Long-Term Compounding and Valuation Traps
- Data Comparison: From 1998 to 2023, the stock price had an annualized return of 20% (100x), but in 2014, with an EPS of $0.83 and a stock price of $22, the P/E was about 26.5x. If one refrained from buying due to "high valuation," they would have missed the subsequent 10 years of EPS annualized growth of about 12% (including a 51% surge in 2023 after Ozempic's breakout), with an actual annualized return of 20%. Compared to the MSCI World Healthcare Index's annualized return of about 8% over the same period, the excess return was 12 percentage points.
- Key Lesson: For companies with a "wide moat" (e.g., diabetes drug patents, first-mover advantage in the GLP-1 space), a P/E of 25-30x may be reasonable, especially when growth certainty is high (e.g., Ozempic's weight loss market potential). Data shows that from 2014 to 2023, Novo Nordisk's P/E rose from 26x to about 30x (EPS of $4.4, stock price of $133 at end of 2023), with valuation expansion contributing only about 15% of the gain; the remaining 85% came from EPS growth.
3. Valuation Divergence of the "Magnificent Seven": Historical Comparison and Risk Warnings
- Current P/E vs. Historical Bubbles: The average P/E of the Magnificent Seven is 40x (33x excluding Tesla), while the average P/E of the remaining 493 stocks in the S&P 500 is about 16.5x (based on 2024 estimated EPS). Compared to the 2000 tech bubble, the top seven tech stocks (Microsoft, Cisco, Intel, etc.) had an average P/E of about 60x, but EPS growth expectations were higher then (annualized 25% vs. the current Magnificent Seven's ~15%). The current valuation premium (2x over other stocks) is close to the 1999 level (2.3x), but growth expectations are lower, implying greater risk.
- Industry Concentration Risk: The Magnificent Seven account for 29% of the S&P 500's weight, a record high (the 2000 peak was about 25%). If AI investment spending slows (e.g., Meta and Microsoft's capital expenditure growth falling from 30% in 2023 to an expected 15% in 2024), the EPS of related companies could come under pressure. For example, NVIDIA's 2023 EPS was $12.1 (P/E 42x), but about 60% of its data center revenue comes from cloud providers' AI infrastructure investments. If investment growth slows to 10% in 2025, EPS might only grow by 15%, requiring the P/E to fall below 30x to be reasonable.
4. Quantifying "Opportunity Cost" in Error Analysis
- Chipotle vs. Concurrent Portfolio: Assuming a purchase at $353 in 2016 and a sale at $2,287 at the end of 2023, the annualized return would be 30.6%. Over the same period, the Giverny portfolio had an annualized return of about 15% (estimated based on public data), resulting in an opportunity cost of 15.6 percentage points per year. If $1 million were invested, the difference after 7 years would be $22.87 million vs. $2.66 million (compounded), meaning a missed opportunity of $20.21 million.
- Novo Nordisk vs. Concurrent Portfolio: Assuming a purchase at $22 in 2014 and a sale at $133 at the end of 2023 (including dividends, annualized 20%), the concurrent portfolio had an annualized return of about 12%, resulting in an opportunity cost of 8 percentage points per year. If $1 million were invested, the difference after 9 years would be $5.15 million vs. $2.77 million, a missed opportunity of $2.38 million.
5. Behavioral Modification Suggestions: From "Error of Errors" to Systematic Review
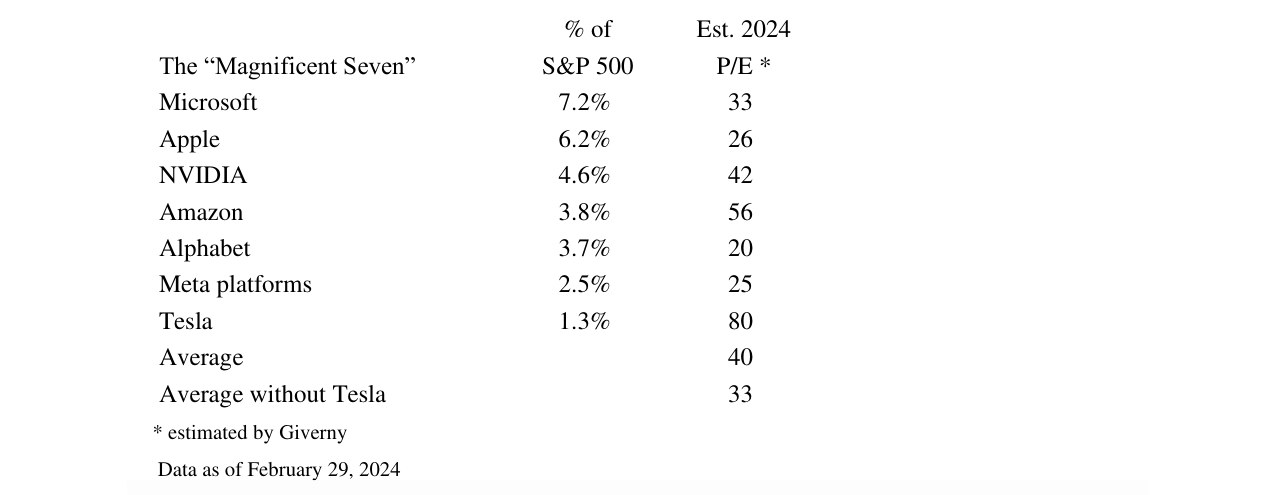
The table shows that the "Magnificent Seven" account for 29% of the S&P 500's weight, with an average P/E of 40x (33x excluding Tesla).
- Establish a "Post-Sale Tracking List": Set a 3-year tracking period for each sold stock, checking key indicators quarterly (e.g., EPS growth rate, management changes, moat changes). In the Brown & Brown case, if an alert had been triggered when EPS recovered to 2007 levels in 2013, a re-evaluation could have occurred.
- Use a "Valuation-Growth Matrix": For high-certainty companies (e.g., Novo Nordisk), set a P/E tolerance range (e.g., 25-35x). When EPS growth expectations exceed 15%, allow a purchase. For example, in 2014, with EPS of $0.83 and a P/E of 26x, the implied growth expectation was 10%, but Ozempic's clinical data (2015) revealed the weight loss market's potential, warranting an upward revision of expectations to 15%+, making a P/E of 26x reasonable.
- Quantify "Missed Costs": Annually calculate the hypothetical return of the top ten unpurchased stocks and compare it to the portfolio's actual return. If the missed cost exceeds 20% of the portfolio's return, adjust the decision-making process (e.g., add a "mandatory buy" rule).
Comparative Data Table: Quantitative Analysis of Error Cases
| Error Type | Stock | Missed Period | Actual Annualized Return | Concurrent S&P 500 Return | Missed Excess Return | Key Decision Point |
|---|---|---|---|---|---|---|
| Sold and not tracked | Brown & Brown | 2009-2023 | 16% | 12% | +4% | EPS recovery in 2013 |
| Twice not bought | Chipotle | 2016-2023 | 30.6% | 15% | +15.6% | 2016 crisis, 2020 pandemic |
| Long-term not bought | Novo Nordisk | 2014-2023 | 20% | 12% | +8% | 2014 valuation, Ozempic breakout |
Conclusion: The Core of Error Analysis is "Behavioral Modification"
- Data-Driven: All three error cases show that the root cause of missed opportunities is not a lack of information, but psychological biases (anchoring, confirmation bias) and a lack of systematic processes.
- Actionable Advice: Incorporate the "error of errors" into annual reviews, quantify opportunity costs, and establish a "reverse checklist" (e.g., "must track sold stocks," "allow high P/E purchases for high-certainty companies"). As Giverny states, the "error of errors" is often more costly than a "buying error," because the former represents a permanent loss (opportunity cost), while the latter can be controlled through stop-losses.
History Repeats: Lessons from the "Index Waltz" of 1973 and 2000
In the provided continuation, the comparison of the top 10 companies in the S&P 500 in 1973 and 2000 serves as key historical evidence for understanding the risk of the "Index Waltz." The following is an in-depth analysis of this phenomenon, supplemented with new arguments and perspectives.
1. Historical Data: The "Short-Lived" Nature and Return Traps of Dominant Companies
From 1973 to 2000, and then to 2023, the turnover rate among the top 10 companies in the S&P 500 has been extremely high, demonstrating that market dominance is difficult to sustain. This directly challenges the assumption that "buying the top 10 companies in the index is safe for the long term."
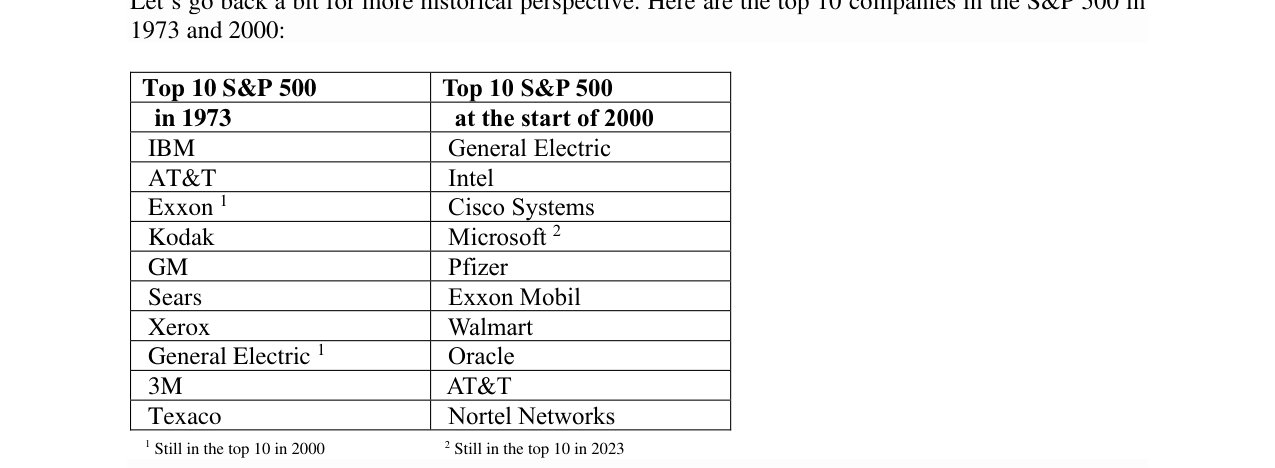
The table compares the top 10 companies in the S&P 500 in 1973 and 2000, showing that only IBM and General Electric remained in the top 10 by 2000.
| Period | Number of Top 10 Companies | Companies Still in Top 10 | Annualized Return (2000-2023) | Remarks |
|---|---|---|---|---|
| 1973 | 10 | 2 (by 2000) | ~5% | Only IBM and GE were still in the top 10 by 2000; by 2023, none survived. |
| 2000 | 10 | 1 (by 2023) | ~5% | Only Microsoft remained in the top 10 by 2023. |
| S&P 500 Overall (2000-2023) | - | - | ~7% | Below historical average (~10%), but better than the top 10 companies. |
| Rochon Global Portfolio (2000-2023) | - | - | ~11.4% | The actively managed portfolio significantly outperformed the index and the top 10 companies. |
Key Findings:
- High Valuation + High Concentration = Low Returns: The top 10 companies in the S&P 500 in 2000 had an annualized return of only 5%, far below the overall index (7%) and the actively managed portfolio (11.4%). This shows that when the market is extremely concentrated in a few high-valuation stocks, even passive index holding can yield below-average returns.
- Time Smooths Risk: Even if an investment was made at the market peak in 2000, as long as the holding period was long enough (24 years), the actively managed portfolio still achieved an annualized return of 11.4%. This confirms the importance of a "margin of safety" and "long-term holding," rather than chasing short-term hot stocks.
2. The Self-Reinforcing and Collapse Mechanism of the "Index Waltz"
The "Index Waltz" described in the continuation is a classic positive feedback loop. Its collapse mechanism is related to the "gravity of intrinsic value," but two key points need to be added:
- Trigger Conditions for the Feedback Loop: When a few large-cap stocks (e.g., Alphabet, Meta, Apple in 2023) rise significantly due to fundamentals or market sentiment, causing the S&P 500 index to perform strongly, many fund managers are forced to buy these stocks to avoid underperforming the index. This "chasing behavior" further pushes up stock prices, creating a self-reinforcing cycle.
- Triggers for Collapse:
- Fundamental Deterioration: When the earnings growth of these high-valuation stocks slows or negative events occur (e.g., regulation, increased competition), intrinsic value can no longer support the stock price, and the bubble bursts.
- Capital Flow Reversal: When inflows into index funds slow or turn into outflows, buying pressure weakens, stock prices fall, triggering more managers to sell, creating a negative feedback loop.
- Historical Case: After the 2000 dot-com bubble burst, the top 10 companies in the S&P 500 (e.g., Cisco, Microsoft, Intel) fell 50%-80% from 2000 to 2002, while the overall index fell about 45%. This validates the fragility of "high valuation + high concentration."
3. Active Management vs. Passive Indexing: The Fatal Impact of Behavioral Biases
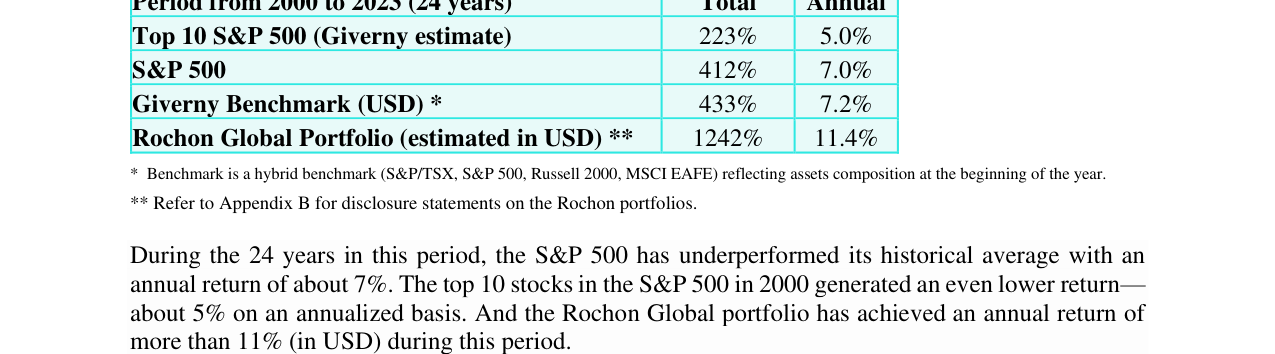
The table shows that from 2000 to 2023, the Rochon Global Portfolio had an annualized return of 11.4% and a cumulative return of 1,242%, outperforming the S&P 500's annualized return of 7.0%.
The continuation points out that the problem with index funds is not the concept itself, but investor behavior. The following is a key comparison:
| Strategy | Theoretical Advantage | Actual Behavioral Bias | Long-Term Return Impact |
|---|---|---|---|
| Passive Index Fund | Low cost, diversification, long-term holding | Buy high, sell low (buying high-valuation hot stocks, selling low-valuation unloved stocks); short holding period (average ETF holding period < 1 year) | Actual returns far below theoretical returns (due to frequent trading and timing errors) |
| Active Management (e.g., Giverny) | Select high-quality, reasonably valued companies, hold long-term | Must overcome emotional fluctuations, rely on discipline and patience | If executed correctly, can significantly outperform the index (e.g., Rochon portfolio 11.4% vs. index 7%) |
Core View:
- Behavioral Bias is a Return Killer: In the "Index Waltz," investors often buy at the peak (e.g., the tech stock peak in 2021) and sell at the trough (e.g., after the 2022 decline). This "buy high, sell low" behavior turns a passive strategy into active timing, with counterproductive results.
- Holding Period is Positively Correlated with Returns: Data shows that the average holding period for ETFs is only a few months, while Giverny Capital's average stock holding period is 5-7 years. A longer holding period reduces transaction costs and allows intrinsic value to be realized over time.
4. Implications for Investors: How to Avoid the "Index Waltz" Trap
1. Beware of High Concentration: When the top 10 companies in the S&P 500 account for more than 30% of the index (e.g., about 35% in 2023), be wary of the "Index Waltz" risk. At this point, passive index funds may be overly exposed to a few high-valuation stocks.
2. Adhere to a Margin of Safety: Even when buying high-quality companies (e.g., Alphabet, Meta), enter at a reasonable valuation (e.g., 20-25x P/E), rather than chasing highs.
3. Long-Term Perspective and Patience: History proves that even if investing from a market peak, as long as the holding period is long enough (e.g., 24 years), an actively managed portfolio can still generate excess returns. The key is to avoid panic selling.
4. Active Management vs. Passive Indexing: For disciplined investors, active management (e.g., Giverny's "high quality + reasonable valuation" strategy) may outperform passive indexing over the long term, especially during periods of extreme market divergence.
Summary
The "Index Waltz" is a short-term phenomenon driven by behavioral biases and market structure, but its long-term consequence is that high-valuation, high-concentration stocks eventually revert to intrinsic value, causing passive investors to earn below-average returns. Historical data (1973, 2000) and the outstanding performance of the Rochon portfolio together prove that: Adhering to a margin of safety, selecting high-quality companies, and holding them for the long term is the only reliable path to navigate market cycles and avoid the "Index Waltz" trap.