The Four 4s Behind the Compelling Opportunity in Japan Equities
GMO is a Boston asset manager co-founded in 1977 by Jeremy Grantham with Richard Mayo and Eyk Van Otterloo, known for valuation-driven dynamic asset allocation built on long-horizon mean reversion. Grantham is famous for calling historic bubbles, warning publicly ahead of both the 2000 dot-com crash and the 2008 financial crisis. Flagship publications include the GMO Quarterly Letter (now written by Asset Allocation co-heads Ben Inker and John Pease), Grantham's Viewpoints essays and the 7-Year Asset Class Forecast.
In plain words
This report argues that Japanese small-cap value stocks (smaller companies with low price-to-book ratios) are deeply undervalued. The Tokyo Stock Exchange is pushing firms to improve shareholder returns, and many have started buying back shares. Although a weak yen has hurt foreign investors' returns, Japanese corporate earnings are actually improving. GMO, a respected investment firm, expects the yen to strengthen, giving dollar-based investors an extra 4% annual return. They forecast a 12% annualized real return for these stocks. For ordinary investors, this could be a contrarian opportunity, but currency risk remains.
GMO Research Report: The Four "4" Opportunities in the Japanese Stock Market The GMO research report "The Four '4' Opportunities in the Japanese Stock Market" points out that despite the TOPIX index rising 28% in 2023, investors remain generally underweight and skeptical. The core argument of the re
Theme and Background
This chapter serves as the introduction to the GMO research report, aiming to clarify why undervalued investment opportunities exist in the Japanese stock market (particularly small-cap value stocks) under the current market environment. Despite the TOPIX index rising 28% in 2023, most active managers remain underweight and skeptical, and the report argues that the market has yet to fully recognize the persistence of Japan's fundamental improvements.
Core Thesis
The author's central judgment is that Japan is undergoing lasting fundamental improvements and a fundamental shift in shareholder attitudes, rather than a temporary rebound. This judgment stands in stark contrast to the prevailing skepticism in the market. The counterintuitive point is that investors overlook Japanese equities due to lackluster dollar/euro returns caused by yen depreciation, but the report argues that this is precisely the opportune moment for positioning.
Key Arguments and Data
- Divergence between market performance and investor sentiment: The TOPIX index (local) rose 28% in 2023, yet most active managers remain underweight and skeptical.
- Drivers: Policy initiatives supporting shareholder interests (e.g., Tokyo Stock Exchange reforms) and corporate earnings exceeding expectations are the main catalysts for stock price gains.
- GMO's 7-year asset class forecast framework: Japanese small-cap value stocks are expected to deliver a 12% absolute return, the highest among all GMO asset class forecasts.
- Core contradiction: Yen depreciation leads to lackluster dollar/euro returns, masking the substantive progress in Japan's corporate fundamental improvements.
Companies/Assets Involved
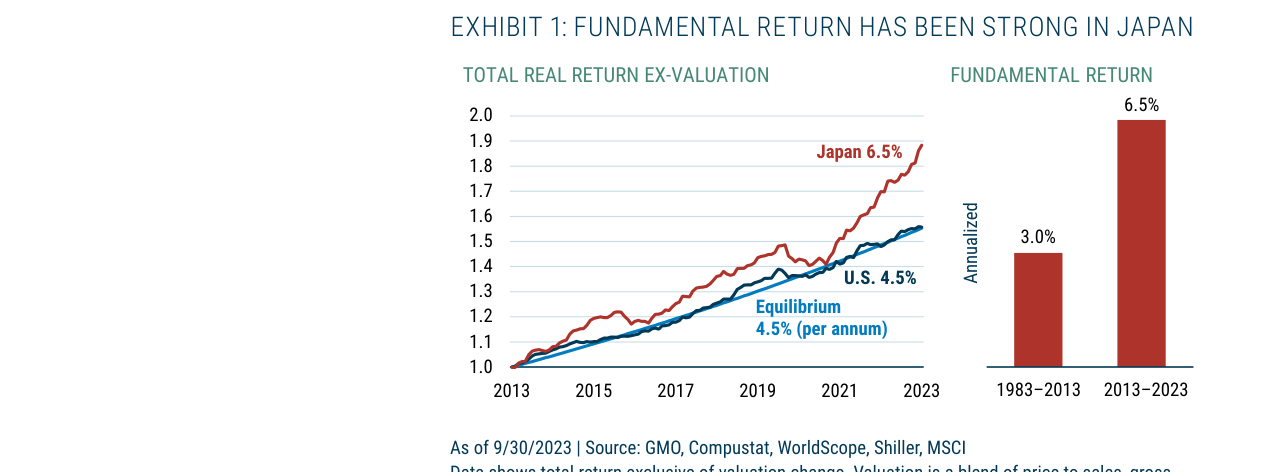
Japan's fundamental return reached an annualized 6.5% from 2013 to 2023, significantly higher than the 3.0% in the prior 30 years and the 4.5% in the U.S.
| Asset/Index | Role | Key Data | View |
|---|---|---|---|
| TOPIX Index | Market benchmark | Up 28% (local) as of November 2023 | Reflects short-term market enthusiasm but has not changed investors' underweight stance |
| Japanese Small-Cap Value Stocks | Core recommended asset | GMO forecasts 7-year absolute return of 12% | Strongly bullish, considered the most attractive Japanese asset class currently |
Investment Implications
Investors should strategically increase allocation to Japanese small-cap value stocks, leveraging the current market's excessive concern over yen depreciation and underweight positioning to capitalize on the long-term trend of improving corporate fundamentals and enhanced shareholder returns in Japan. The key is to distinguish between short-term currency fluctuations and long-term fundamental improvements, with the latter being the core driver of excess returns.
Theme and Background
This chapter focuses on the impact of yen depreciation on U.S. dollar-denominated investors. The report argues that the yen is currently undervalued, and if it slowly reverts to fair value, U.S. dollar investors could gain an additional annualized return of approximately 4%. This judgment is based on GMO’s expectation of a long-term mean reversion in the yen exchange rate, rather than short-term speculation.
Core Viewpoint
The author believes that yen depreciation is the key reason U.S. dollar investors overlook the true returns of the Japanese stock market. Although Japanese companies have achieved an annualized real fundamental return of 6.5% over the past 10 years (excluding valuation changes), higher than the U.S. figure of 4.5%, yen depreciation has resulted in lackluster dollar-denominated returns, masking this advantage. If the yen slowly appreciates to fair value, U.S. dollar investors will benefit from a significant currency tailwind.
Key Arguments and Data
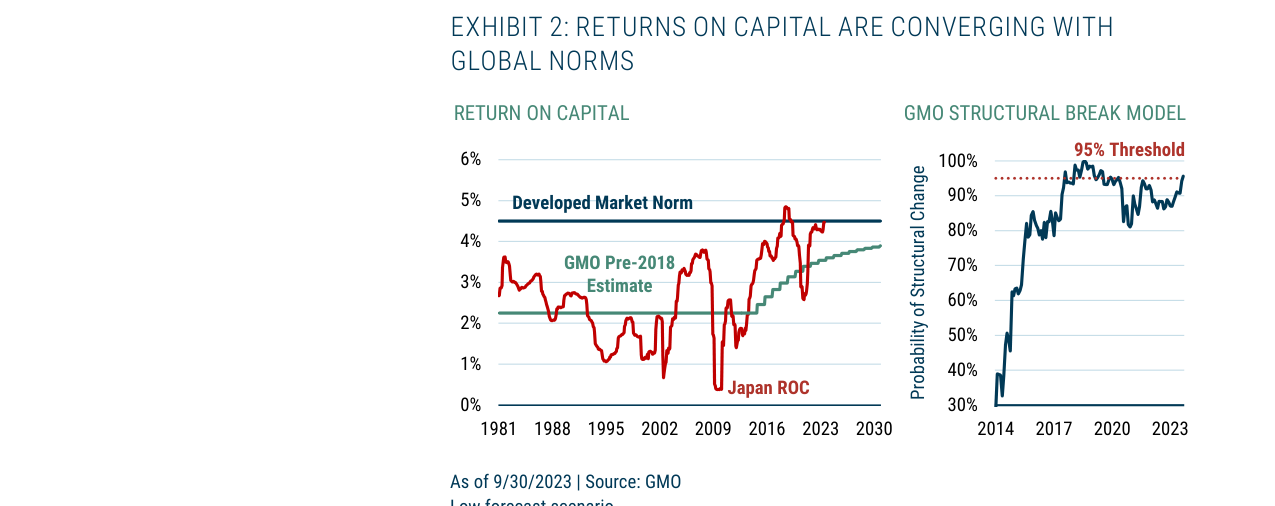
Japan’s return on capital has rebounded from its 2009 low to approximately 4.5%, approaching developed market norms; a structural break model indicates a 95% probability that the improvement is sustainable
- Fundamental Return Comparison: Over the past 10 years (2013–2023), Japanese companies posted an annualized real fundamental return of 6.5%, higher than the U.S. figure of 4.5% and also above GMO’s equilibrium level of 4.5%. However, for U.S. dollar investors, this real return was offset by yen depreciation.
- Historical Context: In the preceding 30 years (1983–2013), Japanese companies’ fundamental return was only 3%, well below the equilibrium level, leading investors to remain skeptical about the improvement in Japan’s fundamentals.
- Yen Valuation: The report contends that the yen is currently undervalued. If it slowly reverts to fair value, U.S. dollar investors could gain an additional annualized return of approximately 4% (the “4% Tailwind”).
| Indicator | Japan | U.S. | Equilibrium Level |
|---|---|---|---|
| Annualized Real Fundamental Return (Past 10 Years) | 6.5% | 4.5% | 4.5% |
| Annualized Real Fundamental Return (Preceding 30 Years) | 3% | - | 4.5% |
| Additional Annualized Return from Yen Reverting to Fair Value | 4% | - | - |
Companies/Assets Involved
This chapter does not mention specific individual stocks; it primarily discusses the overall Japanese stock market (TOPIX index) and the return structure for U.S. dollar-denominated investors.
Investment Implications
- U.S. Dollar Investors Should Focus on Yen Exchange Rate Risk: If the yen slowly appreciates from its current undervalued level, U.S. dollar investors could gain an additional annualized return of approximately 4%, significantly enhancing the appeal of the Japanese stock market.
- Fundamental Improvement Is Core: The fundamental returns of Japanese companies have consistently outperformed those of the U.S., but currency fluctuations have masked this advantage. Investors should distinguish between exchange rate and fundamental factors, avoiding neglect of long-term value due to short-term currency volatility.
- Long-Term Allocation Opportunity: The report believes that the yen’s reversion to fair value is a high-probability event. U.S. dollar investors may consider increasing their allocation to the Japanese stock market, particularly small-cap value stocks, to capture dual benefits from both fundamental growth and currency appreciation.
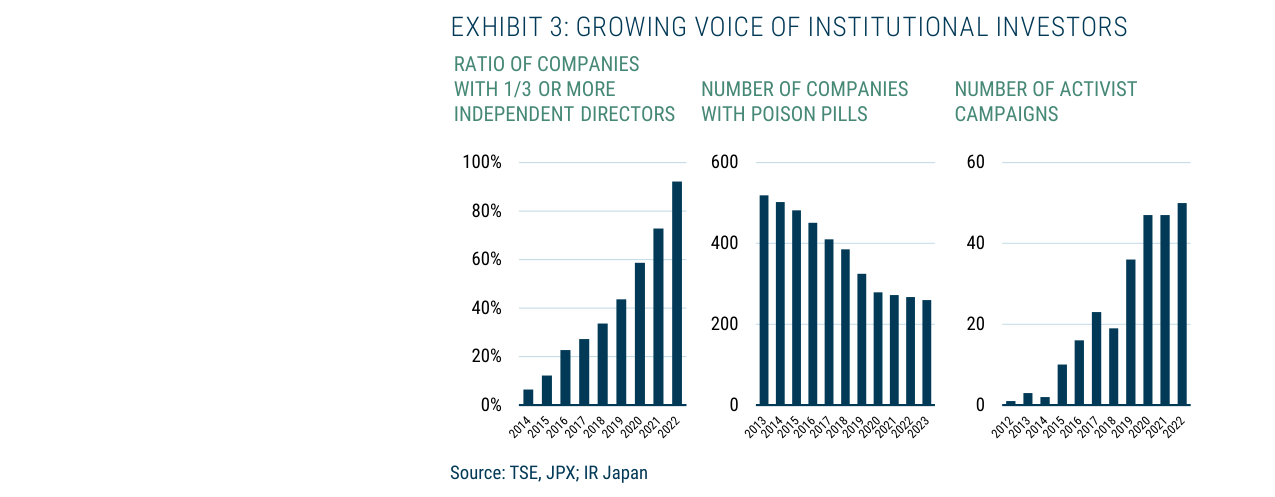
The proportion of companies with more than one-third independent directors rose from approximately 5% in 2014 to about 95% in 2022, the number of companies with poison pills halved, and activist activity increased roughly tenfold over the decade.
Theme and Background
This chapter focuses on the "1x Price-to-Book Ratio (PBR) Reform" policy introduced by the Tokyo Stock Exchange (TSE), the most closely watched regulatory initiative in the Japanese stock market in 2023. The report argues that the policy aims to force listed companies to improve capital efficiency and profitability, addressing the long-standing undervaluation issue in the Japanese market—at the start of the year, over half of the companies on the TSE Prime section had a PBR below 1x and an ROE below 8%, well below the average of developed markets.
Core Argument
The author believes that the TSE's PBR reform is a key catalyst for structural improvement in the Japanese stock market, with an impact equivalent to the New York Stock Exchange (NYSE) and the U.S. Securities and Exchange Commission (SEC) jointly demanding that U.S. companies enhance profitability and valuations. The policy has already produced tangible effects: companies are accelerating buybacks and reducing cross-shareholdings, and the number of companies with a PBR below 1x is declining. The report emphasizes that this policy originates from the exchange and financial regulators, not the government's executive branch, giving it stronger enforcement power and market discipline.
Key Arguments and Data
1. Policy Background and Current Status: At the start of 2023, over 50% of companies on the TSE Prime section had a PBR < 1x and an ROE < 8%, far below developed market standards. The TSE requires all listed companies to disclose their cost of capital and specific action plans to improve returns.
2. Corporate Response Speed: According to JPMorgan, as of mid-November 2023, 65% of companies on the TSE Prime section with a PBR < 1x had announced share buybacks or dividend increases. While the number of companies announcing buybacks declined slightly year-over-year, those announcing dividend increases rose significantly.
3. Cross-Shareholding Reduction Case: The Toyota Group, previously resistant to reducing cross-shareholdings, recently announced plans to sell shares in Denso and KDDI. The report argues this will create a "flywheel effect": companies raise funds by selling cross-shareholdings and use them to buy back their own shares, which are precisely the stocks being sold by Toyota and others.
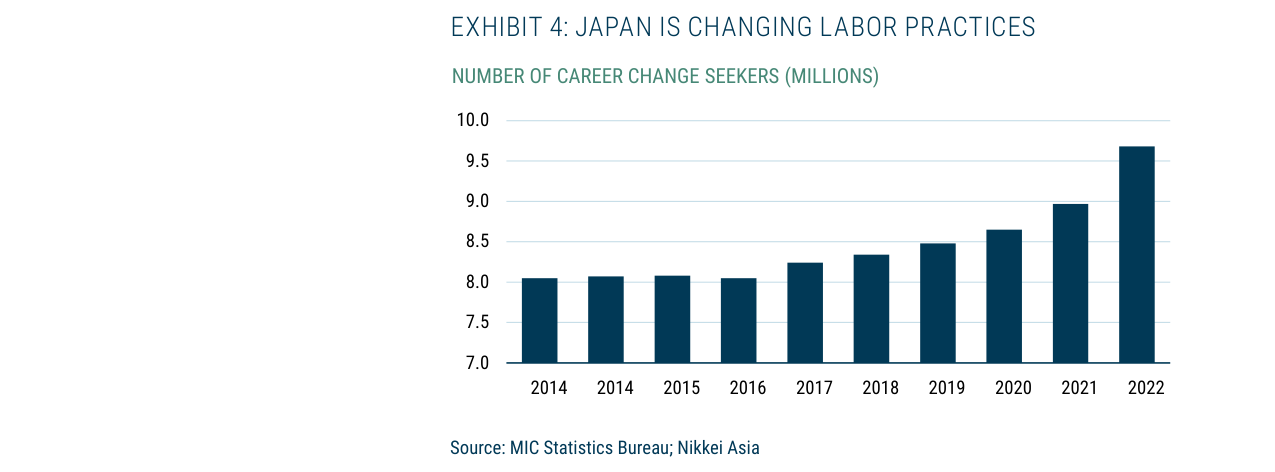
The number of job changers in Japan steadily rose from approximately 8 million in 2014 to about 9.7 million in 2022.
4. Extreme Cases: Some companies, unable to bear the pressure of being listed, have begun to voluntarily delist.
| Indicator | Data |
|---|---|
| Proportion of TSE Prime companies with PBR < 1x at start of 2023 | >50% |
| ROE level of these companies | <8% |
| Proportion of PBR < 1x companies announcing buybacks/dividend increases (as of mid-November 2023) | 65% |
| Number of hostile takeovers/tender offers in 2023 (as of September) | 49 (highest since the launch of Abenomics in 2012) |
Companies/Assets Involved
- Toyota Group: Previously firmly resisted reducing cross-shareholdings but recently announced plans to sell shares in Denso and KDDI. The report views this as a landmark case signaling an acceleration in the trend of cross-shareholding reduction.
- Denso: One of the cross-shareholding targets that the Toyota Group plans to sell.
- KDDI: Another cross-shareholding target that the Toyota Group plans to sell.
- Nidec: CEO Nagamori cited METI's revised "Fair M&A Guidelines" to justify a hostile takeover, showing that regulatory policies have begun to influence corporate behavior.
Investment Implications
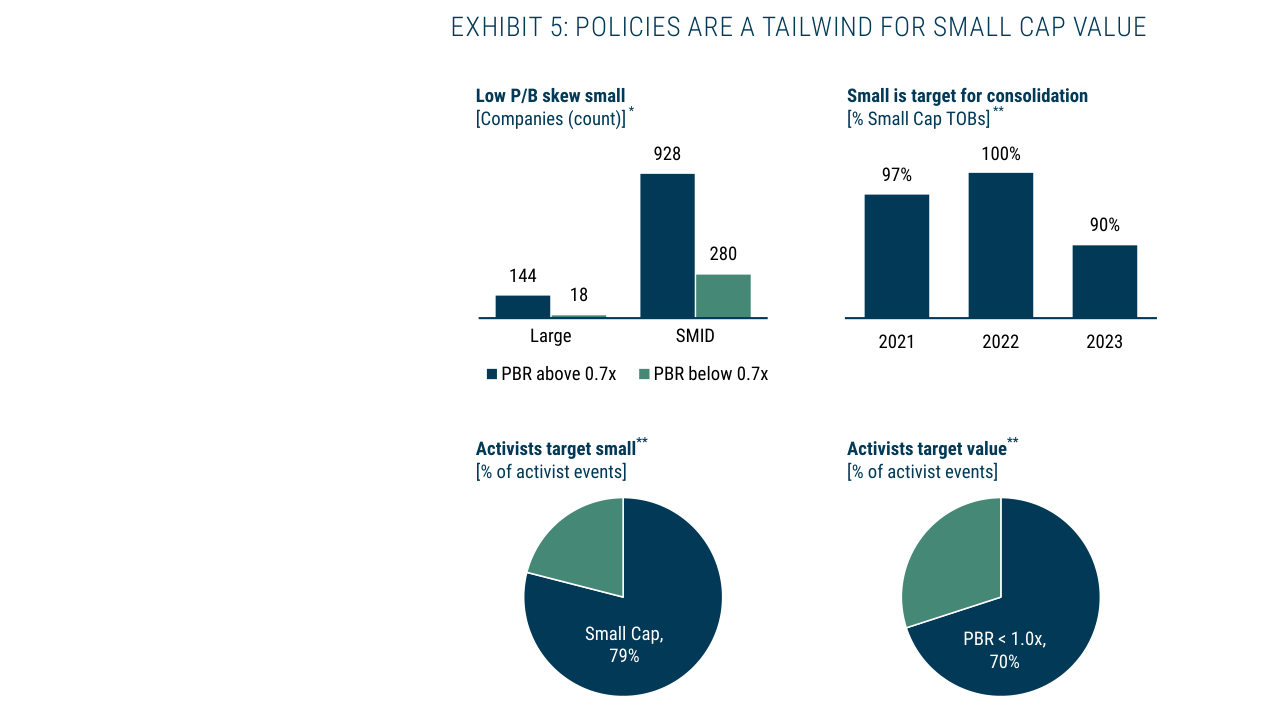
280 small-cap companies have a P/B below 0.7x; small caps account for 90-100% of tender offers; 79% of activist activity targets small caps, and 70% targets companies with P/B < 1.0x.
Investors should focus on TSE Prime companies with a PBR < 1x and an ROE < 8%, as these face the greatest reform pressure and are most likely to boost valuations through buybacks, dividend increases, or cross-shareholding reductions. Meanwhile, the "flywheel effect" of cross-shareholding reduction may create arbitrage opportunities: targets of sold cross-shareholdings may face short-term pressure, but companies buying back their own shares will gain valuation support. Additionally, the increase in voluntary delistings may indicate that some undervalued companies are opting for privatization, and investors should be wary of related risks.
Additional Arguments and Views: Deepening Structural Opportunities Driven by Policy
1. More Defined Transmission Mechanism of Policy Dividends to Small-Cap Value Stocks
The GMO white paper quantifies the policy's tilt effect toward small-cap value stocks through data:
- PBR Reform Targeting: Among TOPIX companies with a PBR below 0.7x, there are 280 small- and mid-cap (SMID) companies, compared to only 18 large caps. This means the TSE's 1x PBR initiative covers small- and mid-cap companies more than 15 times as broadly as large caps.
- Industry Consolidation Target: In METI-driven industry consolidation, over 90% of tender offers (TOB) target companies with a market cap below $2 billion, while Japanese small caps (market cap < $2 billion) account for the vast majority of listed companies.
- Activist Investor Preference: In 2023, 79% of activist investor events in Japan targeted small caps, and 70% targeted value stocks with a PBR < 1x. The policy environment (e.g., more transparent shareholder communication rules) further reduces the cost of activist action.
2. Historical Extremity of Small-Cap Value Stock Discounts and Mean Reversion Potential
| Indicator | Current Level | Historical Percentile | Implied Excess Return |
|---|---|---|---|
| Discount of Japanese small-cap value stocks relative to the market | 15th percentile | One of the lowest ranges since 1983 | 4% annualized (relative to market) |
| Deviation of JPY/USD from fair value | Approximately 40% discount | Lowest since the 1970s | 4% annualized (in USD terms) |
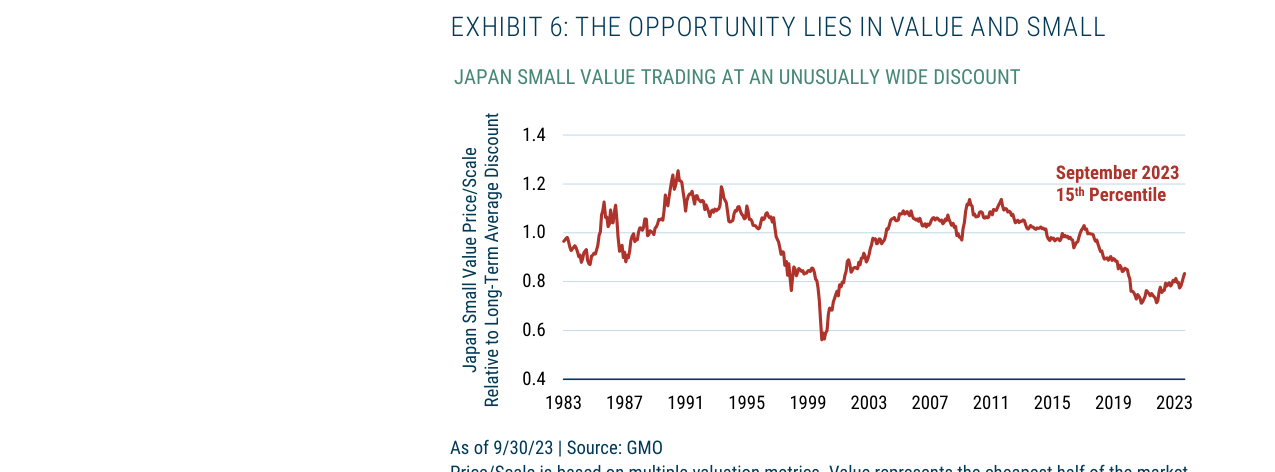
Japanese small-cap value stocks are at the 15th historical percentile relative to their long-term average valuation, at an unusually wide discount level.
Key Logic: The discount on small-cap value stocks is not driven by fundamental deterioration. Since 2016, their relative earnings growth has only slightly lagged the market (1.2% lower annually), but valuation compression (the discount expanding from average levels to extreme lows) is the main drag on relative returns. Once valuations revert to the mean, the narrowing discount will contribute excess returns.
3. "Dual-Path" Return Mechanism of a Weak Yen
GMO notes that the yen is at a historically undervalued level (a 40% discount to fair value), offering USD-based investors two return paths:
- Direct Path: Yen appreciation. If the yen returns to fair value, USD-denominated returns will gain additional currency gains.
- Indirect Path: A persistently weak yen. Japanese exporters (especially small-cap manufacturers) gain a cost advantage, driving earnings growth and thus boosting stock prices.
Historical data supports this: when the yen is in its cheapest range, Japanese stocks outperform other developed markets by over 5% annualized over the next three years; when the yen is most expensive, they underperform by over 10%.
4. Comprehensive Return Forecast: 12% Real Annualized (USD-Denominated)
GMO stacks three "4%" components:
- Local Market: 4% real return (based on fair value assessment of the Japanese stock market)
- Small-Cap Value: 4% relative excess return (based on mean reversion of the discount)
- Yen Effect: 4% additional return (based on undervaluation repair or competitive dividend)
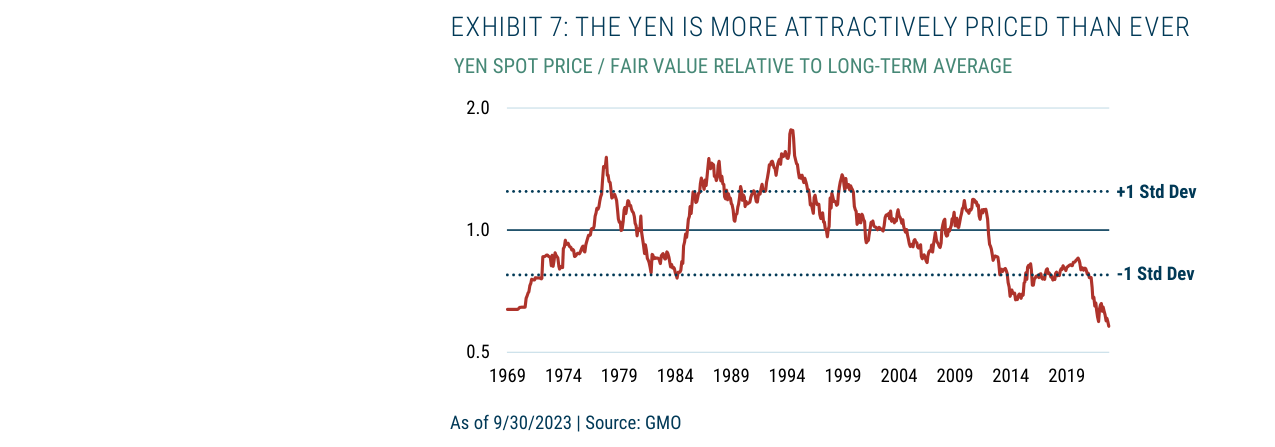
The yen is undervalued by approximately 40% relative to fair value, at its lowest level since the 1970s, more than one standard deviation below the long-term average.
Final forecast: Japanese small-cap value stocks are expected to deliver a real annualized return of approximately 12% in USD terms, placing this among the most attractive ranges across global major asset classes. GMO therefore sets its Japan allocation weight at 2-4 times the benchmark.
5. Long-Term Synergy Between Policy and Fundamental Improvement
The four policies (TSE reform, METI consolidation, shareholder dialogue, activist-friendly environment) not only provide short-term catalysts but also form a positive cycle with the ROE improvement and governance reforms already achieved by Japanese companies:
- ROE Improvement: Japanese corporate ROE rose from approximately 6% in 2012 to about 9% in 2023, with policies further driving capital efficiency optimization.
- Governance Reform: Reduced cross-shareholdings, increased board independence, and higher share buybacks create conditions for value realization in small-cap value stocks.
Comparative Data: Expected Returns Across Asset Classes
| Asset Class | Expected Real Annualized Return (USD-Denominated) | Core Drivers |
|---|---|---|
| Japanese Small-Cap Value Stocks | 12% | Policy dividends + discount reversion + yen appreciation |
| Japanese Large-Cap Stocks | 4% | Fair value + limited policy tilt |
| U.S. Treasury Bonds (Nominal) | 1% | Low interest rate environment |
| Japanese Cash | 0% | Zero interest rate policy |
Conclusion: Through the "Four 4%" framework, GMO systematically argues for the structural opportunity in Japanese small-cap value stocks driven by the triple factors of policy, valuation, and currency. Its core thesis is that policy dividends tilt far more toward small caps than large caps, while extreme valuation discounts and the historically undervalued yen provide deterministic sources of return from mean reversion.