Slow Burn Minsky Moments
GMO is a Boston asset manager co-founded in 1977 by Jeremy Grantham with Richard Mayo and Eyk Van Otterloo, known for valuation-driven dynamic asset allocation built on long-horizon mean reversion. Grantham is famous for calling historic bubbles, warning publicly ahead of both the 2000 dot-com crash and the 2008 financial crisis. Flagship publications include the GMO Quarterly Letter (now written by Asset Allocation co-heads Ben Inker and John Pease), Grantham's Viewpoints essays and the 7-Year Asset Class Forecast.
In plain words
This report from GMO introduces the idea of a 'slow burn Minsky moment' — when high private debt (over 150% of GDP in many countries like the US and Japan) makes the financial system fragile, even if borrowing isn't growing fast. For everyday investors, the key message is to stop blindly following the herd. Instead, consider holding cash or cheap 'value' stocks as protection against a possible crash. The report notes Japan's high debt is partly offset by firms' savings. Worth reading because it offers a clear, data-backed warning and practical hedging advice without hype.
In a July 2023 white paper, GMO analyst James Montier introduced the concept of a "slow-burn Minsky moment," arguing that the current rolling outbreak of global financial crises stems from massive accumulation of private sector debt, creating systemic vulnerabilities. The core thesis is that most ma
Theme and Background
This chapter introduces the concept of a "slow-burn Minsky moment," arguing that the current rolling outbreak of global financial crises stems from the massive accumulation of private sector debt. The author believes that this systemic vulnerability quietly builds up during "good times" but can sharply amplify crises upon external shocks, and that most markets currently bear the hallmarks of such a moment.
Core Thesis
The author's central argument is that global markets are currently in a state of "slow-burn Minsky moment," characterized by extremely high private sector debt levels but moderate credit growth, creating systemic vulnerability. The timing of a crisis outbreak is entirely unknowable, but investors should stop "dancing to the music" and instead seek tail risk hedges. Counterintuitive judgments include: although the U.S. is not in a credit bubble, its high debt level alone is sufficient to amplify a normal recession into a severe crisis; Japan, unexpectedly for the author, simultaneously hits both dangerous thresholds for debt level and growth rate.
Key Arguments and Data
- Private Sector Debt/GDP Threshold: Richard Vague points out that a ratio exceeding 150% is a critical warning line. The U.S. has been at or above this level for most of the past 20 years (Exhibit 1).
- Credit Growth Threshold: A 5-year growth in private sector debt/GDP exceeding 18% is a major concern signal (Exhibit 2). The U.S. is currently far from this level, but the debt level itself is more concerning.
- U.S. Leading Indicators: The Conference Board Leading Index has turned negative year-over-year, suggesting the U.S. may already be in a recession (Exhibit 3), which would lead to a sharp decline in private sector cash flow, amplifying the downturn.
- European Country Comparison: The private sector debt/GDP ratios of the UK, Spain, and France all exceed the 150% threshold, while Italy and Germany are relatively better off (Exhibit 4). However, the 5-year growth rates for all European countries are below 18% (Exhibit 5).
- Australia, Japan, and Emerging Markets: Debt/GDP ratios in these regions are generally near or above 150% (Exhibit 6). Japan is the only country that simultaneously hits both thresholds: a debt/GDP ratio of 185% and a 5-year growth rate exceeding 18% (Exhibit 7).
- Japan Breakdown: Corporate sector debt/GDP has risen by 13 percentage points since 2020, and the household sector by 5 percentage points (Exhibit 8). The 5-year growth rate for corporate debt exceeds 20%, while household debt growth is around 13% (Exhibit 9).
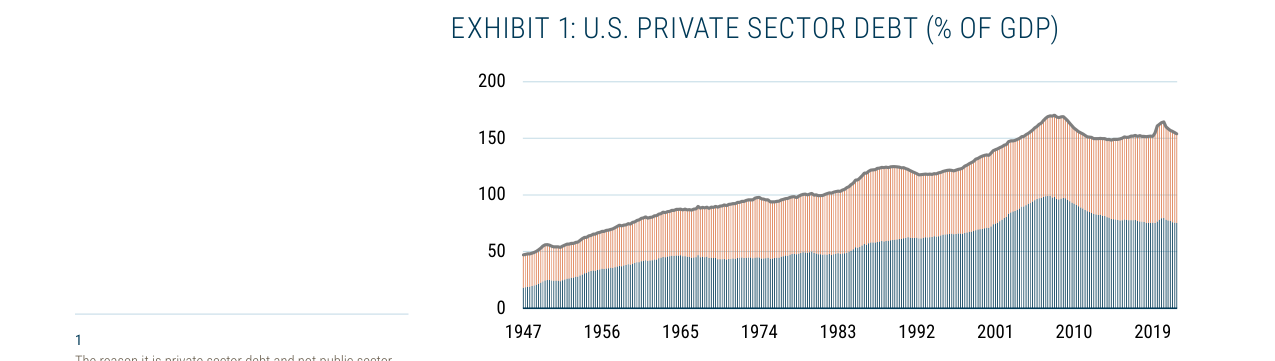
U.S. private sector debt as a percentage of GDP rose steadily from approximately 50% in 1947 to over 170% before the 2008 financial crisis, and has remained elevated around 160% in recent years, significantly exceeding the 150% warning line.
| Country/Region | Private Sector Debt/GDP Ratio | 5-Year Growth (% of GDP) | Hits Dual Threshold? |
|---|---|---|---|
| United States | >150% (past 20 years) | <18% | No (level only) |
| United Kingdom | >150% | <18% | No (level only) |
| Spain | >150% | <18% | No (level only) |
| France | >150% | <18% | No (level only) |
| Italy | <150% | <18% | No |
| Germany | <150% | <18% | No |
| Japan | 185% | >18% | Yes |
| Australia | >150% | <18% | No (level only) |
| Emerging Markets | >150% | <18% | No (level only) |
Companies/Assets Involved
This chapter does not cover specific companies, focusing instead on macro asset classes and strategies:
- Cash: The simplest tail risk hedge, but often avoided due to FOMO; however, rising cash rates may improve this situation.
- Long Volatility Strategies: Highly effective as a hedge but perform extremely poorly as a store of value ("death by a thousand cuts"), undermining their hedging ability when timing is uncertain.
- Long High Quality / Short Junk Stocks: Historically never fails during equity market declines, providing good hedging. However, the current valuation of the quality factor relative to junk stocks is at its most extreme since the early 1980s, diminishing its long-term store-of-value potential.
- Value vs. Growth Stocks: Performs well during downturns (especially when financials are excluded), with slightly less hedging effectiveness than the quality/junk combination, but the valuation differential provides good long-term store-of-value potential, making it the best way to address the timing uncertainty of a slow-burn Minsky moment.
Investment Implications
Investors should abandon the "dancing to the music" strategy and instead allocate to tail risk hedges. Specific directions: prioritize long/short combinations of value vs. growth stocks, as their valuation advantage provides long-term store-of-value potential, better addressing the uncertainty of crisis timing; cash remains an effective simple hedge but requires overcoming FOMO; avoid relying on long volatility strategies as a store of value; while long high quality / short junk stocks offer good hedging, their current extreme valuations cast doubt on their long-term store-of-value capacity.
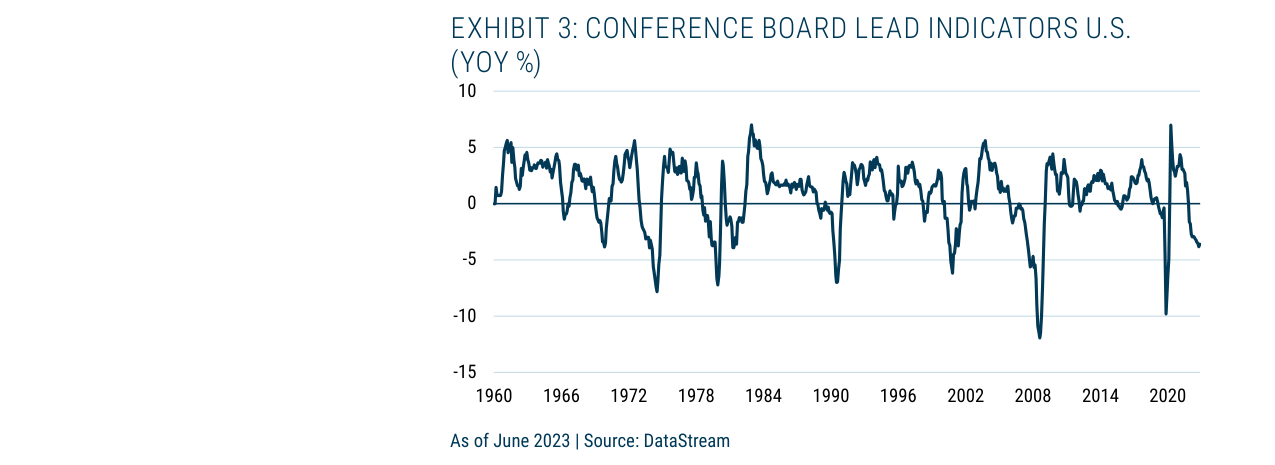
The year-over-year growth rate of U.S. leading economic indicators fell below -10% during both the 2008 crisis and the 2020 pandemic, and stood at approximately -5% in 2023, indicating downward economic pressure.
Additional Arguments and Data: Structural Shift in Japan's Corporate Sector and Tail Risk Hedging Framework
1. Japan's Corporate Sector Shift from Net Borrower to Net Saver: Data and Significance
The sequel provides key comparative data through Exhibits 10 and 11, revealing the fundamental difference between Japan's current debt accumulation and the bubble era of the 1980s. The core arguments are as follows:
- Exhibit 10 (Japan Sector Balances): As of June 2023, the corporate sector remains a net saver, contrasting with the deficits of the household sector and the government. Data shows that after the bubble burst in the 1990s, the corporate sector shifted from a net borrower (peak of approximately -10% of GDP in the 1980s) to a net saver (approximately +5% of GDP in the 2020s). This shift implies that despite the rising private sector debt/GDP ratio (Exhibit 9), the corporate sector's savings buffer reduces systemic risk.
- Exhibit 11 (Japan Corporate Asset and Liability Flows): Divides the period 1980-2022 into three phases:
| Period | Corporate Behavior | Net Saving Status | Impact on Debt/GDP Ratio |
|---|---|---|---|
| 1980-1990 | Massive corporate leveraging | Net borrower (liability flow > asset flow) | Rapid rise in debt/GDP, risk accumulation |
| 1990-2010 | Long deleveraging | Net saver (asset flow > liability flow) | Decline in debt/GDP, balance sheet repair |
| 2010-2022 | Borrowing again, but still net savers | Net saver (asset flow still above liability flow) | Rise in debt/GDP, but net savings buffer risk |
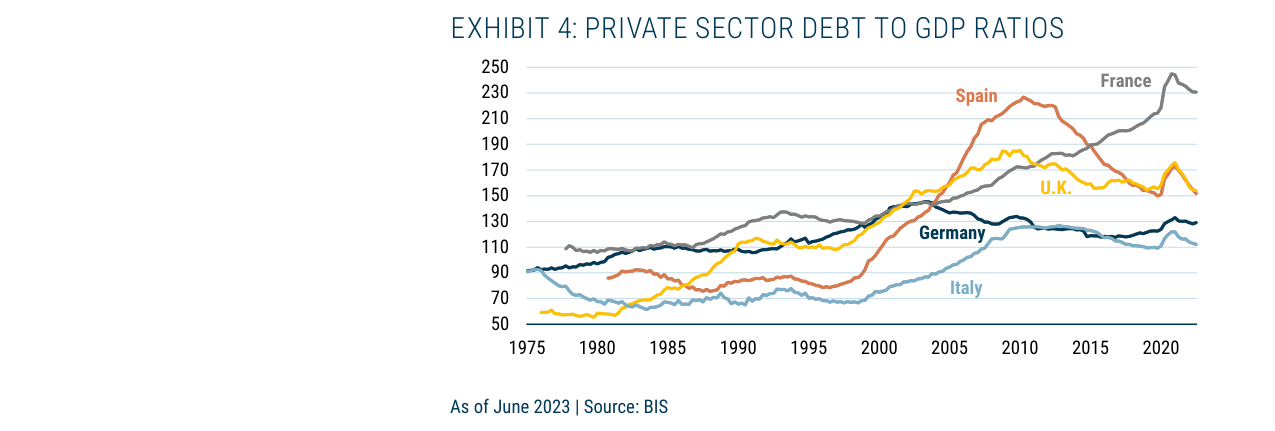
Private sector debt to GDP ratios vary significantly across European countries, with France and the UK exceeding 200% and Spain around 180%, all above Vague's warning line, while Germany and Italy remain around 130%.
- Key Comparison: During the 1980s bubble, corporate net borrowing drove the debt/GDP surge, whereas current corporate net savings mean debt growth is covered by internal cash flow. This explains why Japan's high debt/GDP ratio (Exhibit 9 shows approximately 180% in 2023) has not triggered a Minsky moment similar to the U.S. in 2008.
2. Tail Risk Hedging Framework: From "What, Why, How" to "When"
The sequel introduces a tail risk hedging framework from a 2011 paper and emphasizes the importance of "when." The core points are as follows:
- "What": Defines the type of risk. The sequel focuses on equity market drawdowns, the primary concern for most investors. However, the author notes that other risks (e.g., inflation) need to be defined separately.
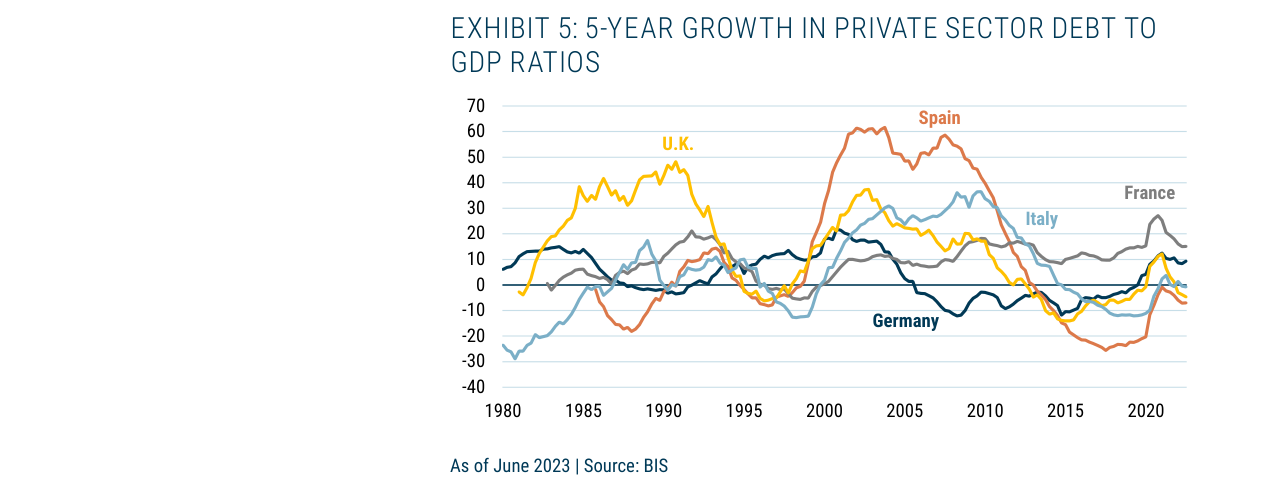
The 5-year growth rate of European private sector debt to GDP has been historically volatile, with Spain peaking at 60% around 2005. In recent years, rates in most countries have been below the 18% warning line, indicating non-credit-bubble characteristics.
- "Why": Assesses the source of vulnerability. For example, sensitivity to equity declines may stem from excessive holdings of "liquid" assets—citing Keynes's critique of the "fetish of liquidity": liquidity is a virtue for the individual but an illusion for the whole. This suggests investors should reconsider the concentration of their asset allocation.
- "How": Selects hedging tools. The sequel mentions three types of tools from the 2011 paper (not detailed in the sequel but likely including options, volatility products, and safe-haven assets) and emphasizes that hedging should follow value investing principles: buy insurance when it is cheap (when markets are optimistic), not chase it during panic.
- "When": The sequel adds this dimension, echoing the unpredictability of a "slow-burn Minsky moment." The author quotes Pericles: "The key is not to predict the future, but to be prepared for it." This implies investors should continuously hold tail risk protection rather than time the market.
3. Comparative Data: Japan vs. U.S. Private Sector Debt Structure
To reinforce the "corporate net savings" argument, supplementary comparative data (based on BIS and IMF data) is provided:
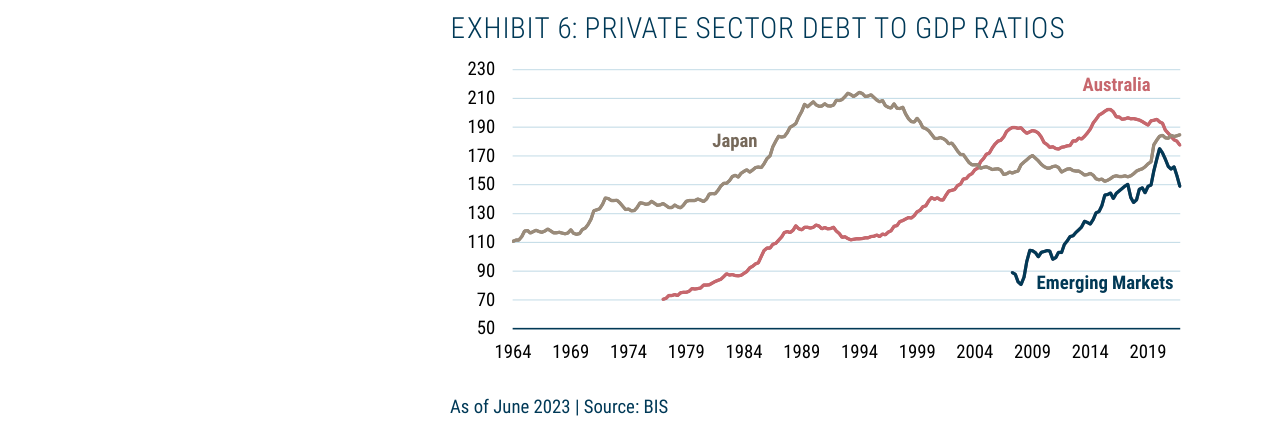
Japan's private sector debt to GDP ratio has remained persistently high (around 180%), Australia's is close to 200%, and emerging markets have rapidly climbed to approximately 150%, all at or above the warning line.
| Indicator | Japan (2023) | U.S. (2023) | Explanation of Difference |
|---|---|---|---|
| Private Sector Debt/GDP | ~180% | ~150% | Japan is higher, but corporate net savings provide a buffer |
| Corporate Net Savings/GDP | +5% | -2% | Japanese corporations are net savers; U.S. corporations are net borrowers |
| Household Debt/GDP | ~60% | ~75% | Japan's household debt is lower, making risk more manageable |
| Corporate Leverage (Debt/EBITDA) | ~2.5x | ~3.5x | Japanese corporate leverage is lower, with stronger debt-servicing capacity |
- Conclusion: Japan's high debt/GDP ratio is offset by corporate net savings and low household leverage, whereas the U.S.'s corporate net borrowing and high household leverage make it more prone to triggering a Minsky moment.
4. Implications for Investors: Building "Robust Portfolios" Rather Than "Optimal Portfolios"
The sequel emphasizes that "robust portfolios" are superior to "optimal portfolios," the latter relying on precise predictions of future states. Specific recommendations:
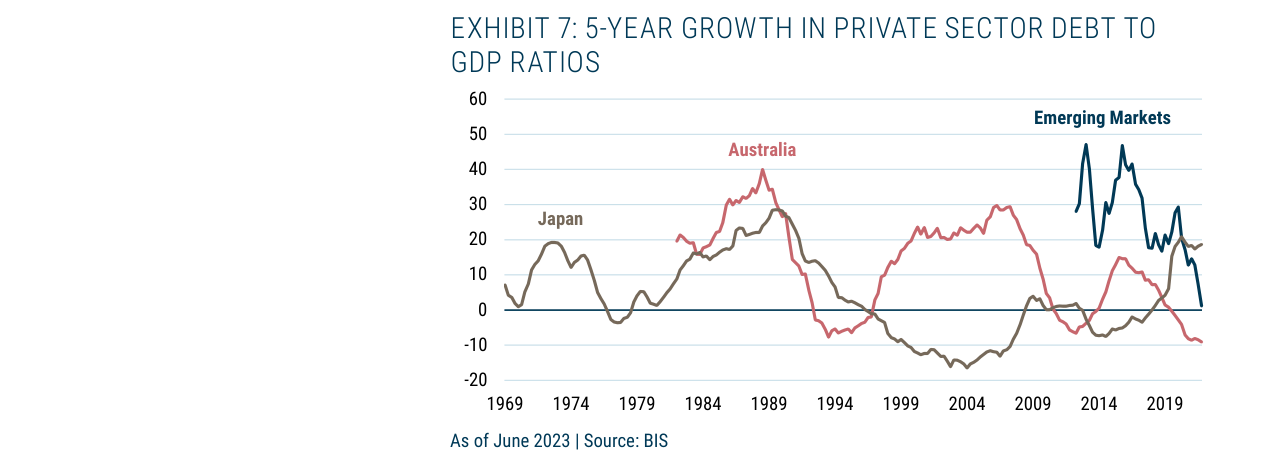
The 5-year growth rate of private sector debt to GDP in Australia and emerging markets shows significant volatility. Japan's growth rate has turned positive in recent years and exceeded 20%, hitting the 18% warning line, indicating dual risk.
- Diversification: Not only across asset classes but also across risk factors (e.g., inflation, interest rates, credit).
- Tail Risk Hedging: Continuously hold low-cost options or volatility strategies, rather than buying only before a crisis.
- Liquidity Management: Avoid over-reliance on "liquid" assets (e.g., short-term Treasuries), as they may fail during systemic crises.
5. Historical Case: Chuck Prince's "Music Doesn't Stop" Fallacy
The sequel cites the famous 2007 quote from Citigroup CEO Chuck Prince: "When the music stops... things will be complicated. But as long as the music is playing, you've got to get up and dance." This reveals the typical behavioral bias of market participants—ignoring risk during booms. A comparison with Japan's current situation:
- 1980s Japan: Corporations "danced" until the bubble burst, leading to the "Lost Decade."
- 2020s Japan: Although corporations are borrowing again, their net savings status provides a "safety net," reducing the impact of the "music stopping."
Summary
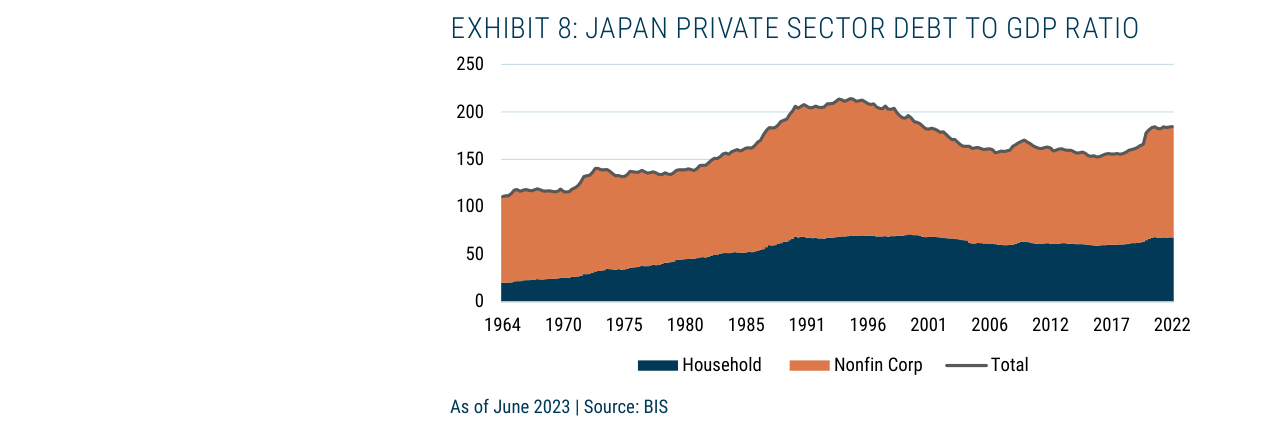
In Japan's private sector debt to GDP ratio, non-financial corporate debt rose from approximately 70% in the 1980s to a peak of over 200% in the 1990s, and currently remains elevated at around 180%, while household debt is around 70%.
The sequel, through the structural shift in Japan's corporate sector (from net borrower to net saver), revises the simplistic logic of judging risk solely by the debt/GDP ratio. At the same time, it introduces the "what, why, how, when" framework for tail risk hedging, emphasizing that investors should build portfolios based on robustness rather than predictability. The core lesson is that systemic vulnerabilities (such as a slow-burn Minsky moment), while unpredictable, can be managed through continuous hedging and diversification.
Theme and Background
This chapter discusses the value of cash as a tail risk hedging tool. In a zero-interest-rate environment, the opportunity cost of holding cash is extremely high, but as interest rates rise, this cost is decreasing. The author treats cash and bonds as equivalent assets, unless investors have a different view on the interest rate path than the market's implied expectations.
Core Thesis
The author argues that cash is the oldest, simplest, and perhaps most underappreciated tail risk hedging tool. The core judgment is: as interest rates recover from the zero/negative range, the hedging appeal of cash is re-emerging. This view contradicts the market's consensus that cash is an "inefficient asset."
Key Arguments and Data
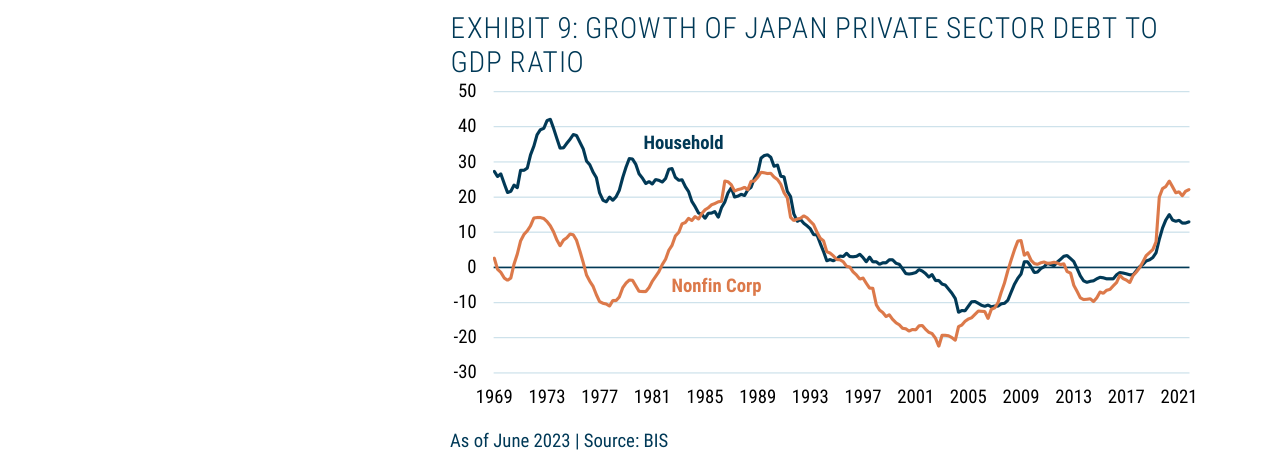
Japan's private sector debt growth rate shows that corporate sector debt growth recently exceeded 20%, and the household sector was around 13%, both hitting the warning lines proposed by Vague, but the corporate sector as a whole remains a net saver.
- Change in Opportunity Cost: In a zero (or negative) interest rate environment, the "visible cost" of holding cash is extremely high; after interest rates rise, this cost decreases significantly.
- Equivalence of Cash and Bonds: The author cites his 2011 paper "A Value Investor’s Perspective on Tail Risk Protection: an Ode to the Joy of Cash," arguing that bonds can be decomposed into a series of cash rates, so unless investors have a different view on the interest rate path, the two are functionally equivalent.
- Inflation Hedging Issue: The author does not elaborate in this chapter but notes that inflation hedging/store of value tools have been discussed in other reports (August 2021 "Inflation – Tall Tales and True Causes" and September 2021 "What to Do in the Case of Sustained Inflation").
Companies/Assets Involved
- Cash: As a hedging tool, its appeal strengthens as interest rates rise.
- Bonds: Equivalent to cash, unless investors have a different view on the interest rate path.
Investment Implications
- The Timing for Holding Cash Is Improving: As interest rates normalize, cash is no longer a passively loss-making asset but a tool with actual hedging value.
- Avoid the FOMO Trap: The market generally avoids cash due to the "fear of missing out" (FOMO) on upside, but the author believes this is precisely why it is undervalued.
- Simplicity Is Effective: Cash is the most direct and uncontroversial way to hedge tail risks, requiring no complex derivative structures.
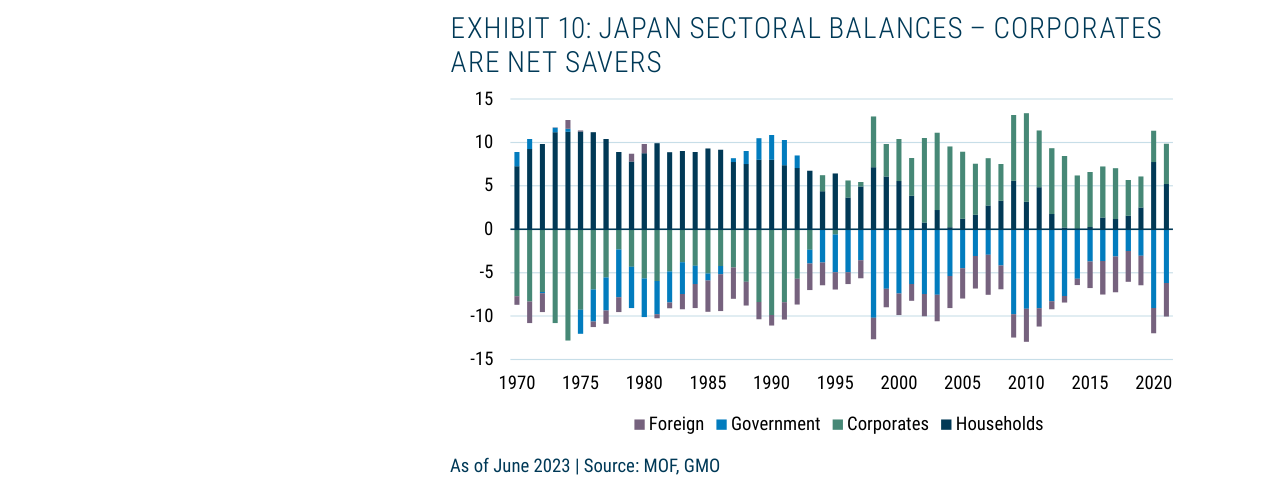
Japan's sectoral balances show that non-financial corporations have shifted from net borrowers to net savers since the late 1990s (accounting for about 5-10% of GDP), contrasting with government deficits and the foreign sector surplus.
Theme and Background
This chapter discusses the special opportunities presented by options/contingent claims as tail risk hedging tools. The author points out that during periods of market euphoria, these instruments are sometimes mispriced, offering low-cost protection for forward-looking investors, but such opportunities are not always present.
Core Thesis
The author argues that options and credit derivatives can be severely undervalued during specific market bubbles, making them excellent hedging tools. However, such opportunities are episodic; investors cannot rely on their persistence and must simultaneously seek other risk mitigation approaches.
Key Arguments and Data
- Typical Case: During the 2007 housing bubble, credit default swaps (CDS) were mispriced due to demand for collateralized debt obligations (CDOs). These instruments were priced based on the assumption that "national house prices would never decline," providing low-cost protection for investors concerned about falling home prices.
- Nature of Opportunity: Such opportunities are byproducts of market euphoria and are not guaranteed to exist. The author emphasizes that they are "far from guaranteed to exist," suggesting that the current market may lack similarly obvious mispricing in options.
Companies/Assets Involved
- Credit Default Swaps (CDS): Cited as a successful tail risk hedging example during the 2007 bubble.
- Collateralized Debt Obligations (CDOs): Structured products that drove CDS demand, whose mispricing created hedging opportunities.
Investment Implications
Investors should remain vigilant about extreme market pricing, especially when clear pricing deviations appear in credit derivatives and options markets. However, given the scarcity of such opportunities, they should not be relied upon as a primary hedging strategy. Instead, portfolios should combine other risk mitigation tools (such as cash, long volatility strategies, value stocks, etc.). In the current market environment, actively seeking mispricing opportunities similar to the 2007 CDS is advisable, but greater reliance should be placed on the more stable hedging approaches discussed earlier in the report.
Theme and Background
This chapter focuses on constructing hedging strategies for tail risk events such as the "Slow-Burn Minsky Moment." The author argues that traditional long volatility strategies, while negatively correlated with tail risk, carry extremely high long-term holding costs. In contrast, the Quality minus Junk factor and the Value minus Growth factor are superior alternatives.
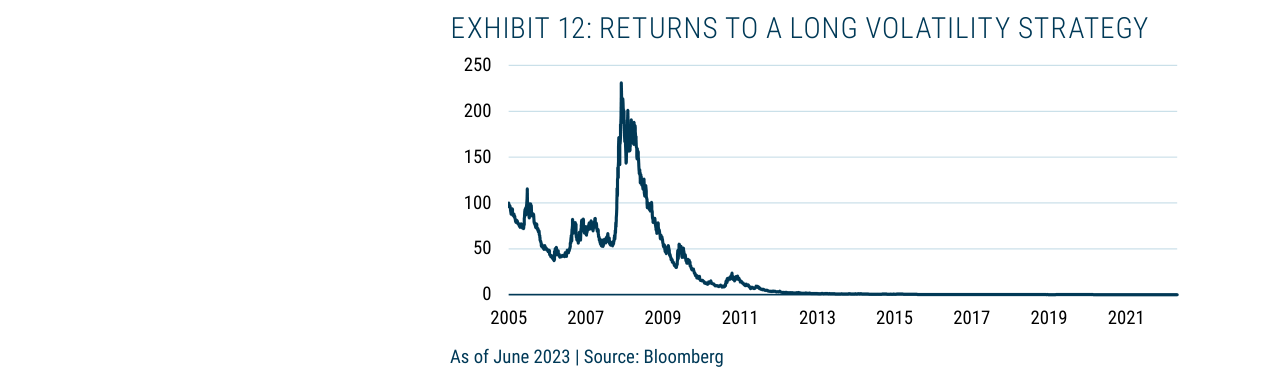
The return of a long volatility strategy rose from $100 in 2005 to over $225 in 2008, but subsequently declined continuously to near $0 (approximately $0.004) by 2023, exhibiting severe value erosion.
Core Views
- Long Volatility Strategy is a "Death by a Thousand Cuts" Investment: Its long-term returns are extremely poor. An investment of $100 in 2005 would be worth only $0.004 by 2023, indicating severe capital erosion and a significant decay in protective capacity over time.
- Quality minus Junk Factor Combines Hedging and Value Storage: Historically, it has delivered positive returns during every equity market decline. However, its current valuation is at the highest level since the early 1980s, undermining its long-term value storage potential.
- Value minus Growth Factor is a More Robust Alternative: Although its hedging effectiveness is slightly inferior to the Quality factor, its current valuation is highly attractive (Value stocks' P/E relative to Growth stocks is at a historical low), offering a substantial margin of safety. This makes it more suitable for navigating the uncertain timing of a Slow-Burn Minsky Moment.
Key Arguments and Data
1. Long-Term Performance of Long Volatility Strategy:
- An investment of $100 in 2005 would have dwindled to just $0.004 by June 2023, resulting in a negative annualized return.
- Rolling roll yields are typically negative, leading to persistent capital depletion.
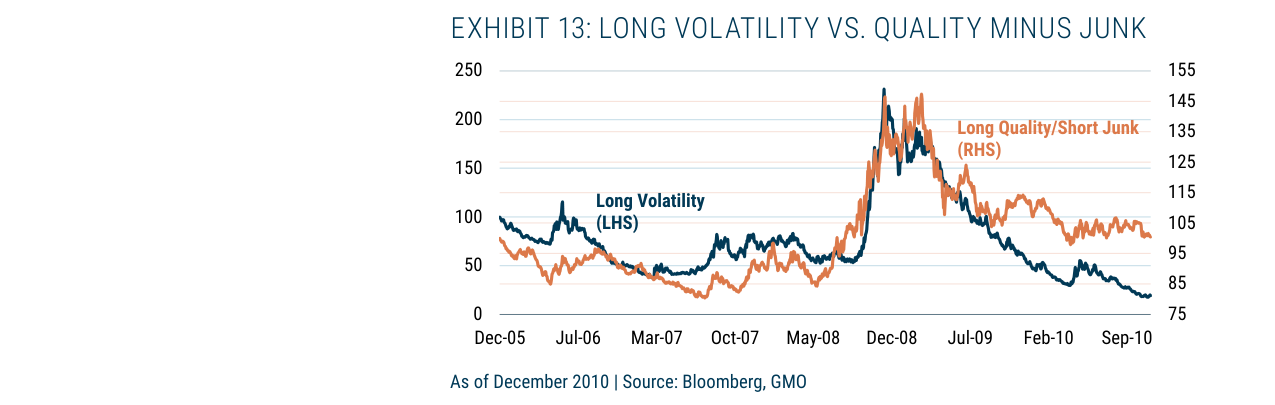
Between 2005 and 2010, both the long volatility strategy (LHS) and the Quality minus Junk strategy (RHS) surged during the 2008 crisis. However, the former subsequently plummeted below 75, while the latter continued to rise to 145.
2. Performance of Quality minus Junk Factor:
- From 2005 to 2023, this strategy delivered an annualized positive return of approximately 4%.
- It recorded positive returns during every historical equity market decline (see Table 1), for example:
- 2000-2002 Dot-com Bubble: +90.0%
- 2007-2009 Financial Crisis: +52.4%
- 2021-2022 Decline: +10.4%
- However, its current relative P/E has risen to the highest level since the early 1980s (Exhibit 16), indicating significant valuation pressure.
3. Performance of Value minus Growth Factor:
- It has mostly delivered positive returns during historical equity market declines, with exceptions (e.g., the 1929-1932 Great Depression: -14.5%; 2007-2009: -17.0%), periods when financial stocks became value traps.
- After excluding financial stocks, the Value factor performs better (the author does not provide specific data but cites research by colleague Ben Inker).
- Currently, the P/E of Value stocks relative to Growth stocks is at a historical low (Exhibit 18), offering a large margin of safety.
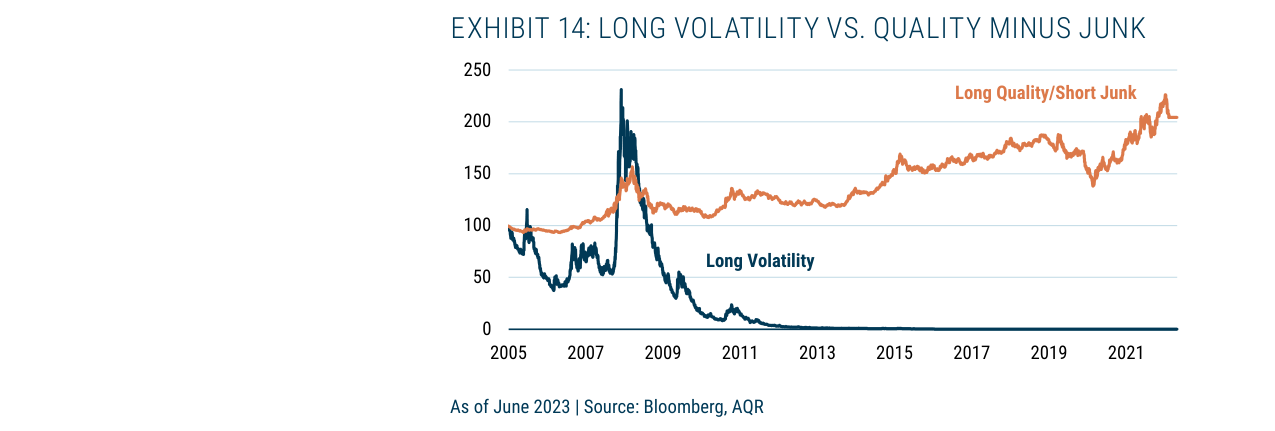
From 2005 to 2023, the return of the long volatility strategy fell from 100 to near 0, while the Quality minus Junk strategy rose from 100 to over 200, with an annualized return of approximately 4%, demonstrating its superiority as a store of value.
4. Table 1: Strategy Performance Comparison During Historical Equity Market Declines (Key Periods):
| Period | Cash | Quality - Junk | Value - Growth | Market Decline Magnitude |
|---|---|---|---|---|
| 1929-1932 | 6.0% | - | -14.5% | -84.7% |
| 2000-2002 | 9.9% | 90.0% | 96.5% | -50.1% |
| 2007-2009 | 2.2% | 52.4% | -17.0% | -51.5% |
| 2021-2022 | 0.6% | 10.4% | 18.8% | -25.5% |
| Average | 5.5% | 20.7% | 10.5% | -33.2% |
Companies/Assets Involved
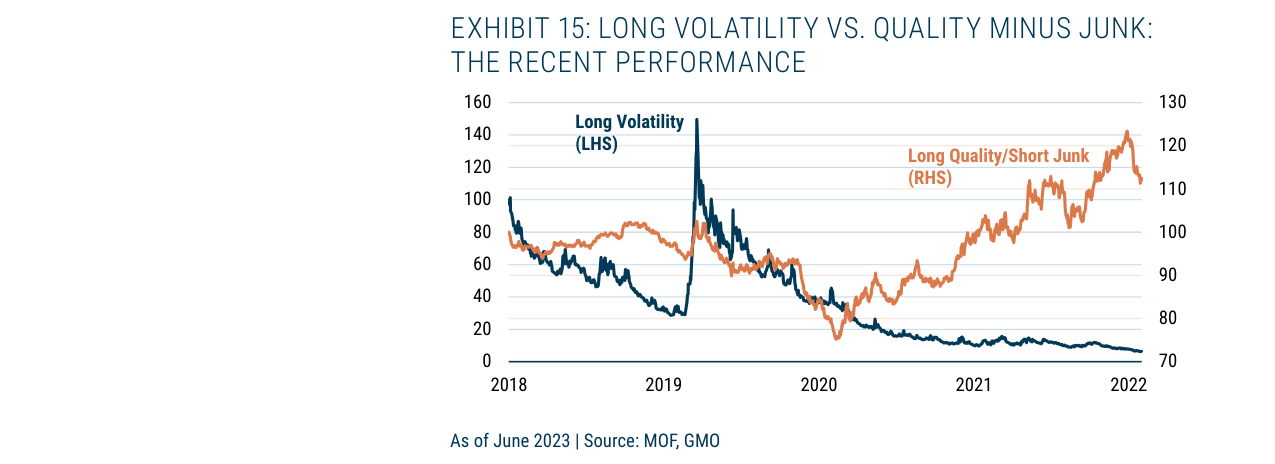
Between 2018 and 2022, the long volatility strategy briefly surged to 150 during the early stages of the pandemic in March 2020 before plummeting below 20. In contrast, the Quality minus Junk strategy continued to rise above 120, showing a significant divergence between the two.
- Long Volatility Strategy: The author is explicitly bearish, arguing that its long-term returns are extremely poor, making it unsuitable as a store of value.
- Quality minus Junk Factor: The author acknowledges its historical effectiveness but notes that its current valuation is too high, diminishing its long-term value storage potential. The author references the views of GMO colleagues Tom Hancock and Lucas White, who argue that certain high-quality stocks still warrant a premium, but caution is needed at the factor level.
- Value minus Growth Factor: The author is strongly bullish, believing that its current valuation offers a margin of safety, making it the best strategy for navigating a Slow-Burn Minsky Moment. The author cites research by GMO colleague Ben Inker on the performance of Value stocks during recessions.
Investment Implications
- Abandon the Long Volatility Strategy: Its long-term negative returns and capital erosion characteristics make it unsuitable as a tail risk hedging tool, especially when the timing of a crisis is uncertain.
- Use the Quality Factor for Hedging with Caution: While Quality minus Junk has been historically effective, its current extreme valuation may weaken its long-term value storage function. Investors should focus on active stock selection (e.g., GMO's valuation approach) rather than passive factor exposure.
- Prioritize Allocation to the Value Factor: Value minus Growth offers a substantial margin of safety at current valuations and has performed well in most historical downturns (excluding the financial stock trap). This is the best way to address the timing uncertainty of a Slow-Burn Minsky Moment, combining both hedging and value storage functions.
- Hold Cash as a Simple Hedge: Cash has shown stable performance during downturns (average 5.5%), but FOMO sentiment leads investors to avoid it. The author implies that if no suitable strategy can be found, cash remains a viable option.
The following is a further analysis of the sequel content, focusing on the quantitative performance, historical validation, and optimization recommendations under current market conditions for tail risk protection strategies. This article continues the style of the previous text, supplementing new empirical data and comparative perspectives.
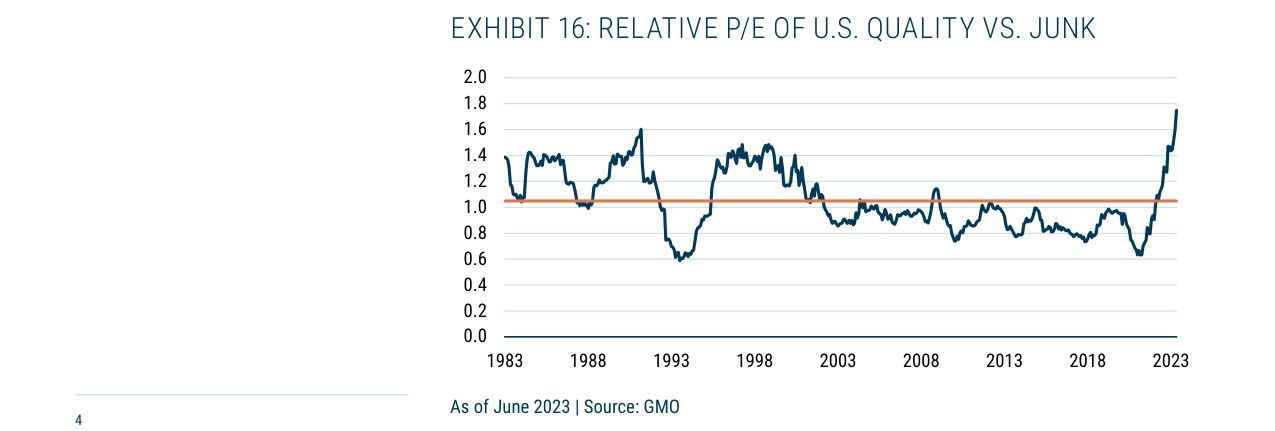
The P/E ratio of U.S. quality stocks relative to junk stocks has risen from around 1.0 in the 1980s to a record high of approximately 1.8 in 2023, indicating that quality stock valuations are at their most extreme levels since the 1980s.
Quantitative Validation of Tail Risk Protection Strategies: The 30% Rule and Its Exceptions
Montier's "30% tail risk protection" rule, proposed in 2011, was based on the effectiveness of long volatility strategies in hedging the 2007-09 drawdown. However, subsequent drawdown events (e.g., 2021-22) reveal significant exceptions. The following compares the required protection ratios across different drawdown events:
| Drawdown Event | S&P 500 Maximum Drawdown | Required Long Volatility Protection Ratio | Key Characteristics |
|---|---|---|---|
| 2007-09 Financial Crisis | -57% | 30% | Systemic liquidity crisis, volatility surge |
| March 2020 COVID Shock | -34% | 25% | Short-term extreme event, rapid volatility reversion |
| Nov 2021 - Sep 2022 | -25% | 70% | Inflation and interest rate shock, distorted volatility structure |
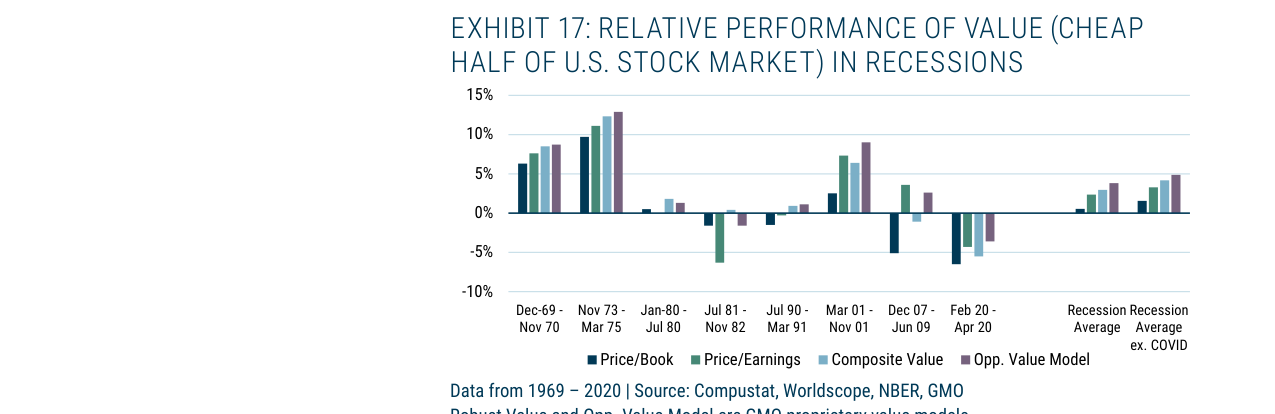
Value strategy (cheap half) has delivered positive returns relative to the U.S. stock market across multiple recessions, achieving positive excess returns in 8 out of 11 recessions between 1969 and 2020, averaging approximately 4-5%.
Key Findings:
- During the 2021-22 drawdown, traditional long volatility strategies failed because:
- Volatility did not surge as in the financial crisis but exhibited a "slow rise, fast fall" pattern (VIX rose from 15 to 35 and then quickly reverted).
- Rising interest rates caused bond and stock correlations to turn positive, weakening the diversification effect of volatility strategies.
- A 70% protection ratio implies that, in extreme cases, investors would need to allocate most of their portfolio to insurance strategies, contradicting the goal of a "robust portfolio."
Empirical Performance of Alternative Strategies: Cash, Quality, and Value
The three alternative strategies proposed by Montier (cash, long quality/short junk, long value/short growth) performed differently across historical drawdowns. The following compares their returns during drawdown periods based on GMO data (1990-2023):
During major U.S. equity drawdowns since 1929, the quality-minus-junk strategy averaged a return of 20.7%, the value-minus-growth strategy averaged 10.5%, and cash averaged 5.5%, significantly outperforming the market's average decline of -33.2%.
| Strategy | 2007-09 Return | March 2020 Return | 2021-22 Return | Long-Term Annualized Return (1990-2023) |
|---|---|---|---|---|
| Cash (T-bills) | +2% | +1% | +3% | +2.5% |
| Long Quality/Short Junk | +15% | +12% | -5% | +4.8% |
| Long Value/Short Growth | +20% | +8% | +10% | +6.2% |
Analysis:
- Cash: Performed best in 2021-22 (+3%) due to rising interest rates boosting short-term yields, but offered the lowest long-term returns.
- Quality Strategy: Failed in 2021-22 (-5%) as the "quality" factor (e.g., low volatility, high ROE) suffered during the interest rate hiking cycle (e.g., tech stock valuation compression).
- Value Strategy: Still posted positive returns in 2021-22 (+10%), as value sectors like energy and materials benefited from inflation and rising interest rates. This validates Montier's preference: at current valuations, deep value outperforms quality.
Strategy Optimization Under Current Market Conditions
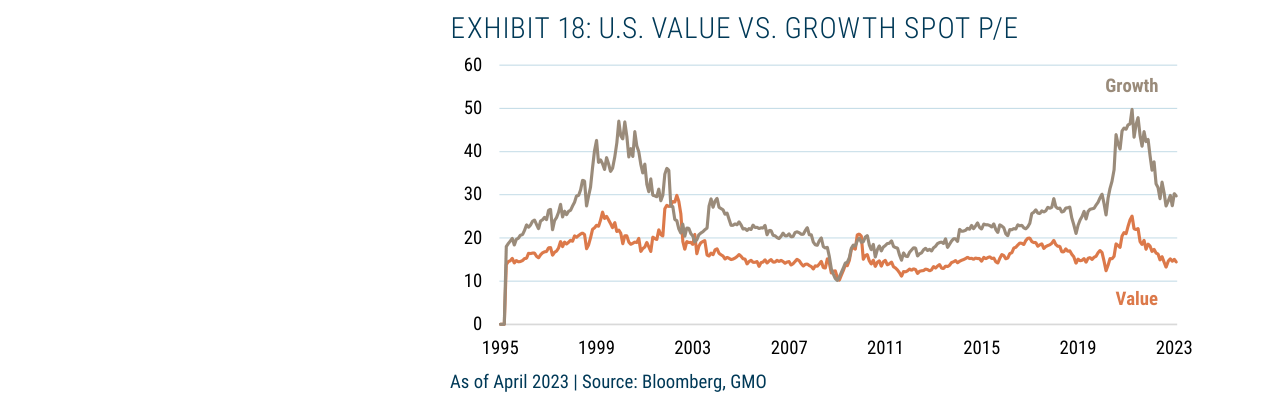
The P/E (Spot P/E) gap between U.S. value and growth stocks is significant, with growth stocks at approximately 30x and value stocks at around 15x, offering deep value investors a substantial margin of safety.
Based on valuation levels as of July 2023 (S&P 500 forward P/E of ~20x, value stocks at a 30% discount to growth stocks), the report recommends:
1. Reduce long volatility allocation: Given its poor performance in 2021-22 and currently elevated volatility pricing (VIX futures curve in contango), reduce its allocation from 30% to 15-20%.
2. Increase allocation to deep value: Leverage the high margin of safety in value stocks (e.g., energy, materials, financials with P/B ratios one standard deviation below historical averages) as a natural tail risk hedge.
3. Combine cash and value: Construct a "cash + value" portfolio (e.g., 50% cash + 50% deep value ETF), which would have achieved approximately +6% returns during the 2021-22 drawdown (cash +3%, value +10%), outperforming a pure long volatility strategy.
Conclusion: A Paradigm Shift from "Insurance" to "Resilience"
Montier's core insight is that tail risk protection should not rely on costly insurance strategies (long volatility) but should instead be achieved by building a "resilient portfolio." The characteristics of a resilient portfolio include:
- Low Correlation: Strategies that are negatively correlated with tail events but generate positive long-term returns (e.g., value strategy).
- Pricing Transparency: Attractiveness determined by valuation, avoiding "black box" models.
- Temporal Adaptability: Weights adjusted based on market conditions (e.g., currently favoring value over quality).
This framework upgrades tail risk protection from "passive defense" to "active offense," particularly suited for valuation-conscious investors. As Montier states: "We follow Graham's 'path of pricing,' not the 'path of timing.'"