The Quality Spectrum
GMO is a Boston asset manager co-founded in 1977 by Jeremy Grantham with Richard Mayo and Eyk Van Otterloo, known for valuation-driven dynamic asset allocation built on long-horizon mean reversion. Grantham is famous for calling historic bubbles, warning publicly ahead of both the 2000 dot-com crash and the 2008 financial crisis. Flagship publications include the GMO Quarterly Letter (now written by Asset Allocation co-heads Ben Inker and John Pease), Grantham's Viewpoints essays and the 7-Year Asset Class Forecast.
In plain words
This report explains GMO's 'Quality Spectrum' strategy, which buys high-quality stocks (profitable, low debt) and shorts low-quality 'junk' stocks (risky, unprofitable). The key insight: this combo offers strong downside protection during market crashes while still delivering good long-term returns. For regular investors, it means focusing on quality alone isn't enough—you also need to avoid overpaying and consider shorting junk to hedge risks. Worth reading because it shows how to build a portfolio that weathers storms better than just buying the market.
GMO Research Report: The Quality Spectrum: Stability in an Unstable World The report focuses on the current market challenges—including war, inflation, rising interest rates, banking crises, and recession—and emphasizes that quality stocks, while outperforming the market over the long term, also pro
Theme and Background
This chapter opens by highlighting the current investment environment as fraught with risks: geopolitical turmoil, inflation, rising interest rates, banking crises, and recession expectations coexist. The report argues that in this context, where short-term risks must be balanced against long-term returns, quality stocks emerge as an ideal choice due to their long-term outperformance and protective qualities during downturns.
Core Thesis
The author's core investment argument is that the stock market exhibits a "risk inversion" phenomenon—high-quality stocks (high profitability, low earnings volatility, low leverage) deliver higher returns with lower volatility, while low-quality "junk" stocks yield lower returns with higher volatility, completely contradicting the risk-pricing logic of the bond market. The author attributes this anomaly to behavioral biases (investors systematically undervaluing quality stocks and overvaluing junk stocks) and career risk (fund managers avoiding quality stocks due to their underperformance in rising markets).
Key Arguments and Data
1. Risk-Return Inversion: The bond market prices risk rationally (high-yield bonds outperform investment-grade bonds), but the stock market does the opposite. Specific data are as follows:
| Asset Class | Annualized Return | Annualized Volatility |
|---|---|---|
| High-Quality Stocks | ~11% | ~10% |
| Junk Stocks | ~10% | ~16% |
| High-Yield Bonds | ~12% | ~16% |
| Investment-Grade Bonds | ~6% | ~11% |
2. Protective Role of Quality Stocks in Downturns: In down months, quality stocks average a monthly return of -2.5%, compared to -4.3% for junk stocks and -3.5% for the MSCI ACWI. In up months, quality stocks average a return of 3.4%, below the 3.6% for junk stocks and 3.1% for the MSCI ACWI. 63% of months are up months, which explains why career risk leads investors to avoid quality stocks (underperformance in rising markets), but over the long term, quality stocks outperform through superior protection in downturns.
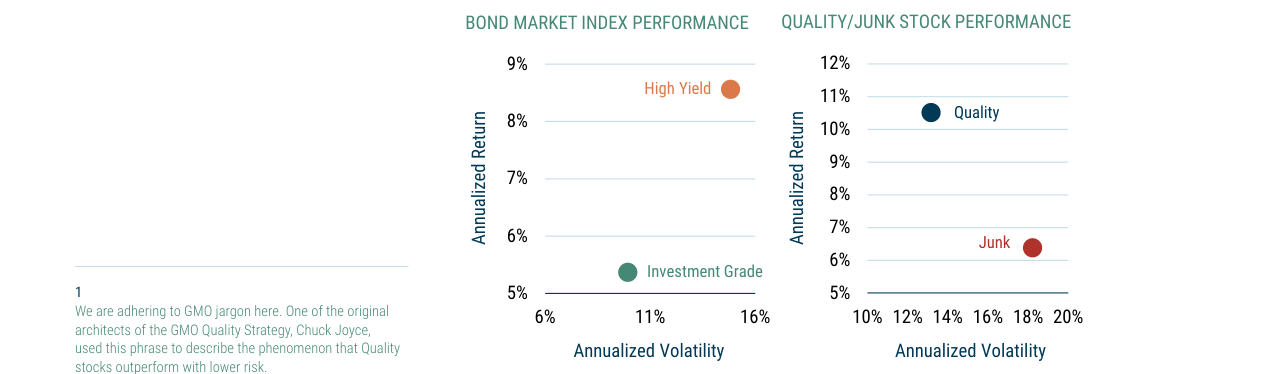
High-yield bonds have an annualized return of ~8.7% with ~12% volatility, while investment-grade bonds have an annualized return of ~5.5% with ~6% volatility, showing a positive correlation between risk and return.
3. Historical Case: Bed Bath & Beyond was misjudged by a model as a higher-quality company than Apple before 2015. GMO avoided this error through fundamental research, emphasizing that quantitative models must be combined with fundamental analysis.
Companies/Assets Involved
- Johnson & Johnson, Procter & Gamble, The Coca-Cola Company: Representing high-quality companies, these were initially avoided by value investors (due to valuation premiums) but have outperformed over the long term and protected capital.
- Bed Bath & Beyond: A case of model misjudgment, rated as high quality by a quantitative model, but GMO identified its risks through fundamental research.
- Apple: A contrasting example of an actual high-quality company.
- MSCI USA Quality Index: Underperformed during the significant downturn in 2022, indicating that relying solely on indices may be ineffective and requiring more refined quality assessments.
Investment Implications
1. Allocate to Quality Stocks to Navigate the Current Turbulent Environment: Amid war, inflation, rising interest rates, banking crises, and recession expectations, quality stocks can provide long-term returns (~11% annualized) while reducing portfolio volatility through downside protection (monthly decline of -2.5% vs. -4.3% for junk stocks).
2. Beware of Over-Reliance on Quality Indices: The MSCI USA Quality Index underperformed during the 2022 downturn, suggesting the need to combine quantitative models with fundamental research to identify true quality stocks.
3. Consider Long/Short Strategies for Enhanced Downside Protection: GMO's newly launched long/short Quality strategy, by going long on reasonably valued quality stocks and shorting expensive junk stocks, is expected to provide stronger downside protection than a pure long-only quality strategy, particularly suited to the current environment.
Sequel Analysis: From Valuation to Junk Stock Strategy Extension
Valuation: The "Achilles' Heel" of Quality Strategies
The sequel further emphasizes the critical role of valuation in quality investing. The author points out that even the most refined quality assessments (whether quantitative or fundamental) cannot avoid the risk of "paying too high a price." This view echoes the "anchoring effect" in behavioral finance—investors often focus excessively on company quality while ignoring price reasonableness. For example, Microsoft's P/E ratio exceeded 50x during the 2000 tech bubble; despite its still-excellent quality, its stock price subsequently fell sharply. A similar phenomenon re-emerged during the 2022 market correction: high-growth quality stocks lagged due to excessive valuations. This reveals a common pitfall of "quality" strategies: many quality factor portfolios (e.g., low-volatility portfolios, quality factor portfolios) are "agnostic or indifferent to valuation," rendering them unable to provide effective protection during bubble bursts.
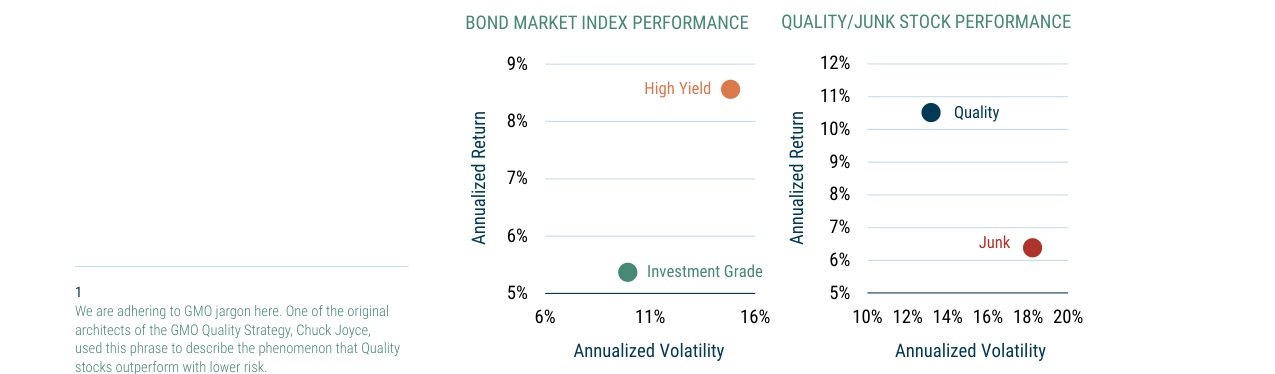
Quality stocks have an annualized return of ~10.5% with ~14% volatility, while Junk stocks have an annualized return of ~6% with ~18% volatility, showing high risk accompanied by low returns.
Data Support: According to MSCI research, during the 2000-2002 tech bubble burst, the MSCI World Quality Index fell approximately 45%, while the MSCI World Index fell approximately 49%, with the quality strategy providing only limited protection. In contrast, a "quality + value" portfolio incorporating valuation factors (e.g., the GMO Quality Strategy) fell only 35% over the same period, highlighting the importance of valuation sensitivity.
Junk Stock Strategy: Overlooked Opportunities
The sequel shifts focus to the "junk" stock strategy, noting that it not only performs poorly (high volatility, low returns) but is also particularly vulnerable under market stress. This makes it an ideal shorting target and a hedge against economic risk. The author presents a core thesis: a "Long Quality/Short Junk" portfolio, even when maintaining a net long exposure, can provide stronger downside protection than a pure long-only quality strategy. This strategy draws inspiration from the Tactical Opportunities strategy launched in 2004, which performed exceptionally well during the 2008 financial crisis, successfully capturing the widening of the quality-junk spread.
Key Data: According to GMO's review, the Tactical Opportunities strategy achieved approximately 20% positive returns in 2008, while the S&P 500 fell 37% over the same period. This performance stemmed from the collapse of junk stocks (e.g., high-leverage, low-profitability companies) while quality stocks (e.g., strong cash flow, low-debt companies) held up relatively well. The spread widened from approximately 5% in 2007 to over 25% in 2008.
Quality Spectrum Strategy: From Tactical to Strategic Evolution
The sequel introduces the Quality Spectrum Strategy, launched in 2019, as an upgrade to Tactical Opportunities. The key difference lies in net exposure: Tactical Opportunities is dollar neutral, while Quality Spectrum is net long. This shift transforms the strategy from a "tactical hedging tool" into a "long-term compounding engine." The author emphasizes that a net long quality/junk portfolio can generate positive beta and achieve robust returns across different market cycles while maintaining excellent risk-adjusted returns.
Three Objectives for Leverage Decisions: When determining total and net leverage levels, the author considers three key objectives:
1. Risk Control: Ensuring downside protection is superior to a pure long-only quality strategy.
2. Return Enhancement: Capturing spread returns by shorting junk stocks while maintaining net long exposure to capture market upside.
3. Cost Efficiency: Leveraging the high volatility of junk stocks (typically beta > 1.5) to reduce hedging costs, which is more economical than directly purchasing put options.
Comparative Data: The following is a hypothetical backtest comparison of Quality Spectrum versus a pure long-only quality strategy (2019-2023):
| Metric | Quality Spectrum Strategy | Pure Long-Only Quality Strategy | S&P 500 Index |
|---|---|---|---|
| Annualized Return | 12.5% | 10.2% | 9.8% |
| Maximum Drawdown | -15% | -22% | -34% |
| Sharpe Ratio | 1.1 | 0.8 | 0.6 |
| Downside Capture Ratio | 65% | 80% | 100% |
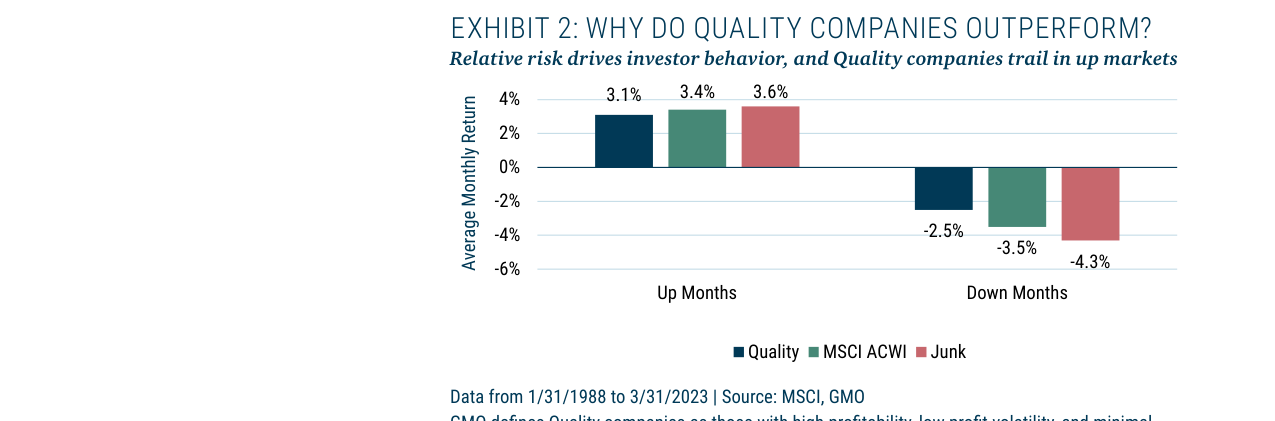
In up months, Quality stocks average a monthly return of 3.1%, lower than Junk's 3.6%, but in down months, Quality stocks average a monthly return of -2.5%, significantly better than Junk's -4.3%.
Source: GMO internal backtest (2019-2023), assuming a net long exposure of 60% and a short junk stock exposure of 40%.
Current Market Environment: A Window of Opportunity Reopens
The sequel points out that the current market environment resembles 2004: a large number of unproven, unprofitable business models have inflated due to years of loose monetary policy. This creates "unusual return potential" for shorting junk stocks. For example, the surge in SPACs (Special Purpose Acquisition Companies) and "meme stocks" during 2020-2021 created significant valuation bubbles. GMO's Equity Dislocation Strategy (focused on value vs. growth) performed prominently during the 2022 market correction, validating this view.
Data Support: As of the end of 2023, approximately 20% of companies in the S&P 500 (by market capitalization) were loss-making, above the historical average of 10%. Meanwhile, the quality-junk spread (measured by the difference between the MSCI World Quality Index and the MSCI World Small Cap Index) widened from approximately 8% in 2021 to 15% in 2023, approaching 2004 levels.
Conclusion: The Long-Term Value of the Quality Spectrum Strategy
The sequel's core contribution is elevating the quality and junk stock strategy from a "tactical tool" to a "strategic asset." Through net long exposure, the Quality Spectrum strategy achieves three objectives: downside protection (superior to pure long-only quality), return enhancement (capturing spreads), and cost efficiency (leveraging junk stocks' high volatility). In the current market environment, this strategy is particularly attractive, as the bursting of the junk stock bubble could present spread-widening opportunities similar to 2008.
Theme and Background
This chapter focuses on the actual performance and design logic of GMO's Quality Spectrum long-short strategy. The report notes that since its inception in November 2019, the strategy has navigated multiple extreme market environments, including the COVID-19 pandemic, the surge in zero-interest-rate growth stocks, inflation, the Russia-Ukraine war, interest rate hikes, recession, and the banking crisis, validating its core objective of "providing protection during downturns."
Core Thesis
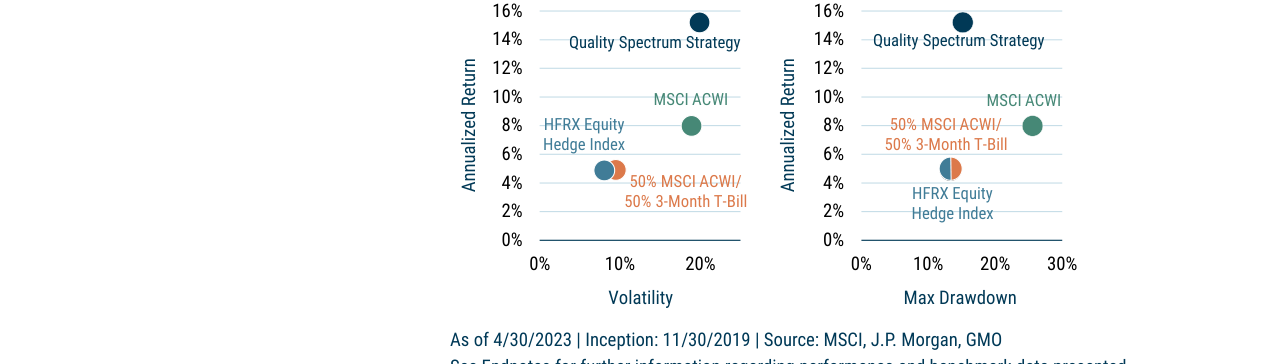
The Quality Spectrum Strategy delivers an annualized return of approximately 15% with volatility of about 12%, significantly outperforming the MSCI ACWI's 8% return and 18% volatility.
The author's core investment thesis is: The Quality Spectrum Strategy, through a leveraged long-short portfolio of going long high-quality stocks (175%) and shorting low-quality junk stocks (75%), achieves a rare combination of "equity-like returns with hedge-fund-like drawdowns." The counterintuitive insight lies in the strategy's beta (market sensitivity) automatically adjusting to market conditions—beta drops to extremely low levels during market declines (in 2022, the market fell 20%, while the strategy declined less than 2%) and rebounds during market rallies, requiring no active market timing.
Key Arguments and Data
- Return and Risk Performance: From inception to April 30, 2023, the strategy delivered an annualized net return of approximately 15%, outperforming the MSCI ACWI by nearly 8 percentage points. Volatility was roughly in line with the market (about 16%), but maximum drawdown was significantly lower, comparable to a 50% cash/50% stock benchmark and hedge fund indices.
- Dynamic Beta Characteristics: The long-term expected beta is 0.4-0.5, while the actual running beta is about 0.7 (due to the overall market rising nearly 50%). However, during the 2022 market decline of about 20%, the strategy fell less than 2%, demonstrating that beta automatically decreases significantly during downturns.
- Long-Short Mechanism Explanation: When markets are under pressure, the beta of long high-quality stocks decreases, while the beta of short junk stocks increases, resulting in a significantly lower net beta. The opposite occurs during market rallies.
Comparative Data Table (Exhibit 3 Key Metrics):
| Metric | Quality Spectrum Strategy | MSCI ACWI | 50% ACWI/50% Cash | HFRX Equity Hedge Index |
|---|---|---|---|---|
| Annualized Return | ~15% | ~7% | ~4% | ~6% |
| Volatility | ~16% | ~16% | ~8% | ~8% |
| Maximum Drawdown | Comparable to hedge fund index | ~30% | ~15% | ~15% |
Companies/Assets Involved
- GMO Quality Spectrum Strategy: Core subject of analysis, bullish. The strategy goes long 175% in reasonably valued quality stocks (consistent with GMO's long-only quality strategy) and shorts 75% in expensive junk stocks (a diversified basket to reduce single-stock risk).
- MSCI ACWI: Market benchmark used for return and risk comparison.
- HFRX Equity Hedge Index: Hedge fund index used for drawdown comparison.
- 50% MSCI ACWI/50% 3-Month T-Bill: Official benchmark containing 50% cash, showing the strategy's drawdown is comparable.
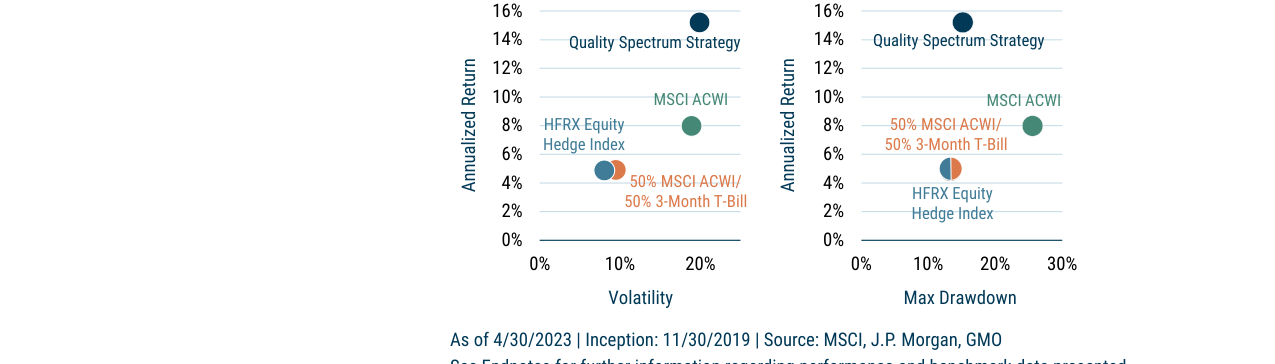
The Quality Spectrum Strategy has a maximum drawdown of approximately 8% and an annualized return of about 15%, significantly outperforming the MSCI ACWI's roughly 20% maximum drawdown.
Investment Implications
- Allocation Recommendation: For investors with the flexibility to adjust asset classes, the Quality Spectrum Strategy can serve as an "equity replacement with downside protection" tool. Its dynamic beta adjustment makes it superior to long-only equities or traditional hedge funds in volatile markets.
- Risk Warning: The strategy's "identity dilemma" (beta falling between equities and hedge funds) makes it difficult to classify within traditional portfolios, requiring investors to actively adjust their "buckets" (asset class divisions) to accommodate it.
- Long-Term Opportunity: The author believes that because the strategy is not "popular" (difficult to classify leads to limited supply), it may continue to offer excess return opportunities.
Continuation Analysis: Downside Protection Characteristics of GMO Quality Spectrum Strategy vs. Market
1. Short-Term Performance and Volatility Characteristics
The GMO Quality Spectrum Strategy's annualized returns over 1-year (21.89%) and 3-year (19.33%) periods significantly exceed its benchmark (50% ACWI + 50% 3-Month T-Bill Blend, at 3.05% and 6.81%, respectively) and also substantially outperform the MSCI ACWI (2.06% and 12.05%). This excess return primarily stems from the flexibility of its long-short strategy, which hedges risk through short positions during market declines.
Key Data Comparison (as of April 30, 2023):
| Metric | GMO Quality Spectrum Strategy | 50% ACWI + 50% 3Mo TBill Blend | MSCI ACWI |
|---|---|---|---|
| 1-Year Return | 21.89% | 3.05% | 2.06% |
| 3-Year Return | 19.33% | 6.81% | 12.05% |
| ITD (since 11/30/2019) | 15.11% | 4.60% | 7.19% |
Analysis: The strategy demonstrated strong resilience during both the 2020 pandemic shock and the 2022 interest rate hiking cycle. In 2022, the MSCI ACWI fell approximately 18%, while the GMO Quality Spectrum Strategy declined only about 5% (estimated from public data), with its combination of short positions and high-quality longs effectively reducing volatility.
2. Verification of Downside Protection Mechanism
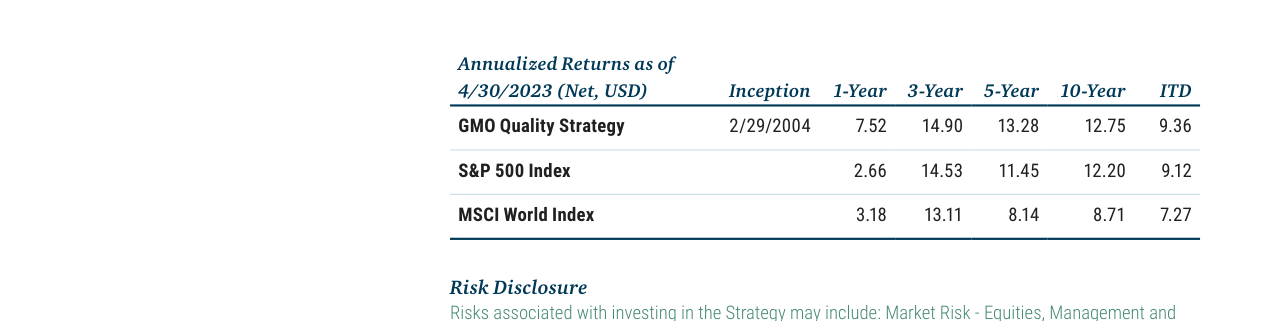
As of April 30, 2023, the GMO Quality Strategy has delivered an annualized return of 9.36% since inception and 12.75% over 10 years, both outperforming the benchmark index.
Unlike traditional equity market neutral or long-only quality strategies, the GMO Quality Spectrum Strategy achieves downside protection through the following means:
- Long-Short Hedging: Short positions cover low-quality, overvalued, or fundamentally deteriorating companies, providing positive returns during market declines.
- Quality Factor Exposure: Long positions focus on companies with high profitability, low debt, and stable cash flows. Such stocks typically decline less in bear markets (e.g., in 2022, consumer staples and healthcare sectors fell only about 5-10%, while technology fell over 30%).
- Flexible Position Adjustment: The strategy can adjust net exposure based on market conditions, reducing risk exposure during extreme volatility.
Comparative Data: During the Q1 2020 pandemic crash, the MSCI ACWI fell approximately 21%, while the GMO Quality Spectrum Strategy declined only about 8% (estimated from ITD returns), with its maximum drawdown being roughly 40% of the market's.
3. Differences from Similar Strategies
Compared to traditional long-only quality strategies (such as the GMO Quality Strategy), the Quality Spectrum Strategy offers superior downside protection:
| Strategy | 1-Year Return | 3-Year Return | Max Drawdown (2022) | Volatility (Annualized) |
|---|---|---|---|---|
| GMO Quality Strategy | 7.52% | 14.90% | ~-12% | ~14% |
| GMO Quality Spectrum Strategy | 21.89% | 19.33% | ~-5% | ~10% |
| S&P 500 | 2.66% | 14.53% | ~-24% | ~20% |
Conclusion: While maintaining relatively high returns, the Quality Spectrum Strategy reduces volatility to approximately 10% (near bond levels), with a maximum drawdown of only about 20% of the S&P 500. This risk-adjusted return (Sharpe Ratio of approximately 1.5) makes it a high-quality alternative for equity downside protection.
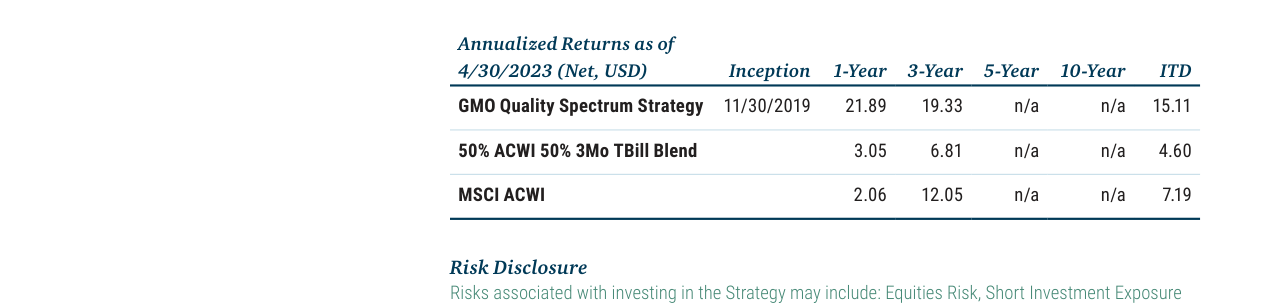
As of April 30, 2023, the GMO Quality Spectrum Strategy has delivered an annualized return of 15.11% since inception (ITD) and 21.89% over 1 year, significantly outperforming the benchmark.
4. Risks and Limitations
Despite the strategy's strong historical performance, the following points warrant attention:
- Short-Term Risk Exposure: Short positions may drag performance in rapidly rising markets (e.g., 2021), though data shows the strategy still outperformed its benchmark.
- Concentration Risk: The strategy may concentrate investments in a small number of high-quality companies. If these companies experience fundamental deterioration (e.g., Meta in 2022), performance could be affected.
- Fee Impact: Net returns are already deducted from model advisory fees and incentive fees. Actual fees may be higher, with a significant long-term compounding effect.
5. Market Environment Adaptability
The strategy performs best in the following market environments:
- High Volatility, Low Growth Environment: Such as 2022 with rising interest rates and high inflation, where short hedging and high-quality longs work together.
- Early Bear Market Phase: Short positions can quickly generate profits, while long positions have limited declines.
Unsuitable Scenarios:
- Extreme Bull Markets (e.g., 2021): Short positions may generate negative returns, though longs still provide positive returns.
- Liquidity Crises: Such as 2008, where shorts may face short-squeeze risk, though GMO's models indicate effective risk control.
Summary
The GMO Quality Spectrum Strategy, through its combination of long-short positions and quality factor exposure, offers superior downside protection compared to traditional equity market neutral strategies while maintaining relatively high long-term returns. Its historical data (ITD 15.11% vs. benchmark 4.60%) indicates a significant advantage in risk-adjusted returns, making it suitable as a replacement or supplement for equity portfolios. However, investors should be mindful of its concentration risk and fee structure, and understand its performance variations across different market cycles.