2Q 2022 GMO Quarterly Letter
GMO is a Boston asset manager co-founded in 1977 by Jeremy Grantham with Richard Mayo and Eyk Van Otterloo, known for valuation-driven dynamic asset allocation built on long-horizon mean reversion. Grantham is famous for calling historic bubbles, warning publicly ahead of both the 2000 dot-com crash and the 2008 financial crisis. Flagship publications include the GMO Quarterly Letter (now written by Asset Allocation co-heads Ben Inker and John Pease), Grantham's Viewpoints essays and the 7-Year Asset Class Forecast.
In plain words
This report says the US dollar is very expensive right now, at a 35-year high, which could hurt US stocks but help European and Japanese stocks. Using historical data, the author shows that countries with cheap currencies (like the euro and yen) tend to have better stock returns in the next few years, while those with expensive currencies (like the dollar) see worse returns. For regular investors, this means it might be smart to reduce US stock holdings and look at Europe and Japan instead, where both stocks and currencies are cheaper. It's worth reading because it explains why global investing isn't just about the US.
GMO's Q2 2022 report notes that the US dollar has recently appreciated significantly, reaching a 35-year high against other major developed currencies. The core argument is that an overvalued dollar negatively impacts the US stock market, while developed markets such as the Eurozone and Japan are ex
Theme and Background
This chapter focuses on the recent sharp appreciation of the U.S. dollar to a 35-year high, exploring its potential impact on global equity markets. The report notes that the dollar's real effective exchange rate is at a level seen only twice in 51 years: below the 1971 peak (end of the Bretton Woods system) and the mid-1980s peak (before the Plaza Accord). The author argues that an overvalued dollar is a negative factor for U.S. equities, while developed markets such as the Eurozone and Japan are expected to benefit from undervalued currencies.
Core Thesis
The author's core investment thesis is that a strong dollar is "America's problem," but more importantly, "the world's problem," particularly potentially bullish for non-U.S. equity markets. The counterintuitive judgment is that while Fed rate hikes make shorting the dollar difficult in the forward market, for equity investors, an overvalued currency is a drag on stocks, while an undervalued currency is a powerful tailwind for developed markets. The report argues that the current combination of cheaper stocks and currencies outside the U.S. provides a favorable backdrop for reversing the decade-long dominance of U.S. equities.
Key Arguments and Data
- Historical Dollar Valuation Comparison: According to the BIS real effective exchange rate model, the dollar's current valuation is only below the two peaks of 1971 and 1985. A further 5% rise would touch the 1985 high.
- G-10 Currency Valuation Disparities: The U.S. dollar, Canadian dollar, Australian dollar, and New Zealand dollar are all overvalued by 17%-13%; the euro and yen are undervalued by 17% and 20%, respectively.
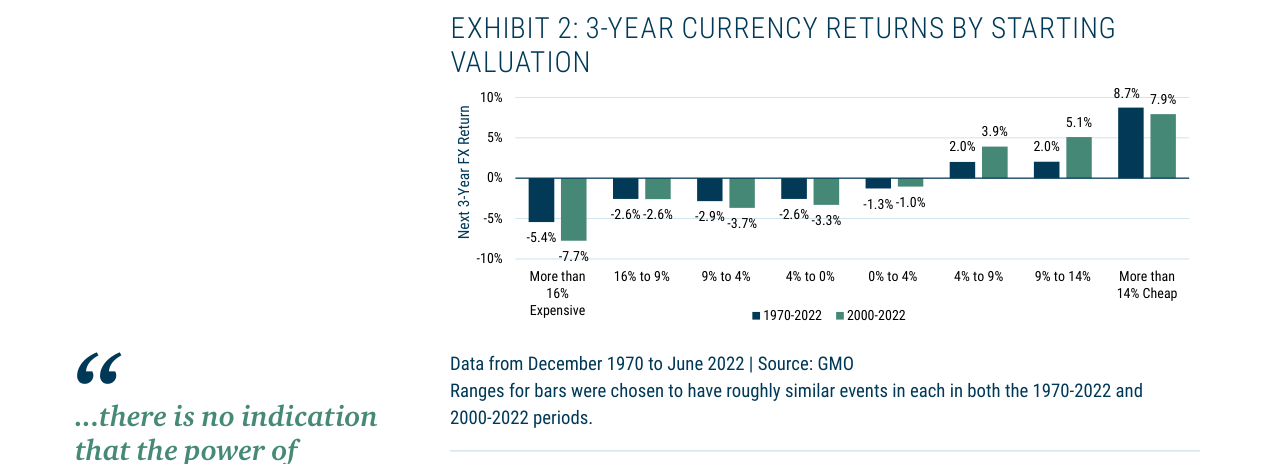
- Historical Predictive Power: Data from 1970-2022 and 2000-2022 both show that starting currency valuation has significant predictive power for subsequent three-year returns. The cheapest currency group (undervalued by over 14%) delivered an average three-year return of approximately 8.7%, while the most expensive group (overvalued by over 16%) returned -7.7%.
G-10 Currency Valuation vs. Subsequent 3-Year Returns (Based on Historical Data)
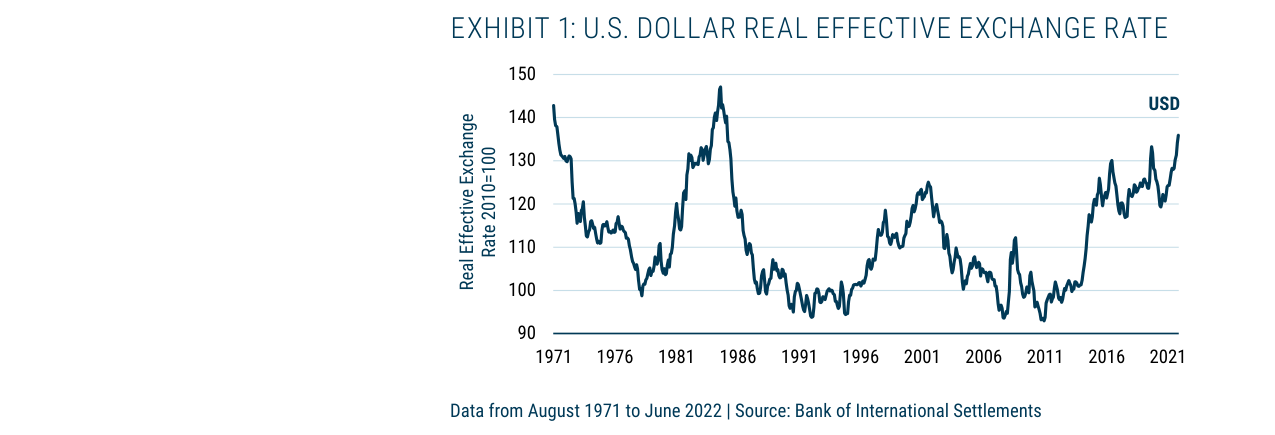
The U.S. Dollar Real Effective Exchange Rate fell from approximately 140 in 1971 to about 135 in 2022, with peaks around 145 in 1985 and 2022.
| Currency Valuation Range | Avg. 3-Year Return (1970-2022) | Avg. 3-Year Return (2000-2022) |
|---|---|---|
| Overvalued > 16% | -7.7% | -5.4% |
| Overvalued 16% to 9% | -3.7% | -2.9% |
| Overvalued 9% to 4% | -3.3% | -2.6% |
| Overvalued 4% to 0% | -1.0% | -1.3% |
| Undervalued 0% to 4% | 2.0% | 2.0% |
| Undervalued 4% to 9% | 3.9% | 5.1% |
| Undervalued 9% to 14% | 7.9% | 2.0% |
| Undervalued > 14% | 8.7% | 10.0% |
Companies/Assets Involved
- United States (USD): Bearish. The overvalued dollar negatively impacts U.S. equity performance, despite short-term interest rate advantages from Fed hikes.
- Eurozone (EUR): Bullish. The euro is undervalued by 17%, and the report believes it stands to benefit from a currency tailwind.
- Japan (JPY): Bullish. The yen is undervalued by 20%, the cheapest G-10 currency. The author's colleague already felt the purchasing power advantage of the dollar during a trip to Tokyo.
- Canada, Australia, New Zealand (CAD, AUD, NZD): Bearish. These currencies, like the dollar, are overvalued and may face similar pressures.
- Emerging Markets: Neutral to Bullish. While policy missteps could diminish the benefits of undervalued currencies, current valuations are attractive enough to potentially support equity markets in the coming years.
G-10 currency valuations show the USD overvalued by 17%, the JPY undervalued by 20%, and the EUR and SEK undervalued by 17%.
Investment Implications
- Reduce U.S. Equity Exposure: Given the historical drag of an overvalued dollar on U.S. stock returns, investors should consider lowering their allocation to U.S. equities.
- Increase Eurozone and Japanese Equity Exposure: The undervalued currencies in these markets provide additional return potential, combining with their relatively cheap equity valuations to create a double positive.
- Be Cautious with Commodity Currency Countries: Countries like Canada and Australia with overvalued currencies may face similar currency headwinds for their equity markets as the U.S.
- Focus on Emerging Markets: Despite policy risks, the valuation appeal of emerging market currencies is sufficient to provide support, allowing for moderate allocation.
Additional Arguments and Data: Differential Impact of Currency Misalignment on Emerging Markets
1. Structural Differences Between Emerging and Developed Markets
Unlike G10 countries, the currency valuation effect in Emerging Markets (EM) is significantly disrupted by the following factors:
- Dollar Debt Burden: Many EM countries have a high proportion of foreign debt denominated in USD. A stronger dollar and local currency depreciation directly increase debt servicing costs (e.g., recent sovereign defaults in Sri Lanka, Lebanon).
- Lack of Commodity Pricing Power: Commodities are mostly priced in USD. Local currency depreciation can trigger imported inflation (e.g., Argentina, Pakistan), weakening the competitive advantage gained from depreciation.
- Institutional Fragility: Some EM economies exhibit "dollarization" (e.g., Zimbabwe, Ecuador). After local currency depreciation, inflation can quickly offset competitiveness gains, rendering the traditional adjustment mechanism of exchange rates ineffective.
From 1970-2022, the group of currencies overvalued by more than 16% had a future 3-year return of -5.4%, while the group undervalued by more than 14% had a return of 8.7%.
2. Emerging Market Sovereign Debt Risk Distribution
Although some countries face high default risk, their actual impact on global portfolios is limited:
| Country/Region | Default Risk Pricing (CDS Implied Probability) | MSCI EM Index Weight | J.P. Morgan EM Debt Index Weight |
|---|---|---|---|
| Sri Lanka | Very High (Already Defaulted) | 0% | <0.5% |
| Lebanon | Very High (Already Defaulted) | 0% | <0.5% |
| Ukraine | High (War Zone) | 0% | <1% |
| Argentina | High (Frequent Historical Defaults) | 0.8% | 1.2% |
| Pakistan | High (Depleted FX Reserves) | 0% | 0.3% |
| Total | - | <1% | <5% |
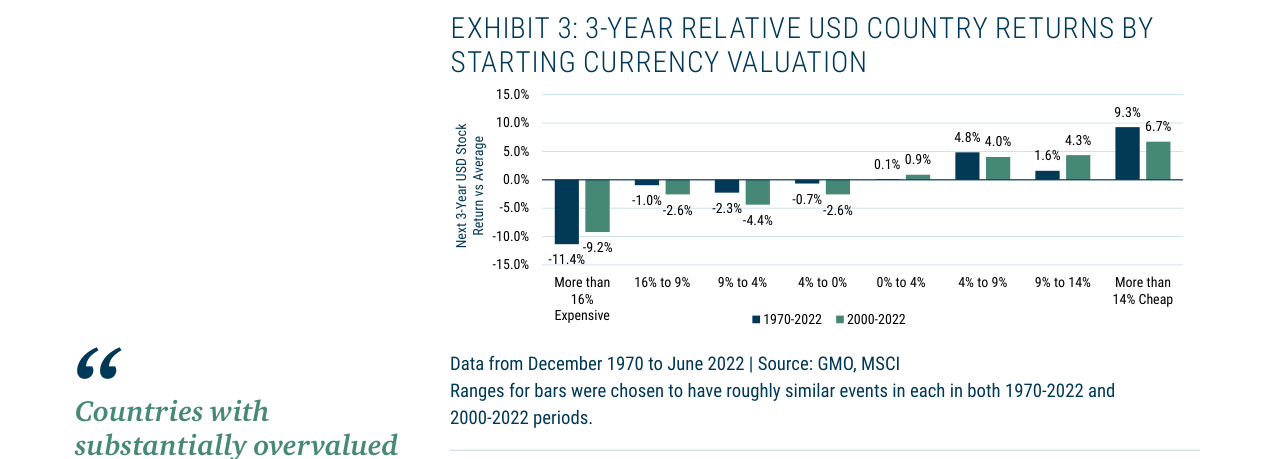
Equity markets in countries with currencies overvalued by more than 16% fell an average of 11.4% relative to the USD over the next 3 years, while those undervalued by more than 14% rose by 9.3%.
Data Sources: GMO, MSCI, J.P. Morgan (as of June 2022).
Key Conclusion: High-risk countries have a negligible weight in mainstream indices. Their crises impact global portfolios more as geopolitical risks than direct financial losses.
3. Challenges of Currency Valuation Models in Emerging Markets
GMO uses an adjusted Balassa-Samuelson effect model (the "Penn effect") to try to eliminate distortions in Purchasing Power Parity (PPP) caused by different development levels. However, the model faces two major limitations:
- Data Quality: Inflation statistics and real exchange rate data for EM suffer from lags and revisions (e.g., deviation between official Turkish inflation and market perception).
- Institutional Heterogeneity: Some countries (e.g., China) have capital controls, meaning exchange rates are not fully market-determined, reducing the model's predictive power.
4. Empirical Comparison: Developed Markets vs. Emerging Markets
Based on data from 1990-2022, the explanatory power of currency valuation for equity returns differs significantly between the two market types:
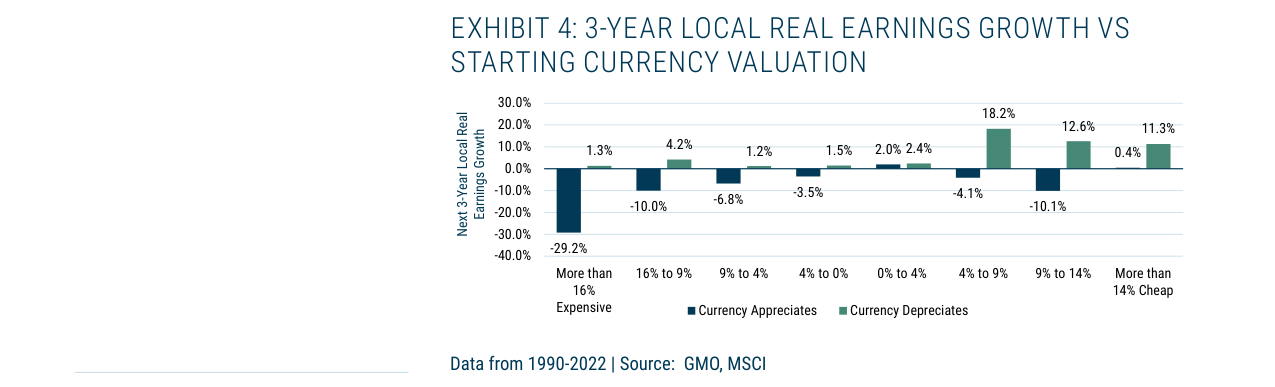
Countries with currencies overvalued by more than 16% and appreciating saw real earnings growth of -29.2%, while those undervalued by more than 14% and depreciating saw growth of 18.2%.
| Metric | Developed Markets (G10) | Emerging Markets (MSCI EM) |
|---|---|---|
| Overvalued Currency → Excess Equity Return | 3-Year Relative Return -11.4% (Most Expensive Group) | No Significant Statistical Relationship (R²<0.1) |
| Undervalued Currency → Excess Equity Return | 3-Year Relative Return +9.3% (Cheapest Group) | Weak Positive Correlation (R²≈0.15) |
| Speed of Mean Reversion for Exchange Rates | ~60% Probability of Reversion within 3 Years | ~40% Probability of Reversion within 3 Years (Affected by Policy Intervention) |
| Pass-Through of Inflation to Currency Depreciation | Low (Inflation Targeting Countries) | High (Inflation Elasticity >0.5 in Some Countries) |
Data Sources: GMO, MSCI, IMF (1990-2022).
Explanation: The currency valuation signal in EM is weakened by institutional deficiencies and inflation pass-through, making it impossible to directly replicate the "two-way profit/loss" pattern of developed markets.
5. Current Special Situation in Emerging Markets
- The "Double-Edged Sword" Effect of a Strong Dollar:
- For Developed Markets (e.g., Eurozone, Japan): Strong Dollar → Undervalued Local Currency → Improved Export Competitiveness → Earnings Growth.
- For Emerging Markets: Strong Dollar → Local Currency Depreciation → External Debt Pressure + Inflation → Damaged Earnings (e.g., Turkey, Chile).
- Exceptions:
- Resource-Based Economies (e.g., Saudi Arabia, Russia): Local currency depreciation may offset some negative effects through petrodollar income.
- Manufacturing Exporters (e.g., Vietnam, Mexico): If local currency depreciates and external debt is low, they can benefit from improved competitiveness (similar to developed market logic).
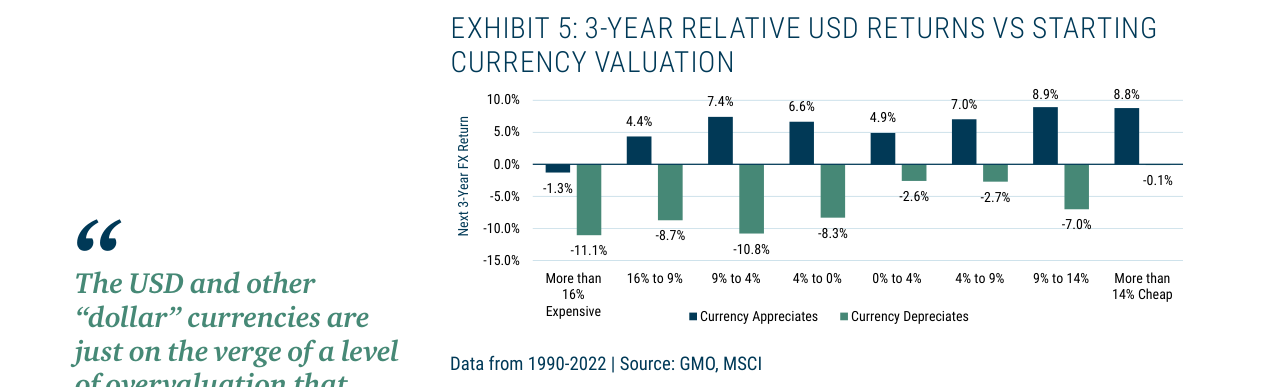
Equity markets in countries with currencies overvalued by more than 16% and appreciating had a relative return of -1.3%, while those undervalued by more than 14% and appreciating had a return of 8.8%.
Core Thesis Supplement
1. Emerging Markets Are Not a Simple Replication of Developed Markets: The predictive power of currency valuation models decreases in EM. They must be adjusted by considering external debt structure, inflation pass-through, and institutional quality.
2. The Current Impact of a Strong Dollar on EM is Limited: High-risk countries have very low weights in indices, making the portfolio impact manageable. However, geopolitical spillovers (e.g., capital flight triggered by debt defaults) warrant caution.
3. Future Research Direction: It is necessary to distinguish between EM with different degrees of "dollarization" and build layered valuation models (e.g., high external debt/low external debt, high inflation/low inflation).
Deep Mechanisms of Currency Valuation and Equity Returns in Emerging Markets
1. The Anomaly of the Turkey Case: Policy Distortion and Signal Noise
The Turkish Lira has depreciated 90% against the USD over the past decade, with a concurrent annual inflation rate of 16.9% (vs. 2.6% in the U.S.). By PPP models, it should be extremely undervalued. However, the Erdogan government's unconventional policies (e.g., cutting rates to fight inflation, capital controls) cast doubt on the credibility of CPI data, and companies have not gained sustained competitiveness from the depreciation. Exhibit 6 shows that excluding Turkey, the 3-year FX return for the cheapest currency group (>19% undervalued) jumps from -11.3% to +5.0%, indicating that Turkey's extreme case severely disrupts the reliability of the valuation signal. This contrasts sharply with developed markets, where policy frameworks are stable and the competitiveness effect of undervalued currencies is more predictable.
2. Key Difference Between EM and DM: Synchrony of Currency and Earnings
Exhibit 8 reveals a strong positive correlation between EM currency valuation and subsequent 3-year real USD earnings growth: the cheapest currency group (>19% undervalued) saw earnings growth of 17.7%, while the most expensive group (>50% overvalued) saw -15.0%. This synchrony stems from the pro-cyclical nature of EM currencies—currencies appreciate and earnings improve when the economy is strong—unlike the independent fluctuations of currencies and earnings in developed markets. While this simplifies analysis (no need to distinguish "appreciating/depreciating" sub-categories as in DM), it also means EM valuation signals are more susceptible to macroeconomic cycle interference.
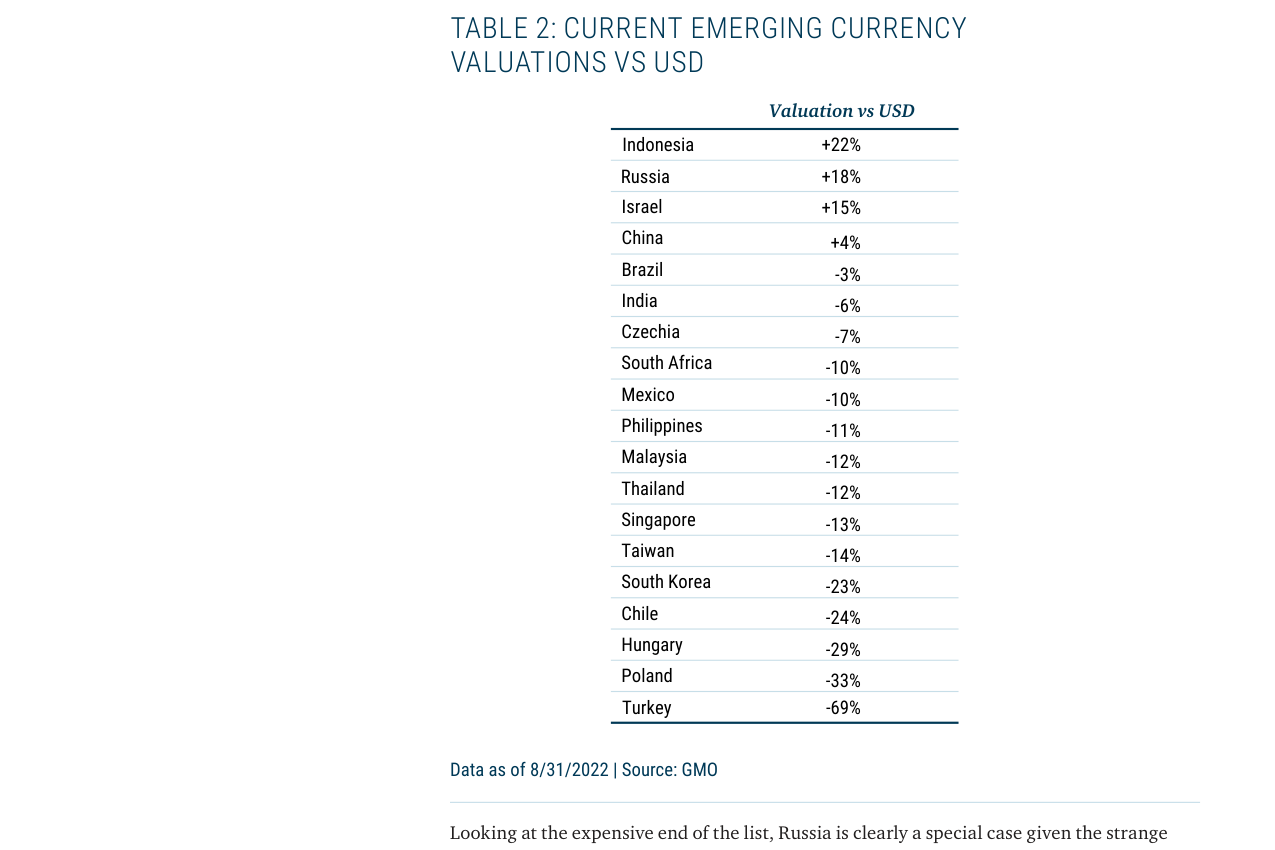
Emerging market currency valuations show the IDR overvalued by 22%, the TRY undervalued by 69%, and the KRW undervalued by 23%.
3. Tail Risk in Extreme Valuation Groups: Sample Selection Bias
Exhibit 7 shows that the cheapest currency group (>19% undervalued) had a 3-year USD equity return of only 0.6% (rising to 4.5% excluding Turkey), far below the 8.9% return of the second-cheapest group (13%-19% undervalued). The author notes the model was built 15 years ago, including only countries with sufficient liquidity at the time (e.g., excluding Argentina, Venezuela). Looking further back, these "extremely undervalued" countries might have led to total losses for equity investors due to policy collapses (e.g., Argentina's 2018 crisis). This suggests the reliability of EM valuation signals decreases significantly in extreme ranges, requiring filtering by political risk and institutional quality.
4. Current Valuation Landscape: Indonesia's Isolated Risk and China's Nuanced Position
Table 2 shows the Indonesian Rupiah is overvalued by 22% against the USD, the only EM currency near a dangerous level. Russia, though overvalued by 18%, has limited reference value due to sanctions distortions. The Chinese Yuan is only overvalued by 4%, in a "slightly expensive" range, but Exhibit 9 shows both China A-shares (CAPE ~15x) and H-shares (~10x) are at low valuations, suggesting a "double cheap" combination of currency and equity could offer excess returns. In contrast, India (-6% undervalued) and Brazil (-3% undervalued) have neutral currency valuations, but their equity market valuations diverge (India CAPE ~25x, Brazil ~10x).
5. Comparative Data: Return Differences Across EM Valuation Groups
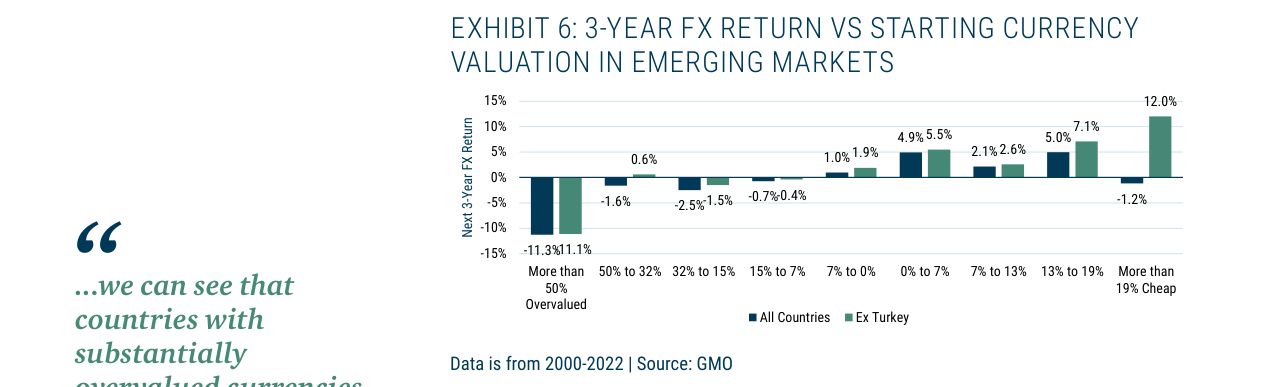
Emerging market currencies overvalued by more than 50% had a future 3-year return of -11.3%, while the group undervalued by more than 19% had a return of 12.0%.
| Currency Valuation Group | 3-Year FX Return (Incl. Turkey) | 3-Year FX Return (Excl. Turkey) | 3-Year USD Equity Return (Incl. Turkey) | 3-Year USD Equity Return (Excl. Turkey) | 3-Year Real Earnings Growth (Incl. Turkey) |
|---|---|---|---|---|---|
| >50% Overvalued | -11.1% | -11.1% | -17.0% | -17.0% | -15.0% |
| 50%-32% Overvalued | -11.3% | -11.3% | -15.3% | -15.3% | -12.1% |
| 32%-15% Overvalued | -2.5% | -2.5% | -4.4% | -4.4% | -5.9% |
| 15%-7% Overvalued | -0.7% | -0.7% | -1.0% | -1.0% | -4.6% |
| 7%-0% Overvalued | -1.2% | -1.2% | -1.1% | -1.1% | -5.4% |
| 0%-7% Undervalued | -1.6% | -1.6% | 0.6% | 0.6% | 1.6% |
| 7%-13% Undervalued | 1.0% | 1.0% | 3.7% | 3.7% | 2.1% |
| 13%-19% Undervalued | 4.9% | 4.9% | 8.9% | 8.9% | 6.4% |
| >19% Undervalued | -11.3% | 5.0% | 0.6% | 4.5% | 17.7% |
Data Source: GMO (2000-2022)
6. Investment Implications: Regional Allocation Opportunities Under a Strong Dollar
The current overall overvaluation of the USD (and developed market "dollars") represents a significant headwind for equity markets. The Eurozone and Japan are the biggest beneficiaries: their undervalued currencies (Euro ~-10%, Yen ~-20%) point to a double positive of local earnings growth and currency appreciation over the next 3 years. Exhibit 9 shows Japan (CAPE ~15x, currency undervalued ~20%) and the Eurozone (CAPE ~18x, currency undervalued ~10%) in the "double cheap" quadrant, while the U.S. (CAPE ~30x, currency overvalued ~10%) is in the "double expensive" quadrant. Within EM, China H-shares (CAPE ~10x, currency overvalued 4%) and South Korea (CAPE ~10x, currency undervalued 23%) offer similar opportunities, but caution is needed regarding Turkey-style policy risks—currently, countries undervalued by more than 20% (South Korea, Chile, Hungary, Poland) have no recent history of currency crises and have not implemented destructive interventionist policies.
Valuation Divergence and Currency Mismatch Within Emerging Markets
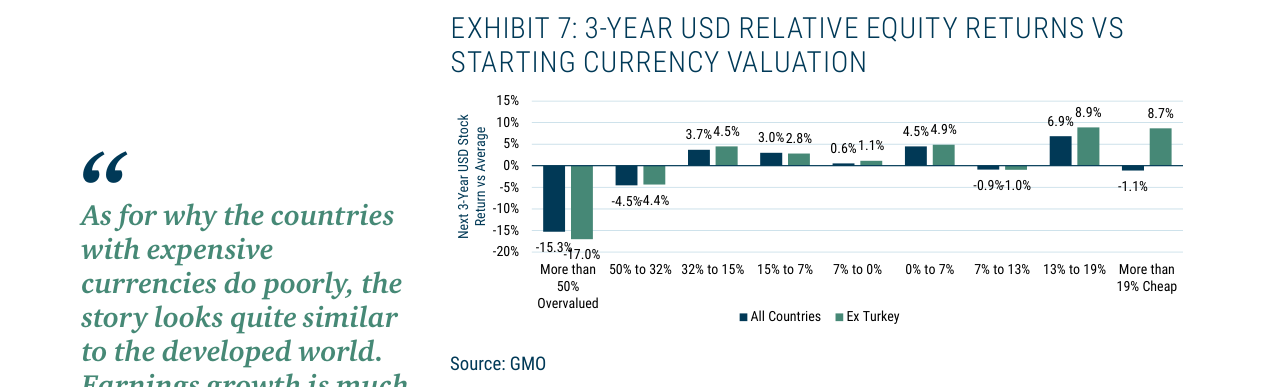
Equity markets in countries with EM currencies overvalued by more than 50% fell 15.3% relative to the USD, while those undervalued by more than 19% rose by 8.7%.
Although EM equities are the cheapest overall in terms of valuation, and EM currencies are "just about average," significant compositional differences between various EM indices lead to structural divergence in actual investment opportunities. According to the original data, the currency basket of the J.P. Morgan GBI Emerging Bond Index is approximately 10% cheaper than the MSCI Emerging Market Equity Index. This means EM bond currencies are closer to the "extremely undervalued" range (e.g., South Korea's level), while EM equity currencies are relatively neutral. This difference stems from the constituent countries: the EM bond index is more heavily weighted towards high-yield countries with significant currency depreciation pressure (e.g., Brazil, Turkey), while the EM equity index includes more export-oriented economies (e.g., China, Taiwan) whose currencies are supported by trade surpluses.
Comparative Data: Currency Valuation Differences Across EM Indices
| Index Type | Currency Valuation vs. USD (Estimate) | Key Currency Characteristics |
|---|---|---|
| MSCI Emerging Market Equity | ~0% (Average) | CNY, KRW, TWD relatively strong |
| J.P. Morgan GBI Emerging Bond | ~-10% (Undervalued) | BRL, TRY, ZAR relatively weak |
| South Korea (Independent Reference) | ~-15% (Extremely Undervalued) | KRW suppressed by export competition |
This divergence implies: Investors favoring currency undervaluation should prioritize EM bonds over EM equities. However, the original text also points out that yields on EM local bonds are far higher than Euro/Yen bonds. Even if their currency valuation is not as extremely cheap, their total return potential could still be superior. For example, the real yield on Brazil's 10-year government bond exceeds 6%, while Japan's is negative. Even if the Real depreciates 5% against the USD, the total return could still be positive.
Quantitative Logic of Investment Recommendations: Double Advantage and Double Risk
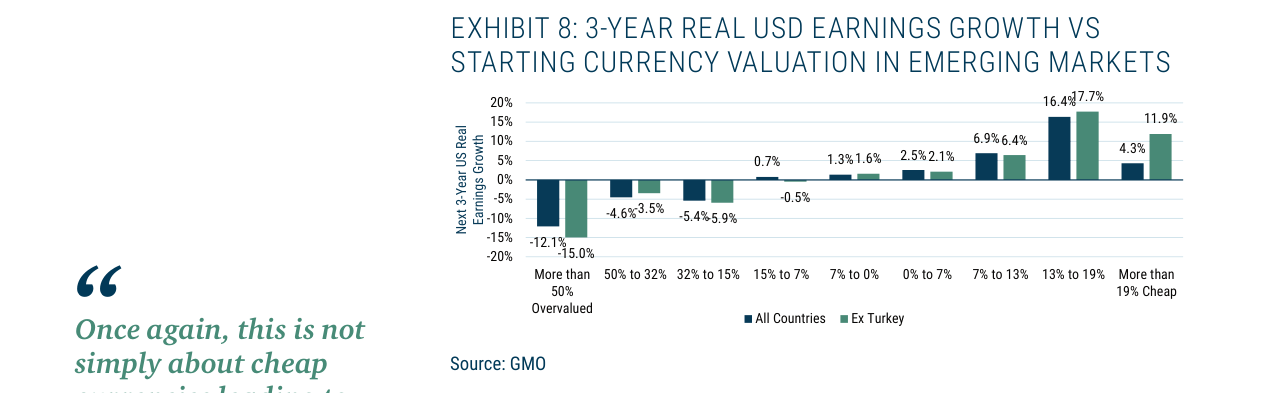
Countries with EM currencies overvalued by more than 50% saw real earnings growth of -12.1%, while those undervalued by more than 19% saw growth of 11.9%.
The author's three recommendations for USD-based investors (prefer European/Japanese equities, prefer EM equities, do not unhedge) are all based on a "double advantage" framework: Investing in equities in a market with an undervalued currency allows investors to potentially gain from both equity appreciation and currency appreciation. Conversely, investing in a market with an overvalued currency exposes investors to the risk of double losses. For example, the USD is at a historical high (according to GMO's model, the dollar is overvalued by 15-20% against a basket of currencies), while the S&P 500 forward P/E is ~18x (above the historical median of 16x). This means even if U.S. corporate earnings grow as expected, a 10% depreciation of the dollar would directly erode the local currency returns for overseas investors. Conversely, the Nikkei 225 forward P/E is ~13x, and the Yen is undervalued by ~25% against the USD. If the Yen mean-reverts, overseas investors could gain from both valuation repair (assuming P/E rises to 15x, a 15% gain) and currency appreciation (25%), resulting in a total return of 44% (1.15 × 1.25 - 1).
Quantitative Comparison: U.S. vs. Japan Equity Investment Scenario (Assuming 3-Year Holding Period)
| Variable | U.S. | Japan |
|---|---|---|
| Current P/E | 18x | 13x |
| Hypothetical Target P/E | 16x (Mean Reversion) | 15x (Mean Reversion) |
| Equity Return (Local Currency) | -11% | +15% |
| Currency Valuation Deviation | +15% (Overvalued) | -25% (Undervalued) |
| Hypothetical Mean Reversion Magnitude | -15% | +25% |
| Total Return (USD) | -24% | +44% |
Note: Assumes zero earnings growth, only considering valuation and currency changes. In reality, earnings growth could be positive, but the relative difference would be similar.
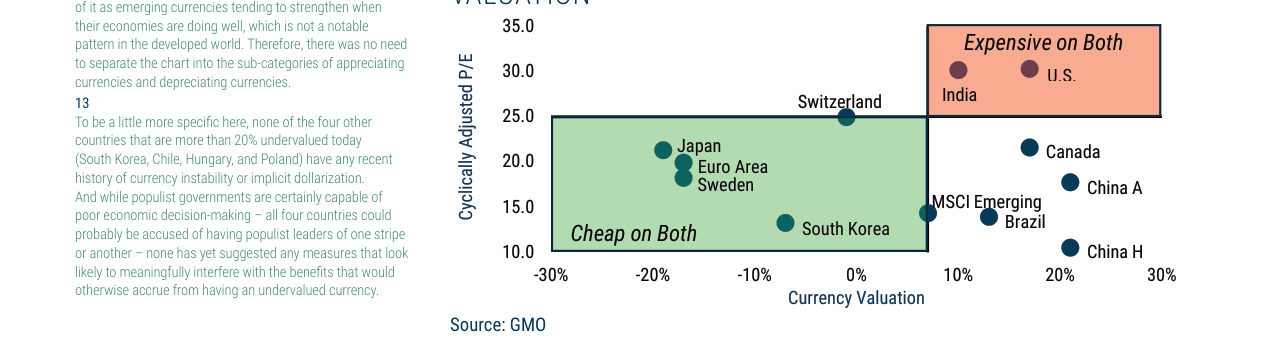
The scatter plot shows the U.S. and India are in the overvalued zone for both equity and currency valuations, while Japan and the Eurozone are in the undervalued zone.
The Paradox of Hedging Strategy: Why "Not Unhedging" is Actually Rational?
The author's recommendation to "not start hedging non-U.S. dollar equity exposure if currently unhedged, and consider relaxing hedging if currently hedged" is based on a trade-off between hedging costs and expected currency returns. The Yen and Euro are at multi-decade lows, and the implied hedging cost in the forward market (i.e., forward discount) is extremely high. For example, the 1-year USD/JPY forward discount is ~3%, meaning hedging Yen exposure costs 3% per year. If the Yen appreciates 25% over three years (8% annualized), hedging would completely consume the currency gains. Therefore, for investors already holding Japanese equities, removing the hedge preserves the full potential of currency appreciation. For those not yet holding, buying unhedged Japanese equities directly is superior, as hedging costs would erode the attractiveness of the equity itself.
Comparison of Hedging Costs and Expected Currency Returns (Annualized)
| Currency Pair | 1-Year Forward Discount | Author's Implied Expected Annual Appreciation | Net Benefit of Hedging |
|---|---|---|---|
| USD/JPY | -3% | +8% | +5% (Unfavorable) |
| USD/EUR | -2% | +6% | +4% (Unfavorable) |
| USD/EM Currency | -5% to -10% | +3% to +5% | -2% to -5% (Highly Unfavorable) |
Note: Hedging costs for EM currencies are higher due to larger interest rate differentials (e.g., 1-year USD/BRL forward discount ~10%), but expected currency appreciation is weaker, resulting in a negative net benefit from hedging.