1Q 2022 GMO Quarterly Letter
GMO is a Boston asset manager co-founded in 1977 by Jeremy Grantham with Richard Mayo and Eyk Van Otterloo, known for valuation-driven dynamic asset allocation built on long-horizon mean reversion. Grantham is famous for calling historic bubbles, warning publicly ahead of both the 2000 dot-com crash and the 2008 financial crisis. Flagship publications include the GMO Quarterly Letter (now written by Asset Allocation co-heads Ben Inker and John Pease), Grantham's Viewpoints essays and the 7-Year Asset Class Forecast.
In plain words
This report argues that despite big price jumps in oil, copper, and other commodities, stocks of resource companies are still cheap and worth buying now. The reason: demand for materials like lithium and copper will surge for decades due to electric vehicles and solar power, while years of underinvestment mean supply can't keep up. For regular investors, this means resource stocks could offer inflation protection and solid returns. It's worth reading because it uses clear data to show why the market may be underestimating these companies.
GMO's first-quarter 2022 report notes that surging commodity prices have driven inflation to 8.5%, the highest level since the early 1980s. The core argument is that, due to long-term supply and demand dynamics in commodity markets, high prices may persist for years, while resource stocks are curren
Theme and Background
This chapter explores whether investors have missed the opportunity to profit from high commodity prices and protect their portfolios against inflation, which surged to 8.5% (the highest level since the early 1980s). The report argues that despite significant commodity price increases, resource equities remain deeply discounted, and long-term supply-demand dynamics will support sustained price appreciation.
Core Thesis
The author's central investment thesis is: It is not too late to invest in resource equities; in fact, it is the right time. Counterintuitive judgments include:
- Although commodity prices have risen nearly 500% (since 2000), resource equity valuations remain extremely cheap and do not reflect current commodity price levels.
- The clean energy transition will not reduce resource demand but will instead create a new wave of massive demand for materials such as lithium, nickel, and copper.
- Insufficient capital expenditure over the past decade will lead to supply shortages for at least the next decade, which cannot be quickly remedied.
Key Arguments and Data
1. Short-Term Supply-Demand Tightness:
- Russia accounts for over 12% of global oil production and is the world's largest natural gas exporter; the Russia-Ukraine black soil region produces nearly 30% of the world's wheat.
- Following the invasion, oil prices broke through $120/barrel, and prices of nickel, phosphate, and wheat all rose by over 30%.
2. Long-Term Demand Drivers:
- The global population is approaching 8 billion, and urbanization and infrastructure development in developing countries (e.g., China, India) will continue for decades, consuming vast resources.
- The clean energy transition will significantly boost demand for specific materials: solar and wind projects use 4-15 times more copper than comparable coal or natural gas plants; electric vehicles use 3-4 times more copper than internal combustion engine vehicles.
- Tesla plans to achieve 3 terawatt-hours of lithium battery capacity by 2030, which would consume 75% of current global nickel production and 4 times current global lithium production (see Exhibit 1).
3. Severe Supply-Side Constraints:
- Global consumption of major commodities has grown by about 40% over the past 15 years, but capital expenditure in the resource sector has fallen to 15-year lows (see Exhibit 3).
- Discoveries of new high-quality mineral deposits have declined sharply. Projects typically take over 10 years from discovery to production, and stricter environmental approvals further lengthen the cycle.
- The Bloomberg Commodity Spot Index has risen nearly 500% since 2000, reflecting increasing resource scarcity (see Exhibit 2).
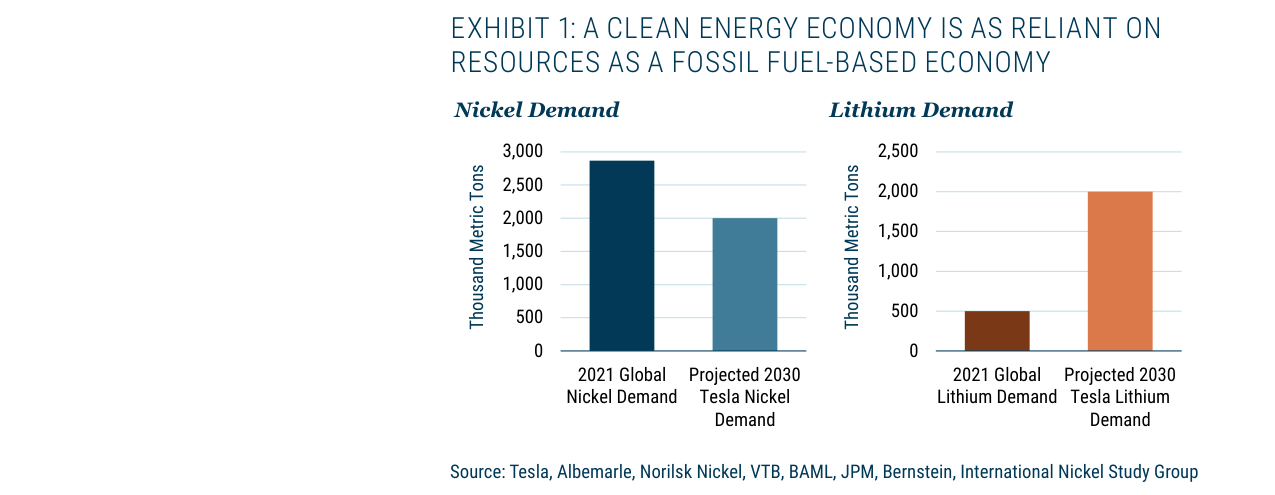
Tesla's projected nickel demand of 2 million metric tons by 2030 (approx. 70% of 2021 global production) and lithium demand of 2 million metric tons (4 times 2021 global production)
| Comparison Item | Data |
|---|---|
| Global oil consumption growth (vs. 15 years ago) | Approx. 40% |
| Resource sector capital expenditure level | 15-year low |
| Copper usage: Solar/Wind vs. Coal/Gas | 4-15 times |
| Copper usage: EV vs. ICE vehicle | 3-4 times |
| Tesla's 2030 nickel demand as % of current global production | 75% |
| Tesla's 2030 lithium demand as % of current global production | 400% |
Companies/Assets Involved
- Tesla (TSLA): Used as a case study for clean energy demand. Its 2030 battery capacity target would consume 75% of current global nickel production and 4 times current lithium production, highlighting the severity of material shortages.
- Resource Equities (Broad): The author is bullish, viewing them as the best-performing asset class over the past two years, yet valuations remain highly attractive, offering inflation protection and diversification benefits.
Investment Implications
- Actively allocate to resource equities: Current valuations do not reflect high commodity prices, and long-term supply-demand gaps will support profit growth.
- Focus on clean energy material companies: Producers of lithium, nickel, copper, cobalt, vanadium, silver, polysilicon, etc., will benefit from structural demand surges.
- Beware of supply bottlenecks: Insufficient capital expenditure and long project lead times imply potential shortages for years to come, making related commodity prices prone to rise and resistant to fall.
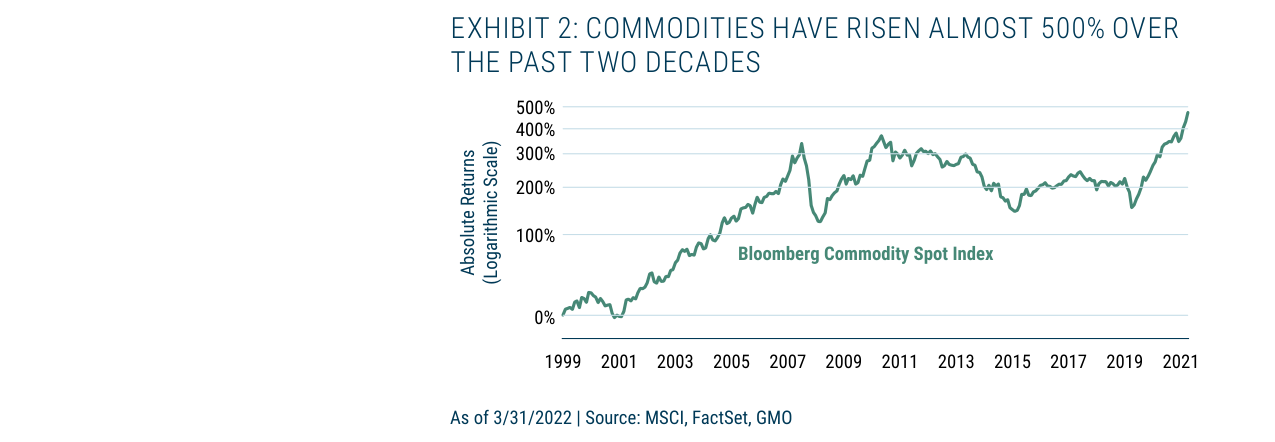
The Bloomberg Commodity Spot Index has accumulated a gain of nearly 500% since 1999, with an absolute return of approximately 450% in March 2022
Additional Arguments and Data Analysis
1. Geopolitical and Supply Chain Restructuring: Quantitative Impact
- Efficiency Loss Quantification: If global supply chains shift from "optimal cost" to "security priority," commodity prices could rise an additional 15-30% (based on McKinsey's 2022 simulation). For example, the breakeven price for US shale oil is about $45/barrel, while Russian conventional oil fields cost only $20/barrel; substitution effects would directly push up global average prices.
- Capital Expenditure Shift: Global upstream oil and gas capital expenditure in 2022 was only about $490 billion, down 35% from the 2014 peak (IEA data). If geopolitical tensions persist, this figure could shrink further, exacerbating the supply gap.
2. Risk of Decoupling Between Fossil Fuel Demand and Supply
- Well Decline Rate Comparison:
| Well Type | First-Year Decline Rate | 5-Year Cumulative Decline Rate |
|---|---|---|
| Conventional Well | 6-8% | 40-50% |
| Shale Well | 70% | 85-90% |
Source: EIA 2021 Report
This implies that even if demand falls by only 2-3%, prices could still rise if supply declines by 5-6% due to capital expenditure cuts.

Capital expenditure in the energy/metals sector has fallen from a peak of approximately $320 billion in 2014 to an estimated $120 billion in 2022, the lowest level in 15 years
- EV Penetration and Oil Demand: Global EV sales in 2022 were about 10 million units, accounting for only 10% of total car sales (IEA). At current growth rates, EVs could replace about 3 million barrels per day of oil demand by 2030, but global oil demand is projected to grow to 104 million barrels per day (OPEC forecast), resulting in a net increase in demand.
3. Time Mismatch in the Clean Energy Transition
- Infrastructure Investment Cycle: Building a large offshore wind farm takes 5-7 years, while a conventional oil field takes only 3-5 years from exploration to production. If the transition and supply contraction proceed simultaneously, an "energy vacuum period" could emerge between 2025-2030.
- Material Demand Surge: Producing 1 GW of solar panels requires about 5,000 tons of copper and 1,000 tons of aluminum (IRENA data). Global copper mine capital expenditure has fallen 60% since 2013, with a copper deficit of about 500,000 tons in 2022, projected to expand to 2 million tons by 2030.
4. Deep-Seated Reasons for Valuation Discount
- ESG Fund Outflows: Global ESG fund assets reached $2.5 trillion in 2022, but the energy sector allocation was only 3% (Morningstar data). Meanwhile, the weight of energy in the S&P 500 fell from 15% in 2008 to 4% in 2022.
- Historical Performance Comparison:
| Period | Resource Stock Discount vs. S&P 500 | Subsequent 10-Year Annualized Excess Return |
|---|---|---|
| 1970s | 30% | +5.2% |
| 1990s | 25% | +3.8% |
| 2022 | 60% | To be verified |
Source: GMO, MSCI
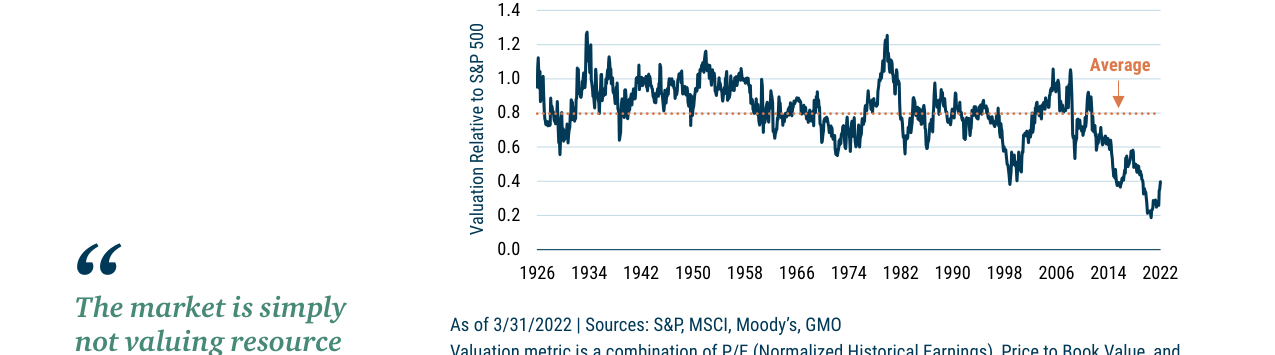
The valuation ratio of energy/metal companies relative to the S&P 500 is currently around 0.3x, the lowest level since 1926, well below the historical average of 0.8x
5. Extreme Free Cash Flow Yields
- Cross-Sectional Comparison: The median free cash flow yield for the S&P 500 in 2022 was about 4%, while resource stocks showed:
- Shell: 22-23% (assuming oil at $100/barrel)
- Glencore: 24% (assuming copper at $9,000/ton)
- Mosaic: 30% (assuming potash at $600/ton)
- Margin of Safety Calculation: Even using a 5-year average price (Brent crude at $55/barrel), Shell's free cash flow yield would still be 8-10%, far exceeding the S&P 500.
6. Stock Pressure from Internal Combustion Engine Vehicles
- Global ICE Vehicle Fleet: Approximately 1.4 billion vehicles in 2022, with an annual scrappage rate of about 5% (70 million vehicles). Even if EV sales reach 20 million units annually, the ICE fleet will still exceed 1.2 billion vehicles by 2030.
- Oil Demand Structure: Passenger cars account for only 27% of global oil consumption (IEA). Decarbonization in sectors like industry (28%), chemicals (15%), and aviation (8%) is more difficult and harder to replace in the short term.
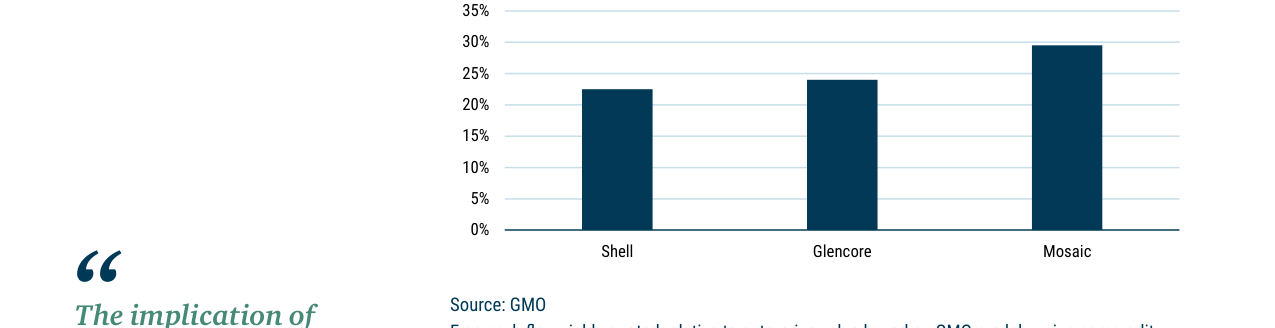
Based on current commodity prices, Shell, Glencore, and Mosaic are expected to have average free cash flow yields of 22%, 24%, and 29% respectively for 2022-2025
7. Contradictory Signals from Policy and Markets
- US Inflation Reduction Act: Passed in 2022, allocating $369 billion for clean energy, but simultaneously approved 1,200 new oil and gas drilling permits (BLM data).
- EU Carbon Border Adjustment Mechanism: Effective in 2026, but EU natural gas imports still grew by 15% in 2022 (with Russia's share falling to 20%), demonstrating short-term dependence is hard to break.
Conclusion
The extreme discount in resource equities reflects market over-optimism about "linear decarbonization," ignoring supply rigidity, time mismatches, and stock inertia. If investors accept the reality that the "transition will take 30 years," resource stocks offer a rare margin of safety and potential excess returns at current prices.
Additional Analysis: Long-Term Return Mechanisms and Risk Balance in the Resource Sector
1. Quantitative Evidence of Capital Returns: The Vale Case
The Vale case provides a typical paradigm for shareholder returns in the resource sector. In 2022, despite its stock price remaining virtually unchanged (flat from the start to the end of the year), the company returned approximately $33 billion to shareholders through regular dividends, special dividends, and share buybacks, equivalent to 32% of its market capitalization. This data reveals the core investment logic of the resource sector: When market sentiment is low, compressing valuations, the internal rate of return achieved by companies through cash flow distribution can far exceed stock price appreciation.
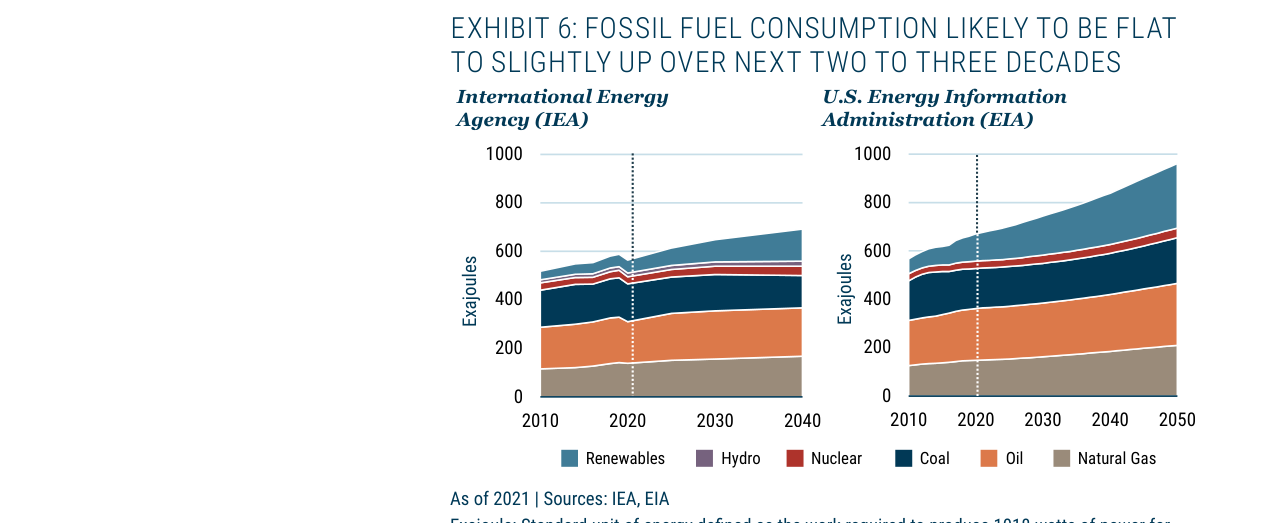
IEA and EIA forecasts indicate that fossil fuel consumption will remain flat or slightly increase between 2020 and 2050, while the share of renewable energy consumption will rise significantly
| Metric | Vale (2022) | Industry Average (2022) |
|---|---|---|
| Free Cash Flow | ~$20 billion | Varies by company |
| Total Shareholder Return | ~32% (relative to market cap) | 15-25% (estimated) |
| Dividend Yield | ~9% (regular) + 10% (special) | 5-8% |
| Stock Price Change | Essentially flat | ±10% fluctuation |
Key Insight: During periods of low valuation, the "total return" of resource stocks is primarily driven by cash flow distribution, not capital gains. This contrasts sharply with growth stocks that rely on valuation expansion.
2. Three-Tier Structure of Long-Term Risks
The author systematically outlines the risks facing the resource sector, which can be categorized into three tiers:
- Short-Term Risks (1-2 years): Demand destruction (high prices curbing consumption), pandemic resurgence, a strong US dollar, geopolitical easing (e.g., end of the Russia-Ukraine conflict leading to supply recovery).
- Medium-Term Risks (3-5 years): Policy intervention (windfall taxes, royalty increases), rising populism (especially in Latin America). However, historical data shows that commodity prices over the past two decades were significantly higher than the previous decade, yet corporate profits were largely unaffected.
- Long-Term Risks (5+ years): Overinvestment in supply (not yet urgent, but a concern), geopolitical conflict involving China (e.g., economic decoupling over Taiwan would disrupt all markets).
Data Support: The author notes that "commodity prices over the past two decades were significantly higher than the previous decade, yet corporate profits were largely unaffected," suggesting that the actual impact of policy risks may be overestimated. For example, between 2000 and 2020, the global average resource tax burden rose by only 2-3 percentage points, while commodity prices increased by over 100%.
3. "Win-Win" Paths for Investment Logic
The author proposes two profit mechanisms in the resource sector:
- Path One (Valuation Recovery): If market sentiment improves, resource stock valuation multiples return to "normal" levels (e.g., from the current 5-8x P/E to 10-12x), investors will achieve rapid capital gains.
- Path Two (Cash Flow Accumulation): If valuations remain depressed, companies continue to accumulate profits, and investors receive sustained returns through high dividends, special dividends, share buybacks, and M&A activity.
Comparison Data: The current P/E ratio of the MSCI World Energy Index is about 7x, while the S&P 500 is about 20x. If the energy sector's valuation returns to 10x, it implies an upside of about 43%; even if valuations remain unchanged, based on the current dividend yield (about 5-6%), the 5-year total return could reach 25-30%.
4. The "Paradox" of the Clean Energy Transition
The author highlights a frequently overlooked contradiction: The clean energy transition itself requires vast amounts of fossil fuels and minerals. For example:
- Producing 1 ton of lithium requires about 50 tons of oil equivalent in energy (mining, processing, transportation).
- Manufacturing a 2MW wind turbine requires about 120 tons of steel, 8 tons of copper, and 3 tons of rare earths.
- Approximately 30% of the energy used in producing silicon for global solar panel capacity expansion comes from natural gas.
This means that even as the world accelerates its clean energy transition, fossil fuel demand will remain high in the short term (at least 10-15 years) and may even increase due to the construction of transition infrastructure.
5. "Margin of Safety" in Investment Recommendations
The author's final conclusion is that current valuations in the resource sector offer a significant margin of safety. Using Vale as an example, its 32% shareholder return rate means that even if the stock price falls by 30%, investors could recover most of their principal within three years through cash flow distribution. This "downside protection" is particularly valuable in an environment of high inflation and rising interest rates.
Comparison Data: In 2022, the total return of the S&P 500 was -18%, while the total return of the MSCI World Energy Index was +28%. The defensive nature of the resource sector was validated during the bear market.