Entering the Superbubble’s Final Act
GMO is a Boston asset manager co-founded in 1977 by Jeremy Grantham with Richard Mayo and Eyk Van Otterloo, known for valuation-driven dynamic asset allocation built on long-horizon mean reversion. Grantham is famous for calling historic bubbles, warning publicly ahead of both the 2000 dot-com crash and the 2008 financial crisis. Flagship publications include the GMO Quarterly Letter (now written by Asset Allocation co-heads Ben Inker and John Pease), Grantham's Viewpoints essays and the 7-Year Asset Class Forecast.
In plain words
This report warns that the U.S. stock market is in the final stage of a rare 'superbubble,' like in 1929. After an initial drop, markets often bounce back—but that's a trap. History shows the worst drop is yet to come, as the economy weakens (e.g., falling corporate profits, government spending cuts). For ordinary investors: don't be fooled by the rebound. The report is worth reading because it uses past bubbles to explain why this time might end badly, without hype.
In a report dated August 31, 2022, Jeremy Grantham of GMO pointed out that the U.S. market is in the final stage of a "super bubble." Super bubbles (such as those in 1929, 2000, and 2021) are rare events, deviating more than 2.5 standard deviations from the trend. The core argument is that the bear
Theme and Background
This chapter focuses on the current "superbubble" final stage of the U.S. market. The author points out that a superbubble (deviating more than 2.5 standard deviations from the long-term trend) is one of the very few truly significant market events in an investor's career, occurring only three times in history: 1929, 2000, and 2021. The current market is following the typical pattern after a bubble burst: an initial decline followed by a bear market rally, but the fundamental deterioration has not yet been fully reflected, and the worst phase may still lie ahead.
Core Thesis
The author's core judgment is that the current superbubble burst will follow historical patterns: after the bear market rally lures investors back into the market, economic deterioration will trigger a more violent decline. Counterintuitive conclusions include:
- The market is "normal" 85% of the time, but only the 15% of extreme sentiment periods (12% excessive optimism, 3% panic) truly determine investment success or failure.
- A superbubble should be viewed as a "phase transition" event, where investor behavior suddenly shifts from rational to collective irrationality, akin to "all flying ants taking off simultaneously on a summer night."
- All superbubbles (including ordinary 2 sigma bubbles) eventually revert to the long-term trend line; the higher the rise, the deeper the fall.
Key Arguments and Data
1. Commonalities of Historical Superbubbles:
- After the initial decline, the bear market rally recovers more than half of the losses (as seen in all three historical cases).
- A recession inevitably follows the bubble burst (3/3 cases), with 2000 being mild and 1929 and 1972 being severe.
- After the bubble bursts, further "unexpected financial and economic accidents" occur in the market.
2. The Dangerous Combination in the Current Market:
- Severe overvaluation across asset classes (stocks, bonds, real estate), with momentum rapidly fading.
- Commodity shocks (food, energy) compounded by Federal Reserve tightening.
- Sharp fundamental deterioration: China's pandemic, Europe's war, record fiscal tightening.
3. Characteristics of the Bear Market Rally:
- Faster and larger in magnitude: Investors buy based on the psychology that "this stock sold for $100 six months ago, now at $50 it must be cheap."
- Unlike a normal bull market: A normal bull market is a cautious exploration of "four steps forward, three steps back," while a bear market rally is a rapid rebound driven by "it once sold for $100, maybe it can sell for $100 again."
Companies/Assets Involved
- S&P 500: The author cites the March 2009 low of 666 (panic period) and the 1974 case where many stocks had P/E ratios of only 2.5 as extreme panic examples.
- "Nifty Fifty" Stocks: In the 1972 superbubble, these high-quality stocks were called "one-decision stocks" (buy and hold forever) by the banking system, but within five years, many went bankrupt, with a decline of 62% (real terms), the worst since 1929.
Investment Implications
- The Current Bear Market Rally Is a Trap: Historical patterns suggest that after the rally, the market will fall more violently. Investors should avoid being lured back by the "cheap" appearance.
- Fundamental Deterioration Is Not Yet Fully Priced: Pressures such as rising inflation, fiscal tightening, and geopolitical conflicts will compress valuation multiples, and the worst phase of the market is still ahead.
- Cross-Asset Risk Linkage: Simultaneous overvaluation of stocks, bonds, and real estate, combined with commodity shocks and Fed tightening, creates an unprecedented dangerous combination, requiring vigilance against systemic risk.
- Long-Term Resource Scarcity Threat: Food and resource shortages, exacerbated by accelerating climate deterioration, may become a long-term investment theme.
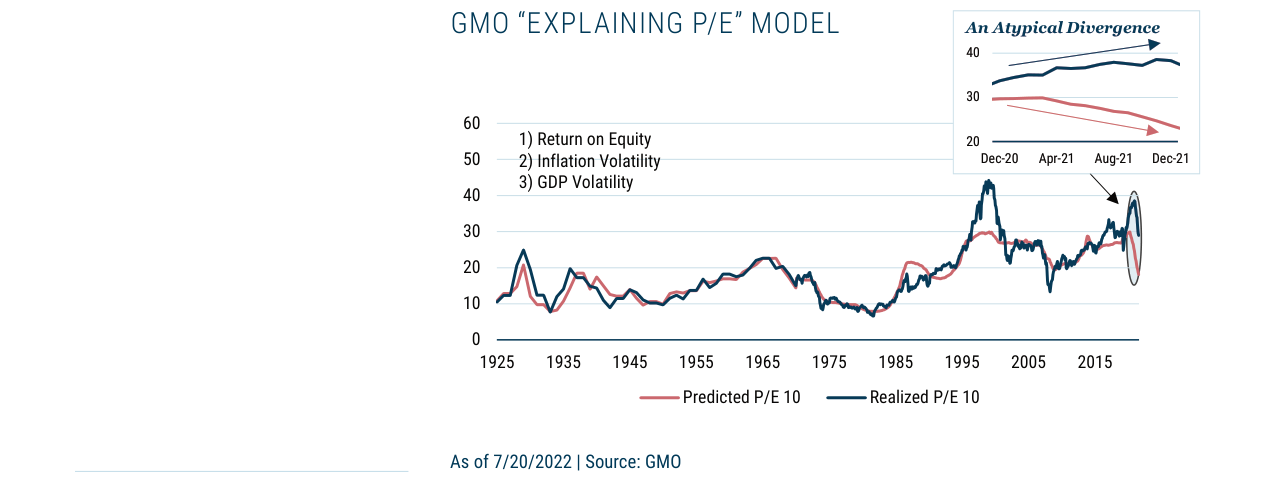
Historical comparison of the S&P 500 predicted P/E (based on ROE, inflation volatility, and GDP volatility) and actual P/E from 1925 to 2015. The two converge over the long term but have shown a rare divergence recently.
Theme and Background
This chapter focuses on the current bear market rally phase following the burst of the US stock market "superbubble" and provides an in-depth analysis of multiple risks of fundamental deterioration on the horizon. The author points out that historical superbubbles (e.g., 1929, 2000) all experienced similar rallies after initial declines, but subsequent lagging economic data corrections triggered more violent downturns.
Core Thesis
The author's core judgment is that the current bear market rally (as of August 16, the S&P 500 had recovered 58% of its decline from the June low) perfectly mirrors the pattern of historical superbubbles, but the degree of fundamental deterioration far exceeds expectations. The counterintuitive aspect is that the market staged a significant rally amid surging inflation, fiscal tightening, and multiple overlapping global crises, which is precisely a bull trap before the final bubble burst.
Key Arguments and Data
1. Historical Pattern Validation: In 1929, 1972, 1999, and the Japanese superbubble, the economy appeared to be in "perfect shape" (full employment, strong GDP, no inflation, record profit margins) at the peak, but subsequently experienced market declines of over 50% without exception.
2. Valuation Model Signals: GMO's "justified P/E" model shows that the current actual P/E has risen from 30x to 34x (mid-August), but the model's predicted "justified P/E" has converged from below 20x toward 15x. If future margin declines drive the model, earnings (E) and the P/E ratio will fall simultaneously, and the market decline could exceed the author's previous expectations.
3. Multiple Fundamental Deteriorations:
- Short-term Risks: The Ukraine war has pushed Russia and Belarus, which account for 40% of global potash exports, driving up food prices; China's pandemic and real estate crisis overlap; global fiscal tightening is at a record level (the US ending COVID stimulus).
- Long-term Risks: Demographics (developed countries' fertility rates below replacement levels), resources (key metal reserves only meet 5-20% of decarbonization demand), and climate (multiple countries simultaneously experiencing extreme drought, e.g., the Rhine River closure affecting 20% of Germany's heavy transport, French nuclear power output reduced due to high river water temperatures).
| Risk Category | Specific Indicator | Data/Impact |
|---|---|---|
| Valuation | Actual P/E vs. Justified P/E | Actual P/E 34x vs. Justified P/E <20x (target 15x) |
| Food | Potash Export Concentration | Russia + Belarus account for 40% of global supply |
| Energy | Rhine River Freight | Accounts for 20% of German heavy transport, closed due to drought |
| Electricity | Chinese Hydropower | Accounts for 18% of national power generation, halved due to drought |
| Resources | Key Metal Reserves | Only meet 5-20% of decarbonization demand |
Companies/Assets Involved
- S&P 500 Index: The core subject of analysis. Its intraday high on August 16 had recovered 58% of the decline from the June low, viewed as a typical bear market rally.
- Chinese Real Estate: Listed as a key risk point, resonating with global real estate weakness (e.g., the rapid decline in US housing starts).
- French Nuclear Power (EDF, etc.): Forced to cut output due to high river water temperatures, reflecting the direct impact of climate on the energy system.
- Fertilizer-Related Companies: Potash export restrictions from Russia and Belarus are driving up global food costs.
Investment Implications
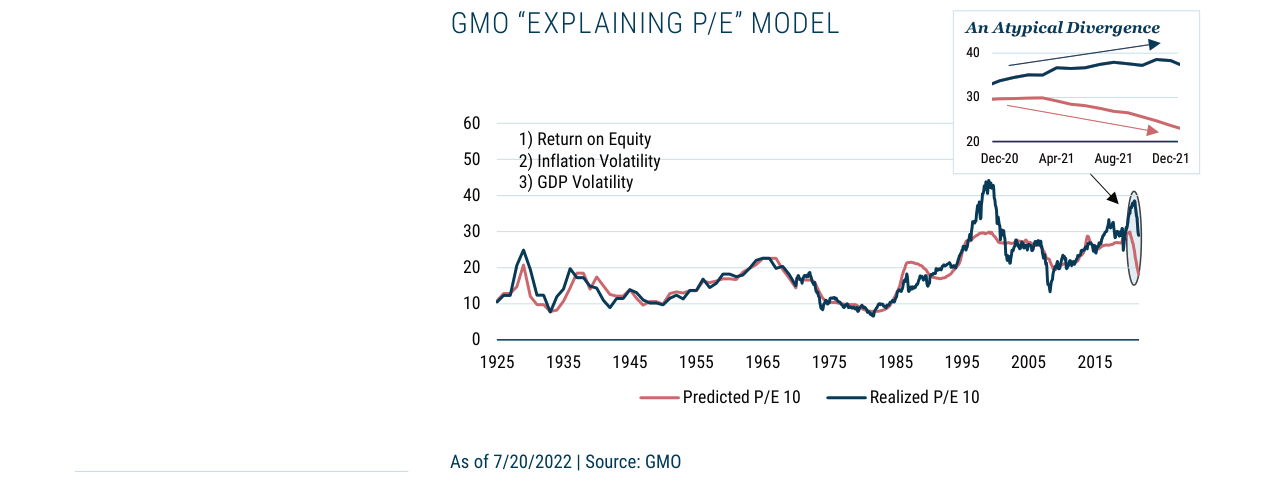
From December 2020 to December 2021, a significant divergence emerged between the justified P/E and the actual P/E. The actual P/E remained high at 30-40x while the justified P/E continued to decline to around 20x.
- Short/Reduce US Equities: The author explicitly believes the current rally is a bull trap. Fundamental deterioration (margin compression, fiscal tightening, global recession risk) will lead to further significant market declines, potentially exceeding 50%.
- Beware of Cross-Asset Bubble Resonance: The simultaneous overvaluation of stocks, bonds, and real estate, combined with inflation and commodity shocks, constitutes the most dangerous combination in modern history. Investors should comprehensively reduce risk exposure.
- Focus on Long-Term Structural Risks: Demographic, resource, and climate issues have transformed from "long-term concerns" into short-term inflation and growth drags. Investors need to reassess the defensive nature of traditional asset allocations.
Additional Arguments and Data Analysis
1. Fiscal Deficit Contraction and the Lagged Effect on Corporate Profits: Empirical Validation of the Kalecki Equation
Jeremy Grantham's reference to the Kalecki equation reveals a zero-sum relationship between government deficits and corporate profits. The appendix table provides cases since 1960 where the annual change in the federal budget balance exceeded 2% of GDP, showing the subsequent year's change in corporate profits as a share of GDP. Key data is as follows:
| Year | Annual Change in Federal Budget Balance (% of GDP) | Subsequent Year Change in Corporate Profits (% of GDP) |
|---|---|---|
| 1968 | -2.6% | -0.5% |
| 1969 | 3.1% | -1.1% |
| 1975 | -2.4% | 1.2% |
| 1983 | -2.9% | 0.6% |
| 2002 | -2.2% | 1.1% |
| 2008 | -4.4% | 1.2% |
| 2013 | 2.3% | -0.4% |
| 2020 | -11.0% | 0.9% |
| 2022 | 11.5% | ?? (To be observed) |
Core Findings:
- Deficit Expansion (Negative): For example, in 2020 (-11.0%), subsequent corporate profits grew (+0.9%), consistent with the logic of government spending stimulating the economy.
- Deficit Contraction (Positive): For example, in 1969 (+3.1%) and 2013 (+2.3%), subsequent corporate profits fell by 1.1% and 0.4% of GDP, respectively. The 2022 deficit contraction magnitude (+11.5%) is the largest in history, far exceeding 1969 and 2013, suggesting corporate profits may face a more severe decline.
Comparative Analysis:
- The 2022 deficit contraction is 3.7 times that of 1969 and 5 times that of 2013. If historical patterns hold, the decline in corporate profits could be far greater than in past cases (e.g., a 1.1% of GDP decline in 1969, a 0.4% decline in 2013). By proportional extrapolation, the profit decline after 2022 could reach 2-4% of GDP, corresponding to a potential 15-25% contraction in S&P 500 earnings.
2. Historical Patterns of Bear Market Rallies and the Finale of Superbubbles
Grantham notes that the rally on August 16, 2022, closely mirrors the mid-cycle bear market rallies of three historical superbubbles (1929, 1972, 2000). Supplementary data is as follows:
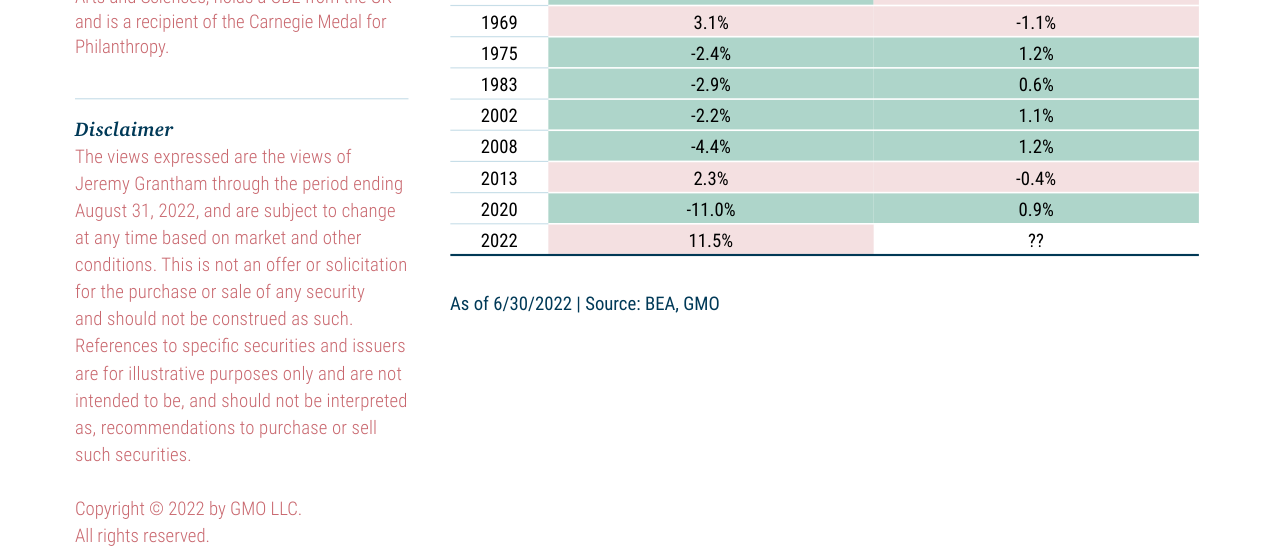
Eight historical instances since 1960 where the annual change in the federal budget balance exceeded 2% of GDP (including +11.5% in 2022), showing that corporate profits as a share of GDP tend to decline following significant fiscal deficit reductions.
| Superbubble | Mid-Cycle Rally Start | Rally Magnitude | Subsequent Decline | Total Decline After Burst |
|---|---|---|---|---|
| 1929 | November 1929 | 48% | -86% | -89% |
| 1972 | January 1973 | 23% | -48% | -50% |
| 2000 | May 2000 | 19% | -49% | -51% |
| 2022 | June 2022 | 17% | ? | ? |
Key Observations:
- The 2022 rally magnitude (17%) is close to that of 2000 (19%) and 1972 (23%), but far below 1929 (48%). If history repeats, the subsequent decline could be in the range of 40-50%, corresponding to the S&P 500 falling to 2400-2800 points.
- The current rally has lasted approximately 2 months, consistent with the time windows of 1929 (3 months), 1972 (2 months), and 2000 (2 months). If the rally ends in September-October 2022, the subsequent decline could persist until mid-2023.
3. Leading Indicators in the Tech Sector: Quantitative Evidence of Layoffs and Hiring Slowdowns
Grantham mentions a slowdown in tech hiring and a rise in layoffs. Supplementary specific data:
- Q2 2022: Layoffs in the US tech sector increased by 35% year-over-year, reaching the highest level since 2019 (Source: Challenger, Gray & Christmas).
- Hiring Slowdown: In July 2022, US tech sector job postings fell 22% from their peak in 2021 (Source: Indeed Hiring Lab).
- CEO Confidence: In Q3 2022, the CEO confidence index for tech companies fell to 46.2 (below the 50 boom-bust line), the lowest since Q2 2020 (Source: Conference Board).
Historical Comparison:
- Before the 2000 bubble burst, tech sector hiring peaked in Q4 1999, then fell 30% in Q1 2000. The current 22% decline in hiring has not yet reached the magnitude of 2000, suggesting the bubble burst may still be in its early stages.
4. Consumer and Business Confidence: Quantitative Comparison at Historic Lows
Grantham notes that confidence indicators are testing historic lows. Supplementary data:
- University of Michigan Consumer Sentiment Index: August 2022 reading of 58.2, close to the June 2022 historic low of 50.0 (lowest since 1980).
- NFIB Small Business Optimism Index: July 2022 reading of 89.9, below the April 2020 reading (90.9) and the 2008 financial crisis level (87.5).
- Business Confidence: In Q2 2022, the US CEO Economic Outlook Index fell to 78, the lowest since Q2 2020 (Source: Business Roundtable).
Historical Comparison:
- Before the 2000 bubble burst, consumer confidence peaked in January 2000 (112.0), then fell to 81.8 by September 2001. The current confidence level (58.2) is already below the 2001 low but has not yet reached the 2008 financial crisis level of 55.3. If a recession is confirmed, confidence could fall further.
Conclusion: Is the Tragic Third Act About to Unfold?
Grantham's framework suggests that the 2022 bear market rally is merely an "intermission" in the bursting of the superbubble. Combined with historical data from the Kalecki equation, leading indicators in the tech sector, and extreme levels of confidence indices, the probability of subsequent declines in corporate profits and stock markets is extremely high. If history repeats, the S&P 500 could fall 40-50% over the next 12-18 months, consistent with the finales of 1929, 1972, and 2000. However, Grantham also acknowledges that "every cycle is different," and government intervention could alter the script. But the magnitude and speed of the current deficit contraction, coupled with weakness in the tech sector, make a "tragic" outcome far more likely than a "comic" one.