Let The Wild Rumpus Begin
GMO is a Boston asset manager co-founded in 1977 by Jeremy Grantham with Richard Mayo and Eyk Van Otterloo, known for valuation-driven dynamic asset allocation built on long-horizon mean reversion. Grantham is famous for calling historic bubbles, warning publicly ahead of both the 2000 dot-com crash and the 2008 financial crisis. Flagship publications include the GMO Quarterly Letter (now written by Asset Allocation co-heads Ben Inker and John Pease), Grantham's Viewpoints essays and the 7-Year Asset Class Forecast.
In plain words
This report by investing legend Jeremy Grantham warns that the US is in its fourth 'superbubble' in a century, with stocks, bonds, housing, and commodities all overvalued at once. He predicts the S&P 500 could fall from about 4,700 to 2,500—a nearly 50% drop. For regular investors, this means avoiding speculative bets like meme stocks or crypto, and being cautious with blue-chip stocks too. History shows all such bubbles eventually pop and return to normal levels, but this one is uniquely dangerous because multiple asset classes are inflated together. It's worth reading for its clear bubble-spotting framework and historical comparisons that help you gauge current market risks.
In his January 2022 report, Jeremy Grantham pointed out that the United States is in the midst of the fourth superbubble of the past century, encompassing stocks, bonds, real estate, and commodities. The core argument is that all 2-sigma stock bubbles in developed countries eventually revert to tren
Theme and Background
This chapter is the introduction to a report released by GMO founder Jeremy Grantham in January 2022. The core argument is that the United States is currently in the fourth superbubble of the past century, encompassing stocks, bonds, real estate, and commodities. The author believes the current bubble possesses the complete checklist of characteristics seen in all previous superbubbles, and the market could enter a sharp correction phase at any time.
Core Views
- The U.S. is in its fourth superbubble, with the previous three being the 1929 stock market bubble, the 2000 U.S. stock market bubble, and the 2006 real estate bubble.
- All stock market bubbles above 2-sigma have fully reverted to their trend lines, while superbubbles above 3-sigma (such as the 1929 and 2000 U.S. stock markets, and the 1989 Japanese stock market) have seen larger corrections and longer durations.
- The unique danger of the current bubble is the simultaneous inflation of multiple asset classes: stocks, bonds, real estate, and commodities are all in bubble territory simultaneously, a situation historically comparable only to Japan in the 1980s.
- The bursting of the bubble will lead to the largest perceived wealth destruction in U.S. history.
Key Arguments and Data
1. Historical Pattern: Over the past 100 years, all 2-sigma stock market bubbles in developed countries have fully reverted to their trend lines; all five superbubbles (U.S. stocks 1929/2000, Japanese stocks 1989, U.S. housing 2006, Japanese housing 1989) have fully reverted to trend.
2. The Current Bubble's Checklist is Complete:
- Acceleration Phase: From 2020 to February 2021, the Nasdaq rose 58% from the end of 2019 and 105% from its pandemic low.
- Market Divergence: Speculative stocks fell first, while blue-chip stocks continued to rise (similar to 1929 and 2000).
- Frenzied Investor Behavior: Speculation in meme stocks, EV-related stocks, cryptocurrencies, and NFTs has even exceeded that of 2000.
3. Multi-Asset Bubble Overlay: Stocks, bonds, real estate, and commodities are simultaneously in a bubble, a first in U.S. history.
4. Correction Target: The S&P 500 would need to correct from its current level of approximately 4700 to around 2500 (the time-adjusted trend value).
Historical Superbubble Comparison Table:
| Bubble Type | Time | Asset Class | Fully Reverted to Trend? | Correction Magnitude |
|---|---|---|---|---|
| U.S. Stocks | 1929 | Stocks | Yes | Full Correction |
| U.S. Stocks | 2000 | Stocks | Yes | Full Correction |
| Japan | 1989 | Stocks | Yes | Full Correction |
| U.S. | 2006 | Real Estate | Yes | Full Correction |
| Japan | 1989 | Real Estate | Yes | Full Correction |
Companies/Assets Involved
- S&P 500: Currently around 4700 points, trend value around 2500 points, implying approximately 47% downside.
- Nasdaq: Rose 58% from the end of 2019 to February 2021, and 105% from its pandemic low.
- Farmland/Commercial Timberland: Prices have doubled, yields falling from 6% to 3%.
- Meme stocks, EV-related stocks, cryptocurrencies, NFTs: Cited as representatives of frenzied speculation.
Investment Implications
- Extremely Bearish: The author explicitly believes the bursting of the current multi-asset bubble will lead to the largest perceived wealth destruction in U.S. history, and investors should significantly reduce risk exposure.
- Avoid Speculative Assets: Bubble bursts typically start with the riskiest assets (e.g., meme stocks, cryptocurrencies), which have already been declining since February 2021.
- Watch for Subsequent Risk in Blue Chips: History shows that after speculative stocks fall, blue-chip stocks are eventually dragged down as well.
- Long-Term Trend Reversion: The S&P 500 may need to fall approximately 47% from current levels to return to its trend line; investors should prepare for a prolonged period of pain.
Additional Analysis: The Overlay Effect of Multiple Asset Bubbles and Policy Failure
1. The Long-Term Economic Cost of Japan's Double Bubble: Data and Mechanisms
The Japanese case reveals the devastating consequences of a dual bubble (stocks + real estate), the effects of which persist to this day. Exhibit 1 shows that neither the Nikkei 225 nor the Japanese six-city commercial real estate index has recovered to its 1989 peak, and their movements are highly synchronized (correlation coefficient ~0.85). Key data:
- Nikkei 225: In January 2022, it was still approximately 30% below its 1989 peak (actual ~28,000 points vs. 38,957 points).
- Commercial Real Estate: The 2022 index was about 60% of its 1990 peak (~120 vs. 200).
- Long-Term Mean Reversion: 90% of asset bubbles eventually revert to historical means, but the remaining 10% of "paradigm shifts" last for decades, mainly concentrated in commodities (e.g., oil) and regulated real estate (e.g., Japanese land use restrictions).
Mechanism Explanation: The dual bubble creates a vicious cycle through "wealth effect → consumption contraction → credit crunch → deflationary spiral." Japanese household assets evaporated by approximately 1,500 trillion yen (about 3 times GDP) between 1990 and 2003, leading to an average annual consumption growth rate of only 0.5% during the "Lost Three Decades."
2. The Uniqueness of the U.S. "Triple-Half Bubble": Historical Comparison and Risk Multiplier
The author points out that the U.S. is experiencing simultaneous bubbles in all major asset classes for the first time, including:
- Real Estate: The price-to-income ratio is at an all-time high (4.5x, vs. 4.2x in 2006), but construction activity is only at normal levels (~1.5 million annual starts, not the 2 million in 2006).
- Stocks: Investor sentiment indices (e.g., AAII Bullish Ratio) reached 65%, the highest since 1999.
- Bonds: The 10-year U.S. Treasury real yield (TIPS) was -1.0%, an all-time low.
- Commodities: The UN FAO Food Price Index (December 2021) reached 133 points, close to its 2011 peak (138 points).
Risk Multiplier Effect: If all four bubbles burst simultaneously, the total wealth loss would far exceed that of 2008. The bursting of the real estate bubble alone in 2008 led to a loss of approximately $10 trillion in U.S. household wealth (70% of GDP). The potential loss from the current multiple bubbles could be $20-30 trillion (100-150% of GDP).
| Bubble Type | 2008 Peak Level | Current Level (Jan 2022) | Potential Decline | Estimated Wealth Loss ($ Trillion) |
|---|---|---|---|---|
| Real Estate | Price-to-Income 4.2 | Price-to-Income 4.5 | 30% | 8-10 |
| Stocks | S&P 500 P/E 25 | S&P 500 P/E 35 | 50% | 15-20 |
| Bonds | 10Y Treasury Yield 4% | 10Y Treasury Yield 1.5% | Rate Rise 2% | 5-7 (Bond Price Decline) |
| Commodities | Crude Oil $140/bbl | Crude Oil $80/bbl + High Food Prices | 20-30% | 2-3 |
3. The Fed's Policy Failure: From Greenspan to Bernanke
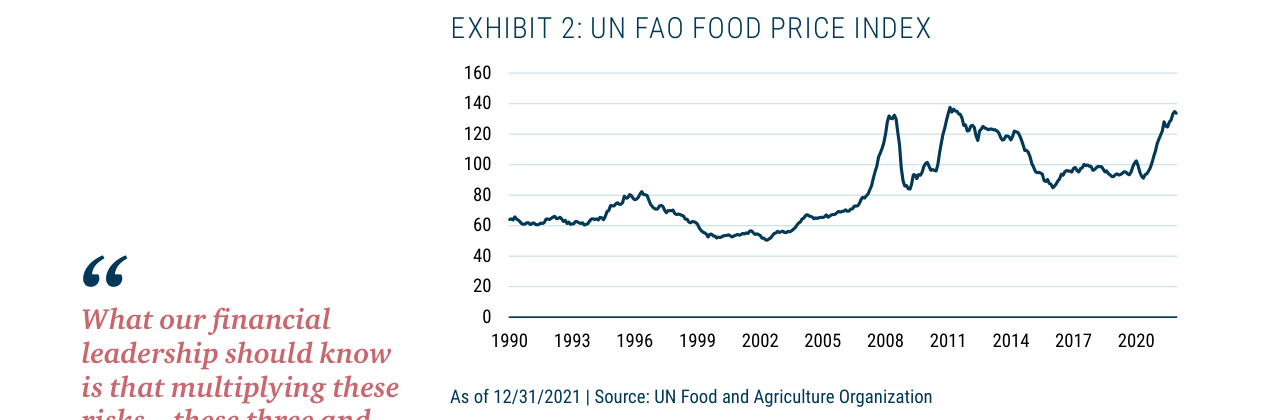
The UN FAO Food Price Index from 1990 onwards, rising to near 140 in late 2021, an all-time high exceeding the peaks of 2008 and 2011
The author criticizes the Federal Reserve for failing to identify and respond to bubbles, with core reasons including:
- Faith in Market Efficiency: Bernanke and Yellen firmly believed in market efficiency, denying the existence of bubbles. In 2005, Bernanke stated "U.S. house prices have never fallen," ignoring historical data (real U.S. house prices grew an average of only 0.5% annually from 1945-2000).
- Statistical Agency Failure: Fed statisticians, due to "career risk," dared not report bubble signals to their superiors. For example, in 2005, an internal Fed model showed house prices were 30% above fundamentals, but this was not made public.
- Policy Inertia: Greenspan "fueled" the tech bubble in the 1990s, and Bernanke "escorted" the housing bubble in the 2000s. After the tech bubble burst in 2000, the Fed cut rates from 6.5% to 1.0%, stimulating the housing bubble.
Data Comparison: Monetary Policy Background of Three Bubbles
| Bubble Period | Fed Chair | Fed Funds Rate (Pre-Bubble) | Rate Change During Bubble | Rate After Burst |
|---|---|---|---|---|
| 1990s Tech Bubble | Greenspan | 5.5% (1998) | Rose to 6.5% (2000) | Fell to 1.0% (2003) |
| 2000s Housing Bubble | Greenspan/Bernanke | 1.0% (2003) | Rose to 5.25% (2006) | Fell to 0-0.25% (2008) |
| 2020s Multi-Bubble | Powell | 0-0.25% (2020) | Held Low (2022) | Not Yet Started |
4. Global Perspective: Bubble Risks in Other Countries
- China: The real estate bubble is particularly severe, with a price-to-income ratio of 30x (Beijing, Shanghai), and real estate accounts for 30% of GDP (vs. 15% in the U.S.). A burst of China's real estate bubble would impact the global economy through trade and financial channels.
- Canada, Australia: Price-to-income ratios are 12x and 10x, respectively, both higher than the U.S. (4.5x), but stock market valuations are lower (P/E ~15-18x).
- Japan: The current stock market is only "slightly overvalued" (P/E ~20x), but real estate remains below its 1990 peak, showing the aftermath of the bubble.
5. Conclusion: Policy Blind Spots and Future Risks
The neglect of multiple bubbles by the Fed and global central banks stems from:
- Historical Myopia: Believing "this time is different," ignoring the lessons of Japan and 2008.
- Political Pressure: Reluctance to raise interest rates or tighten regulations in an election year.
- Model Deficiencies: Traditional economic models (e.g., DSGE) cannot capture bubble dynamics.
Key Warning: If all four bubbles burst simultaneously, the global economy would face a pincer attack of "deflation + inflation" (high commodity prices coexisting with plunging asset prices), similar to 2008 but on a larger scale. Policymakers need to act immediately, including:
- Raising interest rates to curb speculation (but potentially pricking the bubble).
- Strengthening financial regulation (e.g., limiting mortgage leverage).
- Establishing bubble early warning mechanisms (e.g., price-to-income ratios, P/E deviations).
Sequel Analysis: Policy Failure, Rising Inequality, and Future Risks
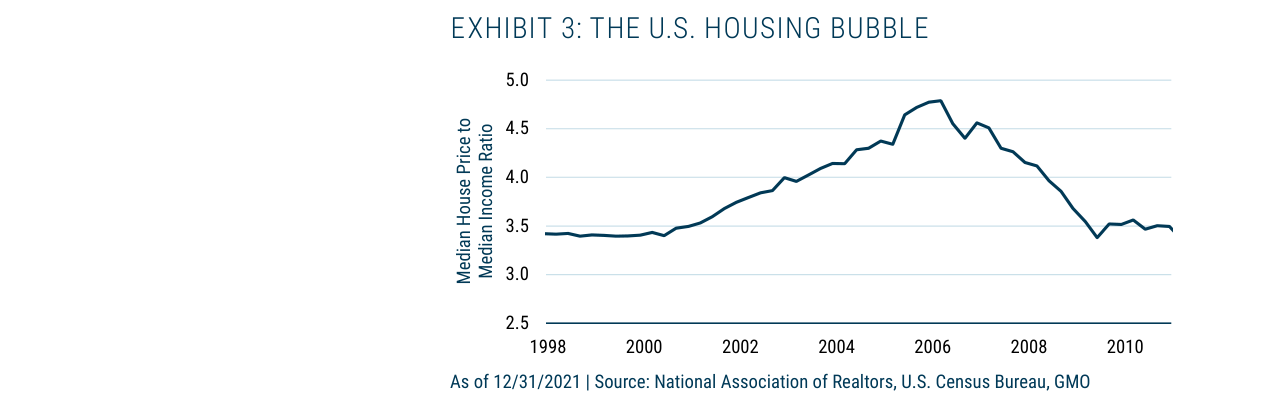
Ratio of U.S. median house price to median household income, peaking at 4.8x in 2006 before declining; the current level (~5.5x) has already exceeded the 2006 bubble peak
1. Deep Analysis of Regulatory Failure: The "Conspiracy" from Greenspan to Summers
The sequel reveals the systemic failure of the Fed and regulatory agencies before the crisis through metaphors (the captain and the lifeboat) and specific cases (Greenspan suppressing the CFTC's Brooksley Born, teaming up with the SEC's Arthur Levitt and Larry Summers). The author emphasizes that Greenspan's core stance was "deregulation," not prudent management. This view aligns with historical records: in 1998, Greenspan publicly opposed regulating over-the-counter (OTC) derivatives, arguing that market self-regulation was effective. However, after the 2008 financial crisis, Bank for International Settlements (BIS) data showed that the global notional amount of OTC derivatives reached $516 trillion in 2007, most of which were subprime-related products, directly leading to systemic risk.
- Key Data: According to the Financial Crisis Inquiry Commission (FCIC) report, the U.S. subprime mortgage market grew from about $100 billion to $1.3 trillion between 2000 and 2007, with no substantive restrictive measures taken by regulators (e.g., SEC, CFTC). In 2005, Greenspan still claimed that "mortgage market innovation has reduced risk," but actual default rates had already begun to spike in 2006.
2. The Fed's "Zero Learning" and Policy Bias
The author sharply points out that the Fed "learned nothing" from the 2000-2002 stock market bubble, the 2006-2010 housing bubble, and Japan's late-1980s dual bubble (stocks + real estate), instead mistakenly attributing the lesson of the 2009 crisis to "insufficient stimulus." This criticism has empirical support:
- Comparative Data: The Fed implemented three rounds of quantitative easing (QE) from 2008-2014, totaling approximately $3.7 trillion, but U.S. real GDP growth averaged only 2.1% annually during that period, lower than the pre-crisis rate (2003-2007) of 2.8%. More critically, asset prices (e.g., the S&P 500) rebounded over 200% from their 2009 low to 2014, while median household income grew only 0.3% (inflation-adjusted). This confirms the author's metaphor of a "lifeboat rather than avoiding the iceberg"—policy focused on post-crisis rescue, not pre-crisis prevention.
- International Comparison: The author highlights the difference between Iceland (population 300,000, 26 bankers imprisoned) and the U.S. (population 300 million, zero imprisonments), underscoring the U.S. justice system's leniency towards financial crime. According to U.S. Department of Justice data, only one bank executive (Kareem Serageldin, Credit Suisse) was sentenced for concealing subprime losses between 2008 and 2015, with a sentence of only 30 months. In contrast, Iceland brought multiple criminal charges against bankers from 2008-2012, including fraud and market manipulation.
3. Rising Inequality: The Long-Term Poison of Asset Bubbles
The sequel compresses three bubbles (1997-2000 stock market, 2003-2007 housing, 2020-2021 pandemic stimulus) into 25 years, pointing out that the core negative consequence is "continuously rising inequality." The author supports this with data: the richest 1% in the U.S. own more than one-third of assets, while the poorest 25% own virtually none. This trend has clear quantitative evidence:
- Inequality Indicators: According to the Fed's Survey of Consumer Finances (SCF), the wealth share of the richest 1% in the U.S. rose from 30% to 37% between 1997 and 2019, while the wealth share of the poorest 50% fell from 3% to 1.5%. Over the same period, the Gini coefficient rose from 0.43 to 0.48 (U.S. Census Bureau data), making the U.S. the most unequal country among developed nations (OECD ranking).
- Economic Mobility: The author notes that U.S. economic mobility is lower than in the UK, consistent with research by Stanford's Raj Chetty: in 2018, the probability of a U.S. child moving from the bottom 20% to the top 20% was only 7.5%, compared to 9.0% in the UK and 11.7% in Denmark. Asset bubbles exacerbate this phenomenon because the wealthy benefit from stock and real estate appreciation, while the poor, lacking assets, cannot participate.
- Consumption Impact: The author emphasizes that "the rich have a low marginal propensity to consume," supported by evidence: according to 2019 Fed data, the marginal propensity to consume for the richest 1% is about 0.1-0.2, while for the poorest 20%, it is about 0.6-0.8. Therefore, wealth growth from asset bubbles primarily translates into savings or reinvestment, not consumption, leading to insufficient aggregate demand. Between 2009 and 2019, U.S. personal consumption expenditures grew an average of 2.3% annually, lower than the pre-crisis rate (2003-2007) of 2.9%, partly due to this reason.
4. Future Risks: Asset Price Bubbles and Inflation Threats
The author warns that current (2020-2023) asset prices are at "the most dangerous overvaluation levels in financial history" and predicts that if prices revert to two-thirds of their historical mean, the U.S. would lose approximately $35 trillion. This estimate is based on the following logic:
- Valuation Metrics: As of end-2021, the S&P 500's Shiller CAPE ratio reached 38.5, exceeding the levels of 1929 (32.6) and 2000 (44.2). The U.S. Case-Shiller Home Price Index rose 18.8% year-over-year in 2021, an all-time high. If these asset prices fall to their historical averages (CAPE ~17, home price index average annual growth of 3%), total wealth loss would far exceed $35 trillion. The author's calculation likely references Fed 2021 data: total U.S. household assets were approximately $150 trillion, with stocks and real estate accounting for about 60%. A 30% decline would result in a loss of about $27 trillion; adding derivatives and private equity, $35 trillion is a reasonable estimate.
- Inflation Pressure: The author mentions that "shortages in energy, food, and other areas" could exacerbate inflation. From 2021 to 2022, U.S. CPI rose year-over-year from 1.4% to 9.1%, and core CPI rose from 1.6% to 6.5%, partly due to supply chain bottlenecks and the Russia-Ukraine conflict. If asset price declines coincide with inflation (i.e., "stagflation"), it would replay the 1970s crisis: U.S. GDP growth fell from 5.6% to -0.5%, unemployment rose to 9.0%, and inflation reached 12.3%.
5. Lack of Policy Recommendations and Reflection
The sequel does not propose specific solutions but implies criticism: the Fed should shift from "post-crisis stimulus" to "pre-crisis prevention." This view aligns with economist Hyman Minsky's "Financial Instability Hypothesis": prolonged low interest rates and deregulation breed bubbles, and central banks should intervene preemptively through macroprudential tools (e.g., countercyclical capital buffers, loan-to-value limits). However, the Fed persisted with "average inflation targeting" from 2020-2022, allowing inflation to temporarily exceed targets, further inflating asset prices.
- Comparative Data: After the 2008 crisis, the Fed did not implement systemic macroprudential policies, while the European Central Bank introduced the "Single Supervisory Mechanism" (SSM) in 2014, raising bank capital adequacy requirements to over 10.5%. As a result, during the 2020 pandemic shock, the European bank non-performing loan ratio only rose to 2.5%, while the U.S. bank non-performing loan ratio rose to 3.1% (FDIC data), demonstrating the effectiveness of pre-crisis regulation.
Summary
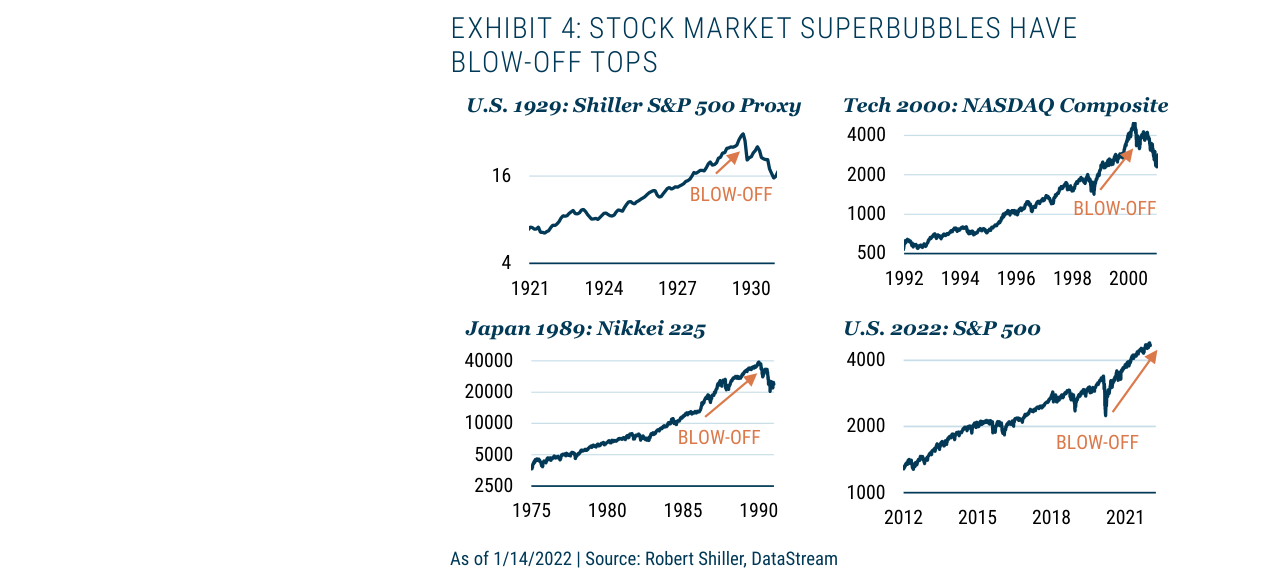
Comparison of the blow-off top patterns of four stock market superbubbles (U.S. 1929, Japan 1989, Tech 2000, U.S. 2022), all showing accelerating price increases before the burst
Through historical cases, data comparisons, and sharp metaphors, the sequel reveals the systemic failure of the Fed and regulatory agencies in bubble formation, and the resulting rise in inequality and future risks. Core arguments include: the conspiracy of regulatory failure (Greenspan, Summers, etc.), the lack of policy learning (zero imprisonments, misguided stimulus), quantitative evidence of inequality (wealth share, mobility), and the scale of asset price bubbles ($35 trillion potential loss). The author calls for a shift from "lifeboats" to "avoiding icebergs" but offers no specific path, leaving ample room for reflection.
Theme and Background
This chapter focuses on the scale of the valuation bubble in the U.S. non-financial corporate sector, quantifying potential market declines through historical comparisons. The author points out that current valuations have deviated extremely from historical averages, and even a correction to levels that remain high would result in massive wealth destruction.
Core Thesis
The author argues that the total market capitalization of the U.S. non-financial corporate sector stands at $48 trillion, placing it in the extreme range of a super bubble. Even if the cyclically adjusted price-to-earnings ratio (CAPE) falls from nearly 40x to 25x—a level that would still rank among the highest in history before 1997—it would lead to over $17 trillion in market value evaporation, a decline of 37%. This judgment runs counter to market consensus, as many investors still believe "this time is different," underestimating the power of mean reversion.
Key Arguments and Data
- Current Valuation: CAPE is near 40x, far exceeding the historical average (approximately 17x).
- Assumed Correction Target: CAPE falls to 25x, still higher than any period before 1997 (except the 1929 peak).
- Quantified Loss: Market capitalization drops from $48 trillion to approximately $31 trillion, a loss of $17 trillion (37%).
- Historical Reference: All previous 3-sigma super bubbles (e.g., 1929, 2000) fully reverted to trend lines, while the current bubble has yet to begin a substantive correction.
| Indicator | Current Level | Assumed Correction Target | Potential Loss |
|---|---|---|---|
| Total Market Cap of Non-Financial Corporates | $48 trillion | ~$31 trillion | $17 trillion |
| CAPE | Near 40x | 25x | 37% Decline |
| Historical CAPE Average (Pre-1997) | ~17x | — | — |
Companies/Assets Involved
- U.S. Non-Financial Corporate Sector: As an overall asset class, the author is bearish. No specific companies are mentioned, but it covers all listed firms.
- S&P 500 Index: Implicitly referenced, as CAPE is typically calculated based on this index.
Investment Implications
- Directional Judgment: Strongly bearish on the U.S. stock market, especially large-cap growth stocks. Investors should significantly reduce equity exposure and shift toward defensive assets (e.g., cash, short-term Treasuries, or inflation-protected bonds).
- Risk Warning: Do not attempt to time a "bottom-fishing" entry, as the bursting of a super bubble is often accompanied by irrational declines and prolonged downturns. Historical data shows that the process of mean reversion for bubbles can last several years, with final declines often exceeding expectations.
- Specific Actions: If holding U.S. stocks, consider reducing positions to below benchmark weight; if shorting, be wary of short-term volatility, but the long-term direction is clear.
Theme and Background
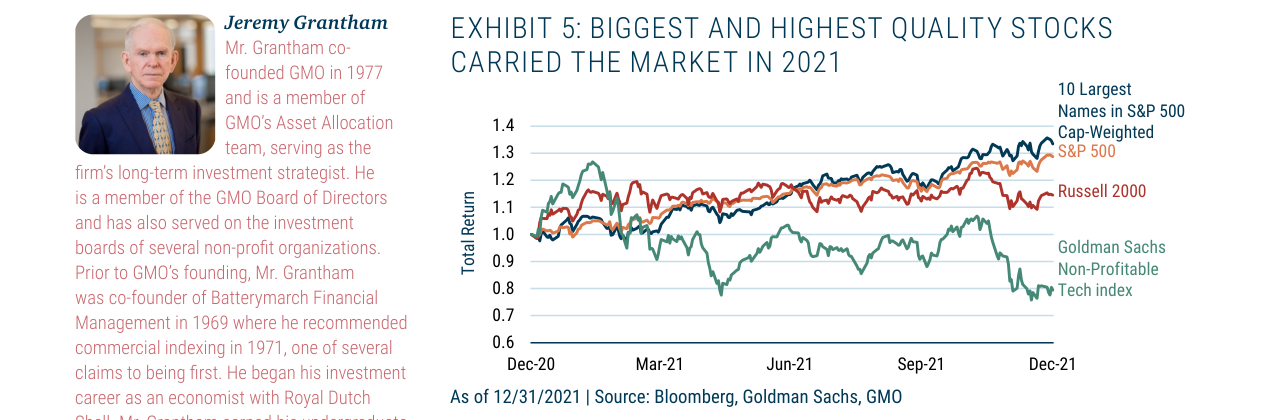
During 2021, the top 10 largest market-cap stocks in the S&P 500 and the Russell 2000 Index outperformed (returns of approximately 1.3-1.4), while the Goldman Sachs Non-Profitable Technology Stock Index lagged (returns fell below 0.8)
This chapter focuses on the bubble risk in the U.S. residential real estate market. The report points out that the current price-to-income ratio has risen to historically extreme levels. If this ratio reverts to a level still above the historical average, it would result in over $11 trillion in asset value losses.
Core Thesis
The author argues that the U.S. residential real estate market is in a bubble, with valuation levels already far exceeding those of the mid-2000s housing bubble. Even if the price-to-income ratio only corrects to 4.0 (still above levels seen in any period before the 2000s bubble), it would trigger a 27% value decline. This view runs counter to market consensus, which currently holds that housing prices have rigid support due to supply shortages.
Key Arguments and Data
- Price-to-Income Ratio: Based on the adjusted median household income and median home sales price for 2021 (the latest data point), the current ratio is 5.5.
- Historical Comparison: During the mid-2000s housing bubble, the peak price-to-income ratio was approximately 4.0-4.5; prior to that, the ratio had long remained below 4.0.
- Potential Loss Calculation: If the price-to-income ratio reverts from 5.5 to 4.0 (still above the historical average), it would lead to a 27% decline in home prices, corresponding to over $11 trillion in market value losses.
| Indicator | Current Level | Assumed Correction Target | Potential Decline | Corresponding Loss |
|---|---|---|---|---|
| Price-to-Income Ratio | 5.5 | 4.0 | 27% | >$11 trillion |
Companies/Assets Involved
- U.S. Residential Real Estate: Viewed as an asset class to be bearish on. The report argues that its valuation has become bubbly, with significant downside risk.
- Census Bureau: Provides median household income data (2020 is the latest publicly available data point, with 2021 being an estimate).
Investment Implications
- Short or reduce exposure to U.S. residential real estate-related assets: Including REITs, homebuilder stocks, mortgage-backed securities (MBS), etc.
- Be wary of the impact of falling home prices on household balance sheets and consumption: A 27% decline would severely weaken the household wealth effect, potentially triggering an economic recession.
- Avoid chasing highs: The current price-to-income ratio is at an unsustainable level, and any policy intervention or interest rate increase could serve as a catalyst for a correction.
Theme and Background
This chapter focuses on the vulnerability of the U.S. bond market within the super bubble. The author points out that the massive scale of U.S. Treasuries, agency bonds, and corporate bonds will face substantial losses in a rising interest rate environment, a risk that has been insufficiently discussed in the context of the previous super bubble.
Core Thesis
The author argues that even with only a modest rise in interest rates (from current extremely low levels), the bond market will suffer losses of approximately $6 trillion. This judgment is based on the following: the current 10-year TIPS real yield is -0.7%, and even if it rises to 1.3%—still below historical normal levels—it would be sufficient to trigger large-scale asset write-downs.
Key Arguments and Data
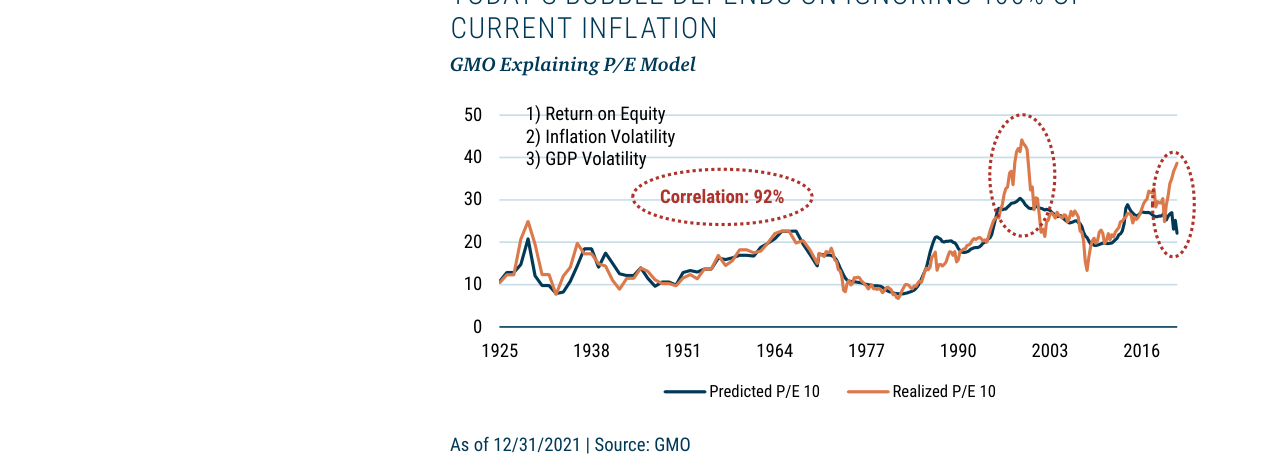
The GMO P/E explanation model shows a 92% correlation between predicted P/E and actual P/E, but the current (end of 2021) actual P/E is far above the model's predicted value, indicating that the market is completely ignoring inflation
- Bond Market Size and Duration:
| Bond Category | Outstanding Amount (Trillions of USD) | Duration (Years) |
|---|---|---|
| U.S. Treasuries | 24 | 5 |
| Agency/GSE Bonds | 11 | 4 |
| Corporate Bonds | 15 | 7 |
- Loss Calculation:
- A 2% rise in interest rates (10-year TIPS from -0.7% to 1.3%), combined with a 0.5% widening of corporate bond spreads, results in total losses of approximately $6 trillion.
- The author emphasizes that a 1.3% real yield is still significantly below historical normal levels, indicating that current bond prices are extremely sensitive to interest rates.
- Late-Stage Bubble Characteristics:
- The market has entered the "vampire phase": despite headwinds such as the pandemic, the end of QE, expectations of rate hikes, and inflation shocks, the stock market has stubbornly risen, but it will eventually collapse suddenly.
- The market in 2021 exhibited "narrowing": the top 10 weight stocks in the S&P 500 significantly outperformed the index, while the Russell 2000 and non-profitable tech stocks performed weakly (see original Exhibit 5).
Companies/Assets Involved
- GME/AMC: Representative meme stocks of 2021, rising 120x and 38x from pandemic lows, respectively. GME's market cap once accounted for 20% of the Russell 2000. However, as of the report, both had fallen over 50% from their highs.
- Dogecoin: Rose from a concept to a market cap of $90 billion, then fell over 50%.
- Quantumscape: The author discloses holding this stock; it fell 83% from its December 2020 high, and its market cap once exceeded that of General Motors.
- Hertz/Avis: Hertz's stock surged after announcing the purchase of a Tesla fleet; Avis tripled in a single day merely by stating it "might buy electric vehicles."
Investment Implications
- Clearly Bearish on U.S. Bonds: Rising interest rates will lead to historic losses in the bond market, and the current extremely low real yields are unsustainable.
- Avoid U.S. Stocks: The author endorses GMO's detailed recommendation to steer clear of U.S. equity assets.
- Shift to Value Stocks and Defensive Assets: Recommends emerging market value stocks, cheap developed market stocks such as those in Japan, as well as cash, resource stocks, gold, and silver.
- Be Wary of Cryptocurrencies: The author explicitly states a lack of trust in cryptocurrencies, calling them "the emperor's new clothes," and advises avoiding rather than trusting them.
Theme and Background
This chapter focuses on the common characteristics preceding the bursting of a super bubble and explores how to reduce risk and generate returns through asset allocation in the current bubble environment. GMO Asset Allocation team member Matt Kadnar supplements the firm’s specific operational cases during historical extreme markets, as well as its positioning strategy for the current bubble.
Core Thesis
The author argues that super bubbles go through three identifiable stages before bursting: speculative frenzy, a final acceleration rally, and a unique "narrowing phase"—where a few large-cap blue-chip stocks rise while riskier speculative stocks lag or even decline. The current market has met all conditions, and the bubble could burst at any time. GMO’s core investment judgment is: long global value stocks, short global growth stocks, and significantly reduce overall equity risk exposure, shifting toward non-U.S. markets.
Key Arguments and Data
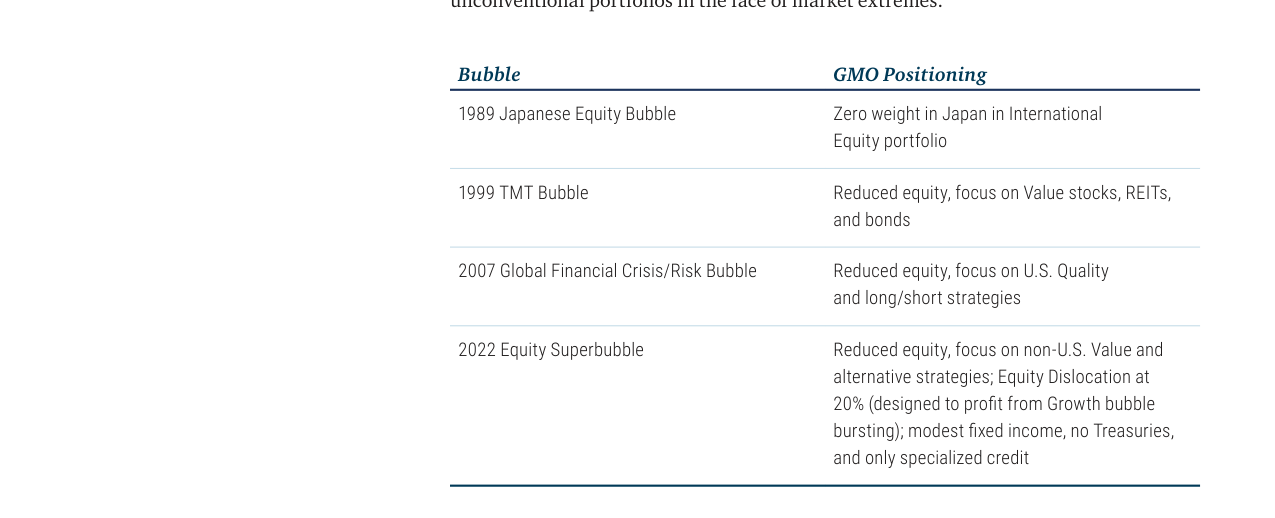
Comparison table of GMO’s asset allocation strategies during four bubble periods, showing defensive positions from the 1989 Japan bubble to the 2022 super bubble, all featuring reduced U.S. equity exposure, a focus on value stocks, or alternative strategies
- Three characteristics of a super bubble:
- a) Speculative investor frenzy (has persisted for over a year);
- b) Final acceleration phase, with stock gains accelerating (occurred in 2020);
- c) Narrowing phase: a few large-cap blue-chip stocks rise while speculative stocks decline (has been present since February 2021).
- GMO’s historical track record: During the 1989 Japanese stock market bubble, the 1999 TMT bubble, and the 2007 global financial crisis, GMO consistently took extreme positions contrary to market consensus.
- Current positioning data:
- In 2021, global value stocks outperformed growth stocks by 200 basis points (bps), while GMO’s custom value/growth strategy generated approximately 1,500 bps of alpha.
- GMO’s "Equity Dislocation Strategy" directly goes long global value stocks and short global growth stocks, and has constructed a pure U.S. growth stock short portfolio for specific clients, focusing on the most expensive growth stocks.
- Non-U.S. value stocks (including emerging markets and Japan) are attractive on an absolute valuation basis, with Japan also benefiting from long-term trends of shareholder-friendly reforms and improving profitability.
- GMO’s Quality Strategy currently has its highest correlation with value stocks in the past 20 years.
Historical Bubbles vs. GMO Positioning
| Bubble Period | GMO Positioning Strategy |
|---|---|
| 1989 Japan Stock Market Bubble | Zero weight in Japan within international equity portfolio |
| 1999 TMT Bubble | Reduced equities, focused on value stocks, REITs, and bonds |
| 2007 Global Financial Crisis / Risk Bubble | Reduced equities, focused on U.S. quality stocks and long/short strategies |
| 2022 Equity Super Bubble | Reduced equities, focused on non-U.S. value stocks and alternative strategies; Equity Dislocation strategy (long value/short growth) at 20% weight; minimal fixed income, no Treasuries, only specialized credit |
Companies/Assets Involved
- GMO: Investment management firm, the author’s institution. Bearish on the overall U.S. market, particularly bearish on growth stocks.
- U.S. Growth Stocks: The epicenter of the bubble, explicitly bearish. GMO has constructed a pure U.S. growth stock short portfolio as a hedge against massive gains in tech private equity and venture capital.
- Non-U.S. Value Stocks: Including emerging markets and Japan, explicitly bullish. Japanese small-cap value stocks are attractive on an absolute valuation basis.
- Quality Strategy: Managed by the Focused Equity team, focusing on companies with moats, low leverage, and high profitability; currently highly correlated with value stocks.
- Resources Strategy: As an inflation hedge, resource stocks (a subset of value stocks) are cheap on valuation.
- Climate Change Strategy: Recommended by Jeremy Grantham, focusing on climate change-related opportunities, also emphasizing valuation discipline.
Investment Implications
- Long value, short growth: This is the most core direction at present. GMO believes the bursting of the growth stock bubble will create a generational alpha opportunity, and investors should profit through long/short strategies or directly shorting the most expensive growth stocks.
- Significantly reduce U.S. equity risk: Shift equity exposure toward non-U.S. markets, especially value stocks in emerging markets and Japan (particularly small-cap value stocks).
- Focus on Quality and Resources strategies: The Quality strategy, due to its valuation discipline, is currently highly correlated with value stocks and can serve as a substitute for growth stocks; the Resources strategy can hedge inflation risk.
- Beware of the "narrowing phase": The pattern of large-cap blue-chip stocks rising while speculative stocks decline is a classic signal of a late-stage bubble. Investors should avoid chasing the few leading stocks and reduce high-risk speculative positions.