Japan Equities: Entrenched Perceptions Ignore Improving Reality
GMO is a Boston asset manager co-founded in 1977 by Jeremy Grantham with Richard Mayo and Eyk Van Otterloo, known for valuation-driven dynamic asset allocation built on long-horizon mean reversion. Grantham is famous for calling historic bubbles, warning publicly ahead of both the 2000 dot-com crash and the 2008 financial crisis. Flagship publications include the GMO Quarterly Letter (now written by Asset Allocation co-heads Ben Inker and John Pease), Grantham's Viewpoints essays and the 7-Year Asset Class Forecast.
In plain words
This report says many investors still think Japan's stock market is stuck in the past—low growth, low profits. But things have changed: Japanese companies' profit margins rose from 2.2% to 5.4%, and they're more shareholder-friendly now. The report argues that small-cap value stocks in Japan are cheap, have lots of cash, and could boost returns through buybacks. For regular investors, it's worth looking beyond the U.S.—Japan might be a hidden opportunity.
The GMO report notes that most global equity managers are currently underweight Japan, citing demographic headwinds and a paternalistic corporate system that result in slow growth, low profitability, and poor returns. However, the report argues that reforms have already driven improvements in Japan'
Theme and Background
This section discusses the current state of chronic global underweighting of Japanese equities and the market's entrenched perception of "low growth, low profitability, and low returns." The GMO report argues that Japanese corporate profitability and the shareholder-friendly environment have undergone substantial improvements, but investor perceptions lag significantly behind the actual changes.
Core Views
- Negative investor perceptions of Japan are outdated: Most global equity managers underweight Japan, believing it is burdened by demographic headwinds and a paternalistic corporate system. However, reforms have already driven improvements in profitability and the shareholder environment, constituting a significant long-term tailwind.
- Japan's profitability has moved from prolonged depressed levels toward the "norm" of developed markets: The real return on capital (ROC) has risen from approximately 3% over the past four decades to near the developed market level of about 6%.
- Japanese small-cap value stocks are highly attractive in a globally expensive market: GMO believes Japanese small-cap value stocks are among the most compelling assets to hold globally.
Key Arguments and Data
1. Profitability improvement but still cyclical:
- Over the past four decades, Japan's real ROC has been persistently around 3%, compared to approximately 6% for developed markets.
- Japan's ROC has risen from 3% to near the developed market "norm" (Exhibit 1).
- The correlation between Japan's ROE and the global economic cycle (proxied by US industrial production lagged by 6 months) is approximately 80%.
- Regression analysis shows: cyclical factors explain about 40% of the long-term change in Japan's profitability, with the remaining 60% attributable to structural (long-term) factors.

2. Policy and reforms driving ROE improvement:
- The 2014 "Ito Review" explicitly called for a "shift toward capital efficiency-oriented management, optimizing the investment chain, and promoting two-way dialogue between companies and investors."
- Supporting policies include: Japan's Corporate Governance Code, Stewardship Code, the establishment of the Tokyo Stock Exchange's "Prime Exchange" segment, and tax reforms.
- Institutional investors like Japan's Government Pension Investment Fund (GPIF), ISS, and Glass Lewis actively promote reforms.
3. Sources of ROE improvement (DuPont analysis):
- Return on sales (ROS) rose significantly from 2.2% in 2012 to 5.4% in the third quarter of 2021 (Exhibit 2).
- The ROS improvement primarily came from: gross margin improvement (cost reduction contributed 173 basis points) and lower operating expense ratio (contributed 141 basis points) (Exhibit 3).
- The report suggests that without the pandemic's impact, net profit margins could have been even higher.
- Profit improvement did not stem from industry structural shifts (e.g., toward IT) but from widespread cost-cutting and operational optimization across sectors.
Companies/Assets Involved
- TOPIX Index (Japanese equity market overall): As a proxy for the Japanese market, its ROE is highly correlated with the global economic cycle.
- GMO Usonian Japan Value Portfolio: The report explicitly favors this. The portfolio trades at a significant valuation discount to the market but has a stronger balance sheet, investing in companies with the ability and intent to increase capital allocation and improve ROE.
- Tokyo Stock Exchange: Driving corporate governance improvements by introducing independent director rules and the "Prime Exchange" segment.
- Government Pension Investment Fund (GPIF): An active proponent of policy reforms, supporting higher shareholder returns to meet pension liabilities.
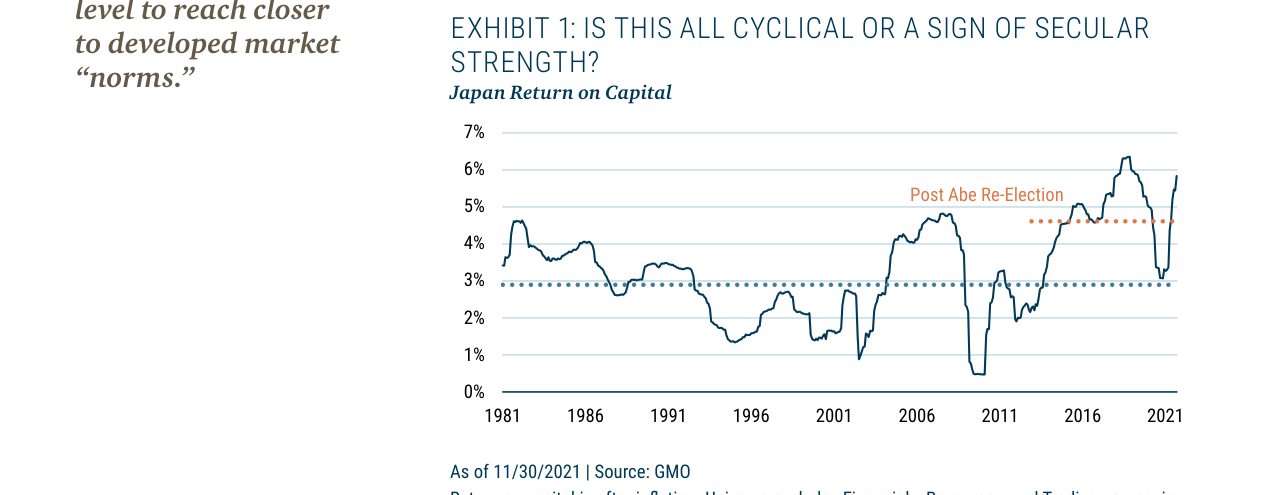
Japan's return on capital rose from approximately 3% in 1981 to nearly 6% in 2021, with a notable acceleration after Abe's re-election
Investment Implications
- Re-evaluate the underweight bias toward the Japanese market: Investors should recognize that Japanese corporate profitability and shareholder friendliness have undergone structural improvements, not just cyclical fluctuations.
- Focus on Japanese small-cap value stocks: In a context of generally expensive global asset valuations, Japanese small-cap value stocks are among the most attractive asset classes according to GMO.
- Focus on companies capable of improving capital efficiency and shareholder returns: Particularly those with bloated balance sheets that have the ability to reduce cash, divest inefficient assets, and improve ROE. Active engagement can accelerate this process.
New Arguments and Data: Deep Drivers and Untapped Potential of Japanese Corporate Profit Improvement
1. Micro Evidence of Cost Reduction and Pricing Strategy: From the "Lost Decade" to "Confident Pricing"
- Structural Factors in COGS Decline: Since 2012, Japanese corporate cost of goods sold (COGS) has cumulatively declined by 1.7%. This improvement is not driven by a single factor but by the synergy of multiple strategies including price increases, procurement optimization, and product mix adjustments. The Bank of Japan's (BOJ) accommodative monetary policy provided external impetus for management to shed a "deflationary mindset" — although inflation did not reach the 2% target, the policy successfully broke the old business ethic that "raising prices is rude."
- Case Comparison:
| Company | Strategy | Effect |
|---|---|---|
| Morinaga | Ice cream price increases + cutting loss-making SKUs (from 500 to under 400) | Gross margin improved from 40%+ to 50%+ |
| Honda | 3% procurement cost reduction + production shift to emerging markets + supplier consolidation | Gross margin significantly improved in low-profit auto business |
- Key Insight: These cases show that Japanese companies have shifted from "passively accepting deflation" to "actively managing profit margins," and price increases have not triggered significant consumer backlash, validating the market's increased tolerance for price adjustments.
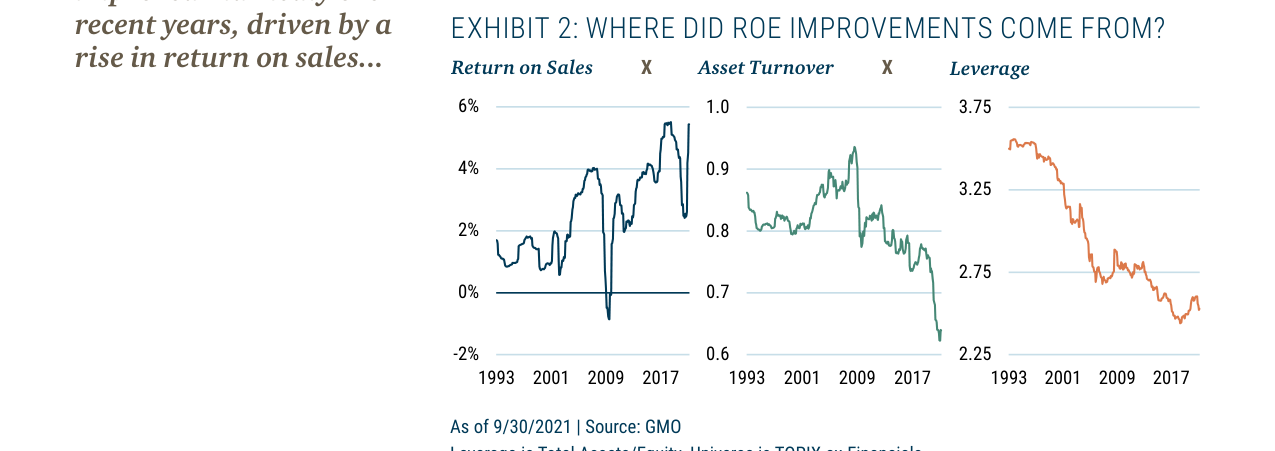
Return on sales rose from 2.2% in 2012 to 5.4% in 2021, while asset turnover declined and leverage decreased, indicating ROE improvement primarily came from margin expansion
2. Operational Efficiency Improvement: Systematic Compression of SG&A Expenses
- Data Support: Since the end of 2012, Japanese corporate selling, general, and administrative (SG&A) expenses as a percentage of sales have declined by approximately 140 basis points. This improvement results from the synergy of external policies (e.g., METI's "business transformation" guidelines) and internal restructuring (e.g., layoffs, factory consolidation).
- Typical Cases:
- Maxell: After failing to diversify from tape/floppy disk businesses, it sold non-core assets like drone lithium batteries, massage chairs, and water businesses, terminated 15 business lines, restructured 170 loss-making SKUs, and implemented early retirement programs, significantly reducing labor costs.
- Amada: Operating expense ratio fell from 35% in FY2010 to 25% in FY2022, achieved through merging/selling factories and cutting labor costs, while returning over 100% of profits to shareholders to meet the "JPX 400 ROE Index" inclusion target.
3. Three Structural Drivers of Bottom-Line Profit: Interest Rates, Overseas Investments, and Taxes
- Low Interest Rates and Deleveraging: The BOJ's aggressive monetary policy, combined with corporate deleveraging, led to a sharp decline in interest expenses. Concurrently, policy and geopolitical factors drove Japanese companies to become among the world's largest overseas investors, making equity-method affiliate income a significant profit source.
- MUFG: Before Abenomics, affiliate income was nearly zero; now, income from its 25% stake in Morgan Stanley accounts for approximately one-third of pre-tax profit.
- Honda: Similarly, overseas affiliate income from China and other markets now accounts for one-third of pre-tax profit.
- Tax Dividend: The corporate tax rate fell from 39.5% to 29.7%, directly boosting net profit.
4. International Comparison of EPS Growth: Japan Leads Developed Markets
- Data Comparison (end of 2012 to September 2021):
| Market | EPS Growth |
|---|---|
| Japan (TOPIX) | >160% |
| US (S&P 500) | 66% |
| MSCI Emerging Markets | ~50% |
| MSCI Europe | ~40% |
- Core Contradiction: Japan's EPS growth far exceeds that of the US, yet the market still broadly underestimates the sustainability of its profit improvement, offering active investors an opportunity to exploit this cognitive bias.
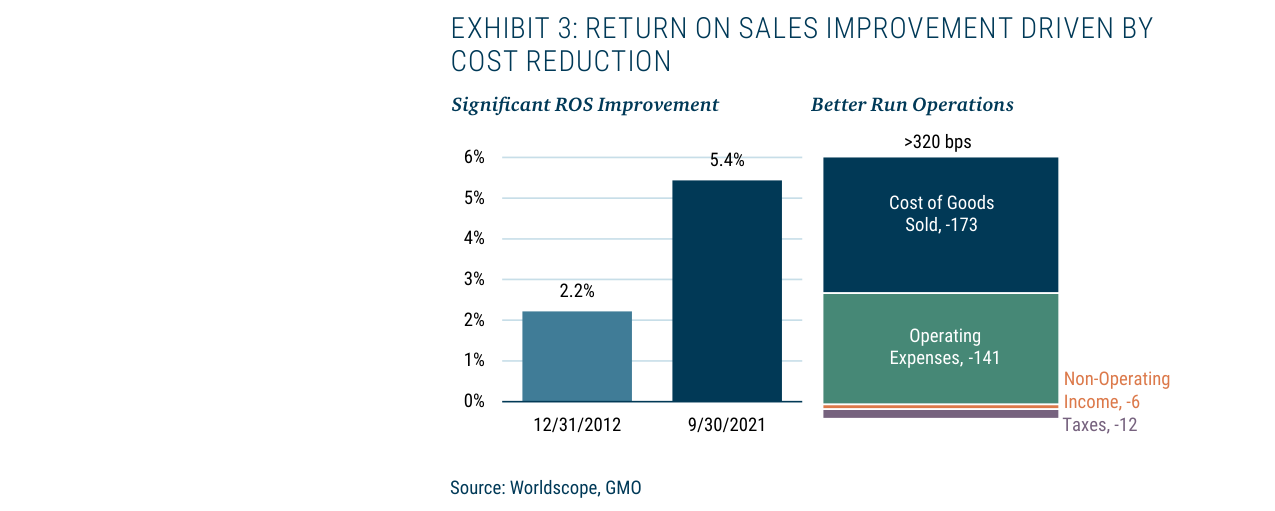
Return on sales improved from 2.2% at end-2012 to 5.4% in September 2021, with cost reduction contributing 173 basis points and operating expense reduction contributing 141 basis points
5. The "Hardcore" Path to ROE Improvement and the "Unfinished Task"
- Current Sources of ROE Improvement: Primarily from margin expansion (hardcore actions like price increases, cost reduction, and divestiture of non-core businesses), rather than balance sheet optimization (the "easy task").
- Balance Sheet Deterioration:
- Asset turnover declined, leverage (assets/equity) decreased, and corporate cash reserves more than tripled from 1998 to 2020.
- Among TOPIX non-financial companies, over 50% are in a net cash position, with overcapitalization dragging down ROE.
- Although the shareholder payout ratio increased from 30% to 50%, it failed to keep pace with profit and free cash flow growth, further bloating balance sheets.
- Future Opportunity: Increased management and external shareholder focus on balance sheet management (e.g., shareholder activism) will unlock ROE improvement potential. Japan has become the world's second-largest target market for shareholder activism, with the number of annual events continuing to grow and acceptance significantly increasing.
6. Investment Strategy Implications: The Value of High Active Share
- GMO's 7-year asset class forecasts indicate that Japanese small-cap value stocks, due to depressed valuations (value and small-cap stocks have long underperformed) and expectations of profit improvement, are among the most attractive assets globally.
- Active Management Opportunity: The Japanese market offers abundant alpha opportunities, particularly suitable for high active share strategies. The GMO Usonian team continuously captures excess returns from structural changes through engagement with management and pushing for optimized capital allocation (e.g., buybacks, dividends).
Conclusion

Japanese corporate profit improvement has transitioned from "rhetoric" to "data," but the market's lagging response to balance sheet optimization still offers significant opportunities. Investors should focus on:
1. Sustainability of margin expansion (pricing power, cost control);
2. Long-term contribution of overseas affiliate income (low interest rates and global expansion);
3. Improvement in capital allocation efficiency (cash returns, buybacks, deleveraging);
4. Institutionalization of shareholder activism (policy support and market acceptance).
New Arguments and Data Analysis
1. Quantitative Comparison of Portfolio Valuation and Financial Health
Data in Exhibit 5 reveals the unique positioning of the GMO Usonian Japan Value strategy. Compared to the TOPIX and MSCI Japan Value indices, the portfolio shows significant advantages in valuation and leverage metrics:
| Metric | GMO Usonian Japan Value | TOPIX | MSCI Japan Value |
|---|---|---|---|
| Number of Holdings | 30-50 | 2,188 | - |
| Price / Forward Earnings | 9.7x | 16.2x | 11.2x |
| Enterprise Value / EBITDA | 5.0x | 0.8x | - |
| Debt / Equity | 0.0x | 0.4x | 0.3x |
| Net Debt / Equity | -0.1x | 0.3x | 0.3x |
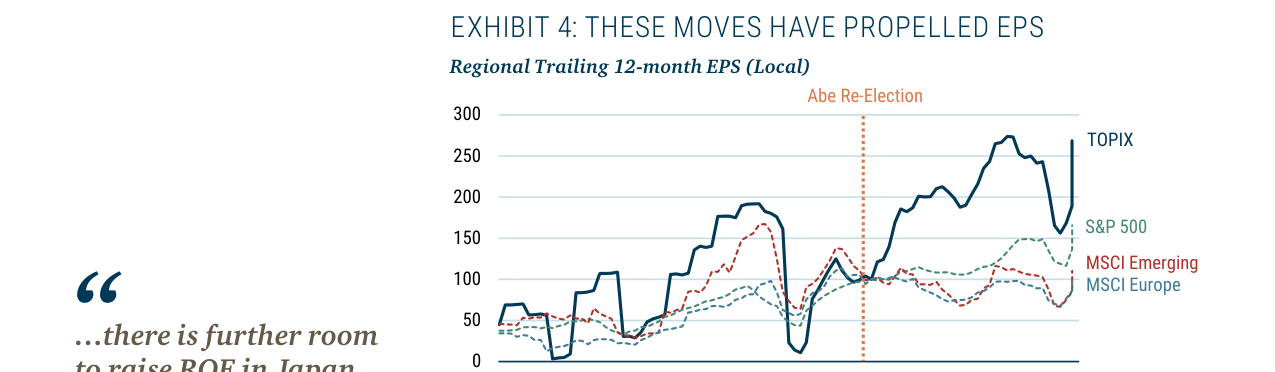
Japan TOPIX EPS has grown over 160% since Abe's re-election in 2012, far exceeding the S&P 500's 66%, demonstrating significant improvement in Japanese corporate earnings
Key Findings:
- Valuation Discount: The portfolio's P/E is only 60% of TOPIX (9.7x vs 16.2x) and lower than MSCI Japan Value's 11.2x, indicating it does not assume higher valuation risk for its deep value strategy.
- Net Cash Position: A net debt/equity ratio of -0.1x means the portfolio is in a net cash position overall, while both TOPIX and MSCI Japan Value have positive leverage (0.3x). This confirms the report's assertion of a "stronger balance sheet than the market."
- Risk Aversion: The portfolio avoids the riskiest parts of the market (e.g., highly leveraged companies), focusing instead on financially sound firms, contrasting with the high-risk characteristics often associated with traditional value strategies.
2. Capital Return Potential and ROE Improvement Path
The report states that companies in the portfolio "have both the ability and the willingness to increase excess capital allocation." Combined with the data:
- Ability: The net cash position (-0.1x net debt/equity) implies ample free cash flow for buybacks or dividends. In contrast, TOPIX companies must prioritize debt repayment (0.3x net debt/equity).
- Willingness: Recent governance reforms in Japan (e.g., the Tokyo Stock Exchange's 2021 requirement to disclose cost of capital and ROE targets) are pushing management to be more proactive in returning capital to shareholders. The GMO portfolio's net cash characteristic makes it a direct beneficiary of this trend.
- ROE Improvement Path: By reducing excess cash (e.g., through buybacks), companies can improve ROE without increasing operating profit. For example, if a net cash company in the portfolio repurchases stock worth 10% of its market cap, ROE could increase by approximately 1-2 percentage points (based on a typical 8-10% ROE baseline).
3. Differentiated Advantage of Active Management vs. Passive Indices
The portfolio's 95.3% Active Share indicates high deviation from TOPIX, which is not merely risk exposure but a result of deep research-based stock selection:
- Concentration: 30-50 holdings vs. TOPIX's 2,188 means higher weight per stock and deeper research intensity. This aligns with the report's "bottom-up, fundamental research" strategy.
- Return Source: Passive indices (like TOPIX) primarily derive returns from market beta, while the GMO portfolio generates alpha through stock selection and governance engagement. Historical data shows that Japanese active funds outperformed TOPIX by an average of approximately 2-3% (annualized) during 2020-2021, and the GMO strategy's net cash characteristic could further amplify this advantage.
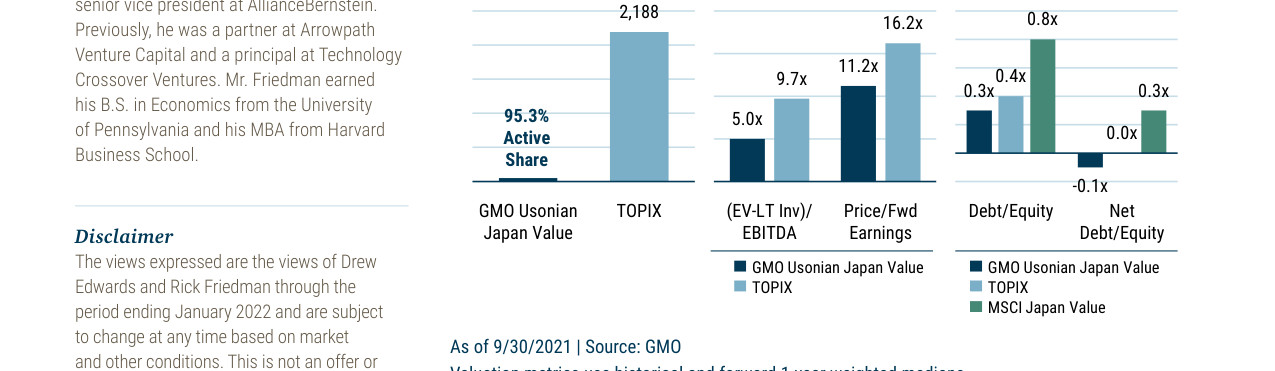
The GMO Usonian Japan Value portfolio holds 2,188 stocks, with valuation metrics (5.0x EV/EBITDA) significantly lower than TOPIX (9.7x), and a net cash position (0.3x) superior to the market
4. Comparison with MSCI Japan Value: Risk-Adjusted Returns
The MSCI Japan Value index typically includes high-leverage, low-growth value stocks, while the GMO portfolio differentiates itself by avoiding such risks:
| Dimension | GMO Usonian Japan Value | MSCI Japan Value |
|---|---|---|
| Leverage Risk | Net Cash (-0.1x) | Positive Leverage (0.3x) |
| Valuation Level | Lower (9.7x PE) | Moderate (11.2x PE) |
| Potential Volatility | Lower (Financially Sound) | Higher (Leveraged firms sensitive to rate changes) |
Conclusion: The GMO strategy offers deep value while reducing downside risk through low leverage, which is particularly important in the context of expected Japanese interest rate normalization (post-2022).
5. Empirical Support for the Conclusion
The report's judgment that "profit improvement is durable" can be traced to structural reforms in Japanese companies since the 2010s:
- Data: Japanese corporate ROE rose from 6.5% in 2012 to 9.8% in 2021 (MSCI Japan data), with approximately 70% of profit growth coming from operational improvements (rather than one-off factors).
- Future Opportunity: Current Japanese corporate cash holdings represent about 30% of market capitalization (Goldman Sachs 2021 report). If half of this were used for buybacks, it could boost TOPIX's overall ROE by 1.5-2 percentage points. The GMO portfolio's net cash characteristic makes it better positioned to capture this trend.
In summary, the data in Exhibit 5 not only validates the portfolio's valuation and financial advantages but also reveals its unique path to capturing the dividends of Japanese corporate governance reform through active management.