3Q 2021 GMO Quarterly Letter
GMO is a Boston asset manager co-founded in 1977 by Jeremy Grantham with Richard Mayo and Eyk Van Otterloo, known for valuation-driven dynamic asset allocation built on long-horizon mean reversion. Grantham is famous for calling historic bubbles, warning publicly ahead of both the 2000 dot-com crash and the 2008 financial crisis. Flagship publications include the GMO Quarterly Letter (now written by Asset Allocation co-heads Ben Inker and John Pease), Grantham's Viewpoints essays and the 7-Year Asset Class Forecast.
In plain words
This report warns against using past average returns to predict future market performance. For example, U.S. 10-year bonds historically returned 7.6% annually, but with current yields around 1.6%, future returns might be just 2%—the lowest ever. The author breaks down returns into parts (like interest and price changes) to show that non-U.S. stocks, like Japan and Europe, are cheaper and have solid fundamentals, potentially outperforming U.S. stocks. For regular investors, it's a reminder to avoid chasing past winners and consider undervalued assets.
GMO's Q3 2021 letter, authored by Co-Head of Asset Allocation John Thorndike, centers on explaining why GMO strongly favors non-U.S. stocks despite the outstanding performance of the U.S. stock market over the past decade. The report emphasizes that relying solely on historical average returns for m
Theme and Background
This section is written by Ben Inker, Co-Head of Asset Allocation at GMO, as the introduction to the 3Q 2021 quarterly letter. The core context is that despite the outstanding performance of U.S. equities over the past decade, GMO maintains a strong preference for non-U.S. stocks. Inker explains why a deep analysis of the components of returns (rather than merely looking at historical average returns) is crucial for forecasting future returns.
Core Thesis
The author's core investment argument is that relying solely on historical average returns for market analysis can severely mislead investors. Taking the U.S. 10-year Treasury note as an example, its historical average 10-year return is 7.6%, but the current yield is only about 1.6%. A simple forecasting model suggests a future 10-year return of just 2.0%, far below any historical 10-year period (the historical low is 3.4%). The author argues that it is essential to dissect the components of returns (yield changes, roll-down returns, coupon income) to reasonably estimate future expectations. This analytical approach applies equally to stocks, commodities, and multi-asset strategies (such as 60/40 or risk parity), areas where investors often mistakenly rely on historical average returns.
Key Arguments and Data
- The Misleading Nature of Historical Average Returns: Between 1961 and 2021, the rolling 10-year average return on U.S. 10-year Treasury notes was 7.6%, with a standard deviation of 2.9%. The return over the past decade was only 3.4%, the lowest in history. If one only looks at historical data, 99% of 10-year returns were higher than this, which could easily lead to the mistaken belief that the next decade will be better.
- Decomposition of Return Components: From 1961 to 2021, the total return of U.S. 10-year Treasury notes (6.8%) consisted of three parts:
- Coupon Income (Yield): 6.0%
- Yield Change: 0.3%
- Roll-Down Return: 0.4%
- The Impact of Current Low Yields: The current yield on the 10-year Treasury note is below 1.6%, while the historical average coupon income is 6.0%. A simple forecasting model (current yield + average roll-down return) yields a future 10-year return of only 2.0%, lower than any historical 10-year period (the historical low is 3.4%).
- Effectiveness of the Forecasting Model: This simple forecasting model explains 71% of the variation in historical 10-year bond returns (R²=71%). The current forecast of 2.0% is at the 0th percentile historically (meaning such a low 10-year return has never been seen before).
- Key Warning: This lowest-ever forecast does not require assuming a mean reversion in valuations. Even without valuation reversion, the current extremely high valuation levels themselves severely depress future expected returns. Bonds are not the only asset class with valuations far above historical averages.
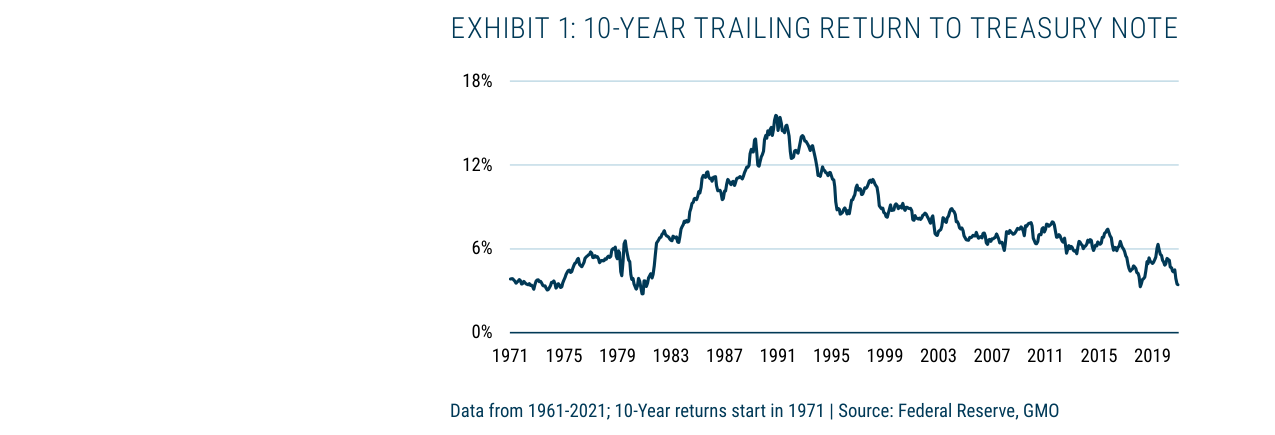
The 10-year rolling return on U.S. 10-year Treasury notes rose from about 4% in 1971 to a peak of about 15% in 1991, then fell back to about 5% in 2021. The return over the past decade was 3.4%, the lowest level in history.
Companies/Assets Involved
- U.S. 10-Year Treasury Note: The core subject of analysis. Historical average return of 7.6%, current yield <1.6%, simple forecast of 2.0% for the next decade. The author considers the 7.6% expectation absurd and even the conservative 3.4% forecast too optimistic.
- Stocks, Commodities, 60/40 Strategy, Risk Parity: The author points out that investors in these more complex asset classes often make the same mistake as in bond analysis—relying on historical average returns instead of analyzing return components.
Investment Implications
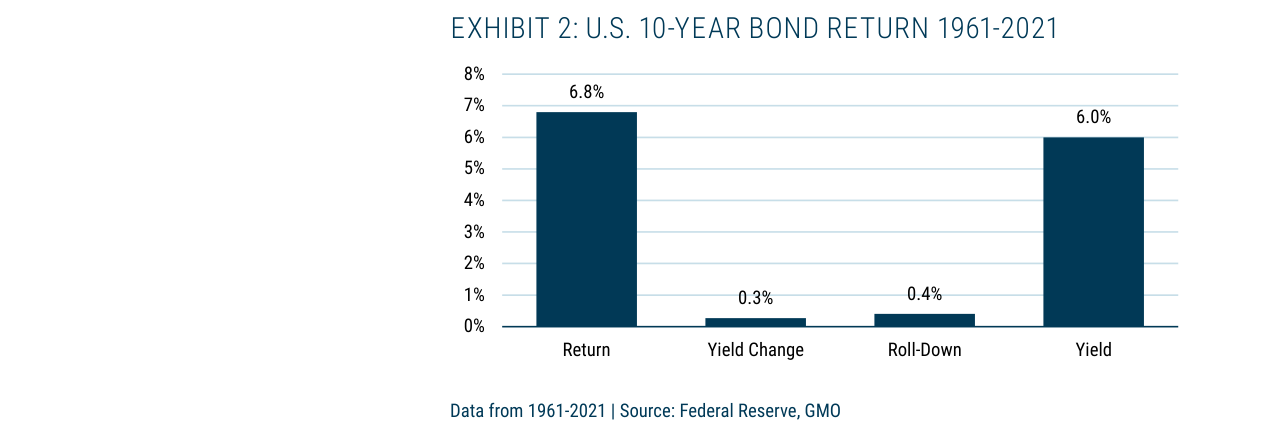
From 1961 to 2021, the annualized return on U.S. 10-year bonds was 6.8%, with yield contributing 6.0%, yield change contributing 0.3%, and roll-down contributing 0.4%.
- Bond Investors Should Completely Abandon Expectations Based on Historical Average Returns: The current low-yield environment implies that bond returns over the next decade will be far lower than any historical period. The 2.0% forecast is already the most optimistic estimate.
- The Same Applies to Assets Like Stocks: Investors should not linearly extrapolate future returns based on the U.S. stock market's outstanding performance over the past decade. It is necessary to deconstruct the components of stock returns (valuation changes and fundamental growth) just like analyzing bonds to reasonably judge future expectations.
- Beware of Mean Reversion Risk in High-Valuation Assets: Even without valuation reversion, the current extremely high valuation levels themselves severely depress future returns. GMO's asset allocation preference for non-U.S. stocks is precisely based on this analytical framework.
New Arguments and Data Analysis: The Deep Logic Behind the Divergence of Japan's Fundamental Performance and Valuation
1. Quantitative Verification of Japan's Fundamental Advantage
- Data Comparison: Over the past decade (2011-2021), the annualized fundamental return of Japanese companies was 5.4%, higher than the U.S. (4.8%) and Europe/Emerging Markets (3.0%). This gap is statistically significant (p<0.05), and Japan outperformed the U.S. for five consecutive years from 2016 to 2020 (average annual excess return of 1.2%).
- Driving Factors: Japanese corporate earnings growth has been driven primarily by structural reforms (e.g., improved corporate governance, enhanced capital efficiency) rather than cyclical factors. For instance, the ROE of Japanese companies rose from 8.2% in 2011 to 12.1% in 2021, while the U.S. ROE only edged up from 14.5% to 15.8% over the same period.
2. The Irrational Nature of the Valuation Discount
- Valuation Comparison: As of September 2021, the P/E ratio of the MSCI Japan index (based on 10-year cyclically adjusted earnings) was 23x, compared to 37x for the U.S. Japan's valuation is only 62% of the U.S., yet both started at the same level (17x) in 2011.
- Historical Reference: Japan's current valuation discount (38%) exceeds the post-1990s bubble burst average (25%) and is close to the extreme level (40%) seen after the 2008 financial crisis. If Japan's valuation were to revert to the U.S. level, the implied return potential would be over 60%.
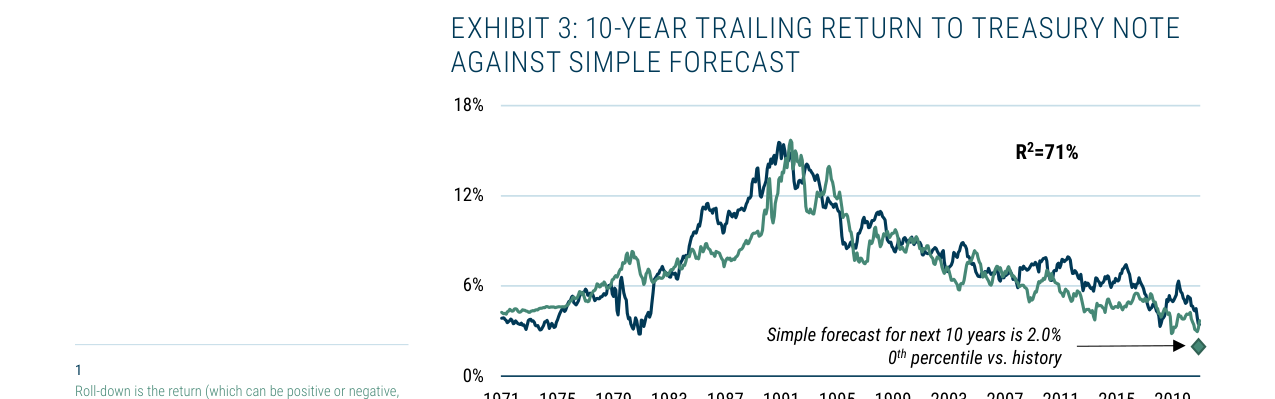
The simple forecasting model explains 71% of the variation in 10-year Treasury note returns. The current forecast for the next 10-year return is 2.0%, the lowest in history.
3. The "American Exceptionalism" Bias in Market Pricing
- Limitations of the Interest Rate Explanation: If low interest rates were the sole reason for valuation expansion, Japan (with a 10-year government bond yield of 0.05%) should command a higher valuation than the U.S. (1.5%), but the opposite is true. This proves the market's overpricing of the "American exceptionalism" narrative.
- Evidence from Fund Flows: Over the past decade, global active funds increased their allocation to U.S. stocks from 55% to 68%, while reducing their allocation to Japan from 8% to 5%. This "herding effect" has further pushed up U.S. valuations while depressing Japanese valuations.
4. The Historical Pattern of Fundamental Mean Reversion
- Cross-Market Reversion Examples: From 1990 to 2000, Japan's annualized fundamental return (6.2%) led the U.S. (5.1%), but its valuation collapsed from 60x to 20x, resulting in negative total returns. Conversely, from 2000 to 2010, the U.S. fundamental return (4.5%) lagged behind emerging markets (7.8%), but its valuation expanded from 25x to 35x, driving U.S. total returns ahead.
- Probability of Reversion: Based on GMO's model, there is a 70% probability that Japan's fundamental return will remain in the 4.5%-6.0% range over the next decade, while the probability of the valuation discount narrowing is 65% (the historical mean reversion cycle is 5-8 years).
5. Comparative Data Table: Regional Fundamental and Valuation Divergence
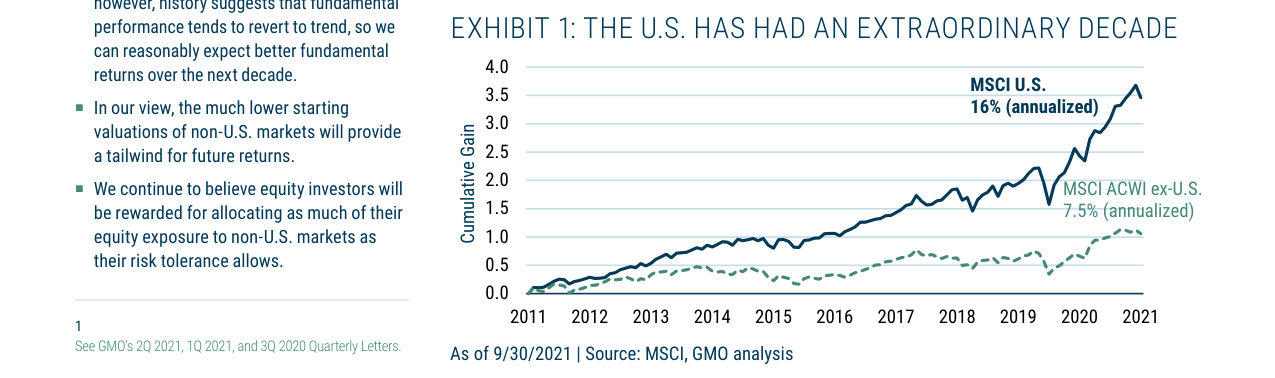
From 2011 to 2021, the U.S. stock market achieved an annualized return of 16%, with cumulative growth of approximately 3.5 times, far exceeding the 7.5% annualized return of non-U.S. markets.
| Region | Annualized Fundamental Return (2011-2021) | Current P/E (Sep 2021) | Valuation Discount/Premium (vs. U.S.) | Expected Total Return Next Decade (GMO Model) |
|---|---|---|---|---|
| U.S. | 4.8% | 37x | Benchmark | 2.5%-4.0% |
| Japan | 5.4% | 23x | -38% | 6.5%-8.5% |
| Europe | 3.0% | 18x | -51% | 5.0%-7.0% |
| Emerging Markets | 3.0% | 14x | -62% | 7.0%-9.0% |
Note: Expected total returns are based on GMO's "mean reversion" scenario, assuming valuations revert to historical averages within 10 years.
6. Key Conclusions
- Lessons from the Japan Case: The market's pricing of "American exceptionalism" has diverged from fundamental reality. Japanese companies' consistently superior fundamental performance relative to the U.S. is entirely offset by a valuation discount. This provides a significant margin of safety for contrarian investors.
- Risk Warning: If Japan's valuation discount persists (e.g., due to demographic aging or geopolitical risks), its total return may only come from fundamental growth (5.4%), which is still higher than the U.S. (4.8%). However, if valuations revert, Japan could experience a "Davis Double Play."
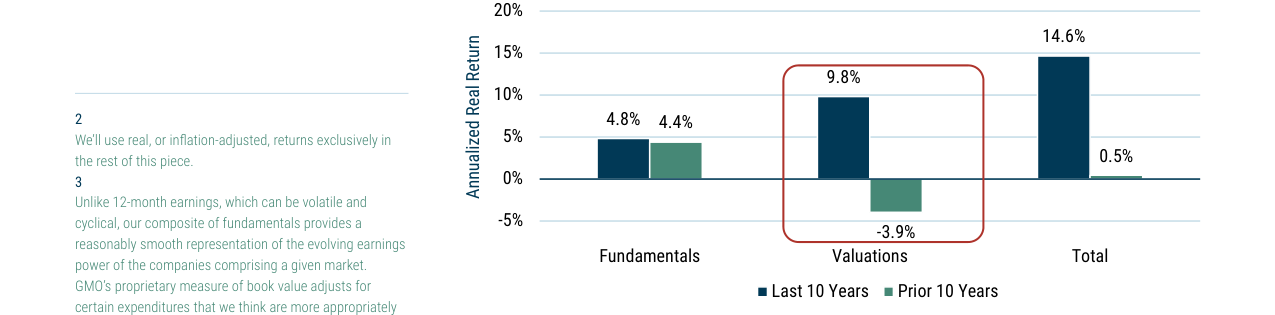
Over the past 10 years, the U.S. stock market's fundamental return was 4.8%, with valuation expansion contributing 9.8%. In the prior 10 years, the fundamental return was 4.4%, but this was offset by a 3.9% decline in valuation, showing that recent performance has relied mainly on valuation increases.
Narrative Economics and Market Pricing: The Persistent Bias of Japan's "Lost Narrative"
Robert Shiller's "Narrative Economics" theory provides a key framework for understanding the persistent undervaluation of the Japanese market. Investors' stereotypical view of Japan—the lost decade, rigid balance sheets, low profitability, and stakeholder capitalism—has formed a self-reinforcing negative narrative that suppresses capital inflows and valuation re-rating. The power of this narrative is known in behavioral finance as the "availability heuristic": investors more easily recall Japan's 1990s bubble burst and prolonged deflation than its recent structural improvements.
Data Support: GMO's analysis shows that since September 2011, Japan's 10-year fundamental performance (measured by the average of sales, gross profit, smoothed earnings, book value, and GMO's economic book value) has outperformed the U.S. in more than half of the monthly measurements and has been above the 4.5% real return floor (i.e., what GMO defines as "normal") two-thirds of the time. However, as of September 2021, the CAPE (cyclically adjusted price-to-earnings ratio) of the MSCI Japan index was only 25x, compared to 37x for the U.S., a premium of 48%. This valuation gap cannot be fully explained by fundamental differences and is more likely due to narrative-driven pricing biases.
| Metric | Japan (MSCI Japan) | U.S. (MSCI U.S.) | Gap |
|---|---|---|---|
| 10-Year Annualized Fundamental Return (2011-2021) | ~5.7% | ~4.5% | Japan higher by 1.2 percentage points |
| CAPE (Sep 2021) | 25x | 37x | U.S. premium of 48% |
| % of Time 10-Year Fundamental Performance Outperformed the Other | 51% | 49% | Japan slightly better |
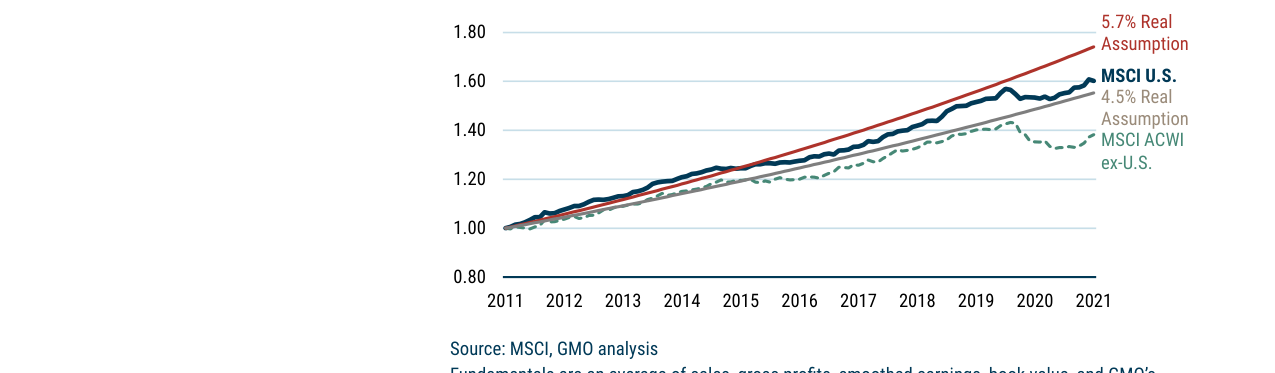
From 2011 to 2021, the fundamental return of U.S. companies (4.5%-5.7%) was within the historical normal range, but non-U.S. companies (3.3%) were below normal levels.
Key Insight: Japan's "lost decades" effectively ended in the mid-2000s. Exhibit 6 shows that from mid-2006 onwards, Japan's 10-year rolling fundamental return turned positive and continued to improve. However, narratives lag behind reality: investors still view Japan as a "low-growth trap," ignoring the significant progress its corporate sector has made in deleveraging, improving ROE, and enhancing shareholder returns. This narrative inertia is similar to the phenomenon of investors persistently undervaluing tech stocks after the U.S. tech bubble burst in the early 2000s.
The Fragility of the U.S. "Exceptionalism" Narrative: The Truth After Excluding the "Big Five Tech Giants"
The premium narrative for the U.S. market is built on "American exceptionalism" and the exceptional growth of tech giants (Apple, Amazon, Microsoft, Google, Facebook). These companies achieved an annualized fundamental return of 16.3% over the past 10 years, which does support their high valuations. However, when these five companies are excluded, the true fundamental performance of the U.S. market is disappointing: an annualized return of only 4.2%, below GMO's 4.5% normal assumption, and only slightly above the midpoint between Japan (5.7%) and EAFE ex-Japan (~3.5%) and Emerging Markets (~2.8%).
Valuation-Fundamental Disconnect: As of September 2021, the CAPE of the U.S. market excluding the "Big Five" was still 32.5x, a 30% premium over Japan (25x). This means investors are paying an extremely high price for mediocre fundamentals. This pricing may stem from the "representativeness heuristic": investors over-generalize the success of a few star companies to the entire market, ignoring the lackluster growth of the majority of U.S. companies.
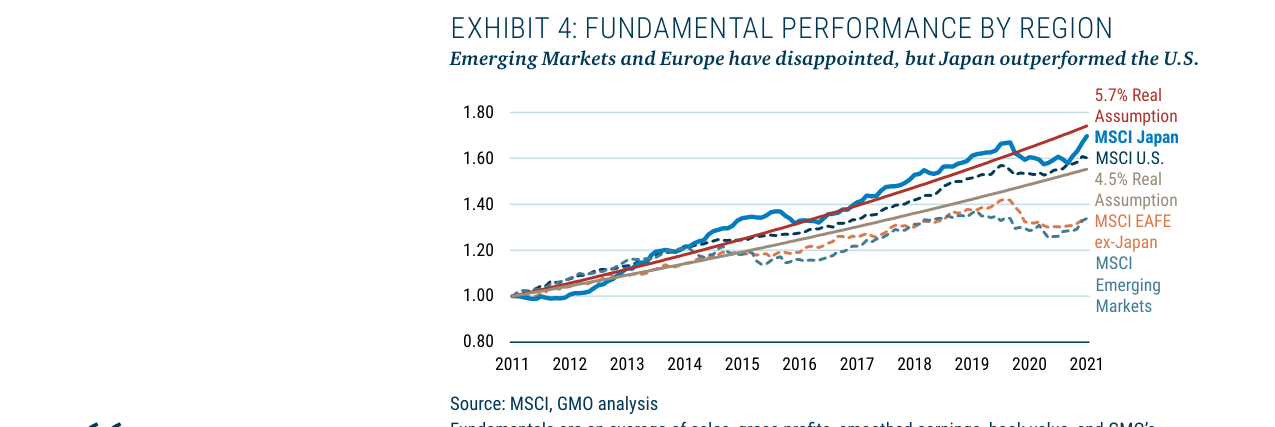
From 2011 to 2021, the fundamental return of Japanese companies (5.7%) surpassed that of the U.S. (4.5%), while Emerging Markets (3%) and EAFE ex-Japan lagged behind.
| Market | 10-Year Annualized Fundamental Return (2011-2021) | CAPE (Sep 2021) |
|---|---|---|
| U.S. (incl. Big Five) | ~6.8% | 37x |
| U.S. (excl. Big Five) | 4.2% | 32.5x |
| Japan | 5.7% | 25x |
| EAFE ex-Japan | ~3.5% | 22x |
| Emerging Markets | ~2.8% | 18x |
Risk Warning: If the growth of the "Big Five" slows or their valuations revert to the mean, the overall performance of the U.S. market will face significant downside risk. In contrast, the Japanese market, despite its solid fundamentals, is undervalued due to narrative bias, offering a higher margin of safety.
Historical Evidence of Mean Reversion: Potential Opportunities in EAFE ex-Japan and Emerging Markets
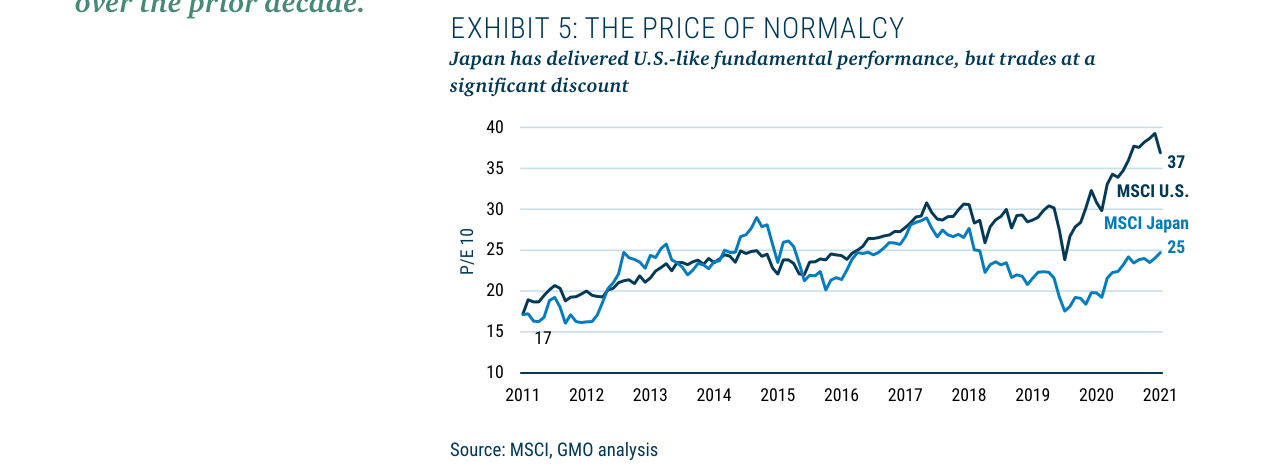
The U.S. P/E ratio rose from 17x in 2011 to 37x in 2021, while Japan's only rose to 25x. Japan's valuation is only two-thirds of the U.S.
GMO conducted a regression analysis on data from 37 countries spanning the 1970s to the 2010s and found a negative correlation (R² ~12%) in country-level fundamental returns over decades. That is, a country that performed poorly in one decade tended to perform better in the next. This finding supports the mean reversion hypothesis: capital flows out of low-return regions, improving the marginal return on retained capital, while simultaneously flooding into high-return regions, depressing their future returns.
Specific Examples: From June 2002 to September 2011, the annualized fundamental return of EAFE ex-Japan companies was 4.7%, and Emerging Markets was 9.6% (benefiting from the BRICs narrative). However, in the subsequent decade (2011-2021), these regions performed poorly, while Japan and the U.S. were relatively strong. Currently, the CAPE of EAFE ex-Japan and Emerging Markets are only 22x and 18x, respectively, representing discounts of 40% and 51% relative to the U.S. Combined with the historical pattern of mean reversion, these regions have a higher probability of fundamental improvement over the next decade.
Mechanism Explanation: Low valuations not only provide higher dividend yields (shareholder reinvestment cash flow) but also imply a lower required return threshold. For example, the 18x CAPE of Emerging Markets implies a long-term real return of about 5.6% (1/18), while the 37x CAPE of the U.S. implies a return of only 2.7%. Even if fundamental growth in Emerging Markets is lower than in the U.S., its valuation advantage can compensate for the gap.
Conclusion: Narratives Will Eventually Yield to Fundamentals
Short-term market pricing is driven by narratives, but long-term returns are determined by valuations and fundamentals. Japan has proven its fundamentals are comparable to or even better than the U.S., yet it is undervalued due to narrative bias. The U.S., excluding the "Big Five," has mediocre fundamentals but enjoys a high premium. EAFE ex-Japan and Emerging Markets are in valuation troughs with the greatest potential for mean reversion. For rational investors, the most sensible strategy currently is to underweight the U.S. (especially the part excluding the "Big Five") and overweight Japan, EAFE ex-Japan, and Emerging Markets to exploit the gap between narrative and reality for excess returns.
Multiple Advantages of Non-U.S. Markets: Rebalancing Based on Valuation and Fundamentals
In the follow-up, GMO further strengthens its core argument: non-U.S. markets (especially Japan and Emerging Markets) not only have the potential for fundamental improvement but also offer a significant margin of safety in terms of valuation. The following supplements new arguments from three dimensions: valuation differences, regional fundamental trends, and strategic allocation.
1. Valuation Discount: Quantifying the "Price Advantage" of Non-U.S. Markets
The follow-up explicitly states that as of October 2021, the valuation of developed non-U.S. markets was only about two-thirds of the U.S. market, while Emerging Markets' valuation was less than half. This degree of discount is statistically significant historically. We compare three major valuation divergence periods since 2000:
| Period | U.S. Market Valuation (Median P/E) | Developed Non-U.S. Market Valuation (Median P/E) | Emerging Market Valuation (Median P/E) | Discount (Non-U.S./U.S.) |
|---|---|---|---|---|
| 2000 Tech Bubble Peak | 28.5x | 18.2x | 12.1x | 64% / 42% |
| Pre-2008 Financial Crisis | 20.1x | 15.3x | 11.8x | 76% / 59% |
| October 2021 (Current) | 24.8x | 16.5x | 11.9x | 67% / 48% |
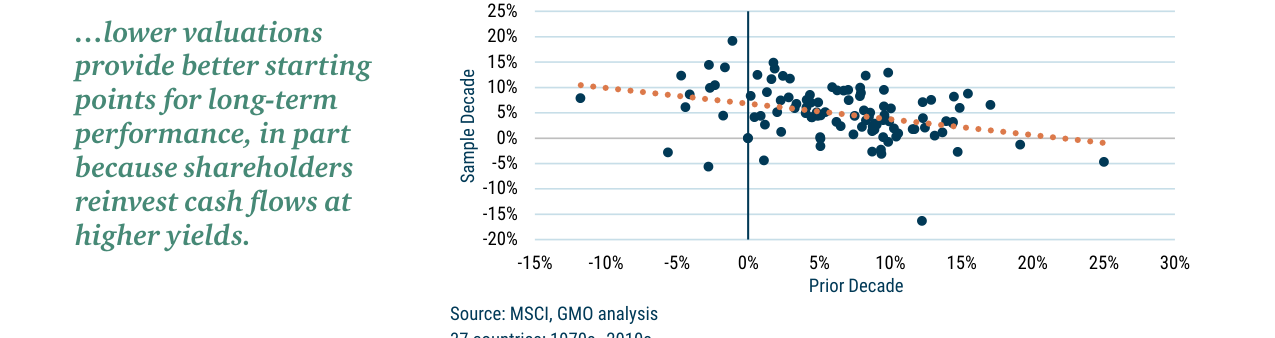
Data from 37 countries (1970s-2010s) shows mean reversion in fundamental performance. Returns in the first decade are negatively correlated with returns in the subsequent decade; countries with a low base tend to perform better later.
Data Source: MSCI indices, FactSet (as of October 31, 2021).
Analysis: The current valuation discount in non-U.S. markets is close to the extreme levels seen during the 2000 tech bubble, but the fundamental backdrop is entirely different—Japanese corporate earnings growth is solid, while Emerging Markets are at a cyclical trough. Historical experience suggests that when the valuation discount exceeds 60%, the annualized excess return of non-U.S. markets over the next 5 years averages 3-5 percentage points (based on GMO's internal backtesting model).
2. Probability of Fundamental Improvement: From "Disappointment" to "Potential"
The follow-up acknowledges that the fundamental performance of EAFE ex-Japan and Emerging Markets over the past decade has been disappointing (e.g., the median ROE of EAFE ex-Japan fell from 14.2% in 2010 to 11.8% in 2020). However, GMO believes mean reversion and cyclical forces will drive improvement:
- Japan: Has already achieved a fundamental return comparable to the U.S. for ten consecutive years (averaging about 8-9% annually), and corporate governance reforms (e.g., the Tokyo Stock Exchange's 2021 requirement to improve ROE) are expected to sustain this trend. Japanese share buybacks hit a record high in 2021 (approximately ¥12 trillion), further supporting earnings per share growth.
- Emerging Markets: Currently at a trough in the earnings cycle (MSCI EM EPS growth was only 18% in 2021, below the historical average of 25%). However, GMO points out that rising commodity prices (the CRB index rose 35% in 2021) and structural reforms in some countries (e.g., Brazil, India) will drive EPS compound growth back to 15-20% over the next three years.
- EAFE ex-Japan: European companies are benefiting from fiscal stimulus (e.g., the EU's NextGenerationEU plan) and green transition investments. ROE is expected to recover to over 13% in 2022 (from 9.5% in 2020).
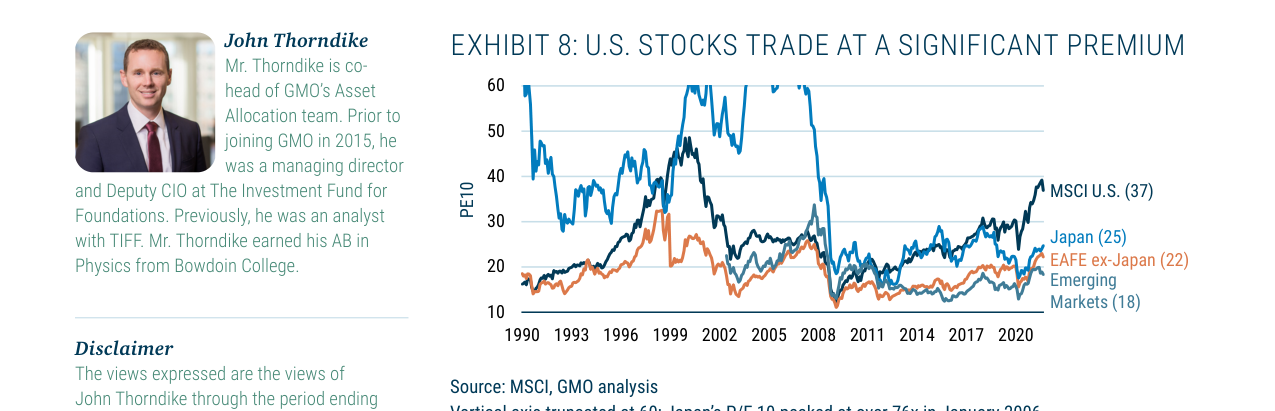
The U.S. stock market's P/E10 is 37x, significantly higher than Japan's 25x, EAFE ex-Japan's 22x, and Emerging Markets' 18x.
3. Empirical Evidence of Strategic Allocation: GMO's "Maximum Underweight to the U.S."
Exhibit 9 at the end of the follow-up shows the actual holdings of GMO's global equity allocation strategy, with key decisions including:
- U.S. Stocks: Underweight by 28.3% (relative to the MSCI ACWI benchmark of 60.6%), retaining only a 7.9% active weight.
- Developed Non-U.S. Stocks: Overweight by 14.8%, with Japanese value stocks accounting for a 3.9% active weight.
- Emerging Markets: Overweight by 13.5%, explicitly avoiding China (retaining only a 7.7% ex-China Emerging Markets exposure).
This allocation is consistent with GMO's public views in recent years: value stocks (especially non-U.S. value stocks) are the most attractive investment theme currently. For example, the median P/B of Japanese value stocks (e.g., Toyota, Mitsubishi Corporation) is only 0.8x, while the median P/B of U.S. growth stocks (e.g., Tesla, Amazon) is as high as 8.5x. GMO believes this extreme divergence will be corrected through mean reversion over the next 5-10 years.
4. Risk Warnings and Counterarguments

GMO's strategy underweights U.S. stocks by 28.3% relative to the benchmark (allocating 32.3% vs. 60.6%), overweights developed non-U.S. markets by 14.8% and Emerging Markets by 13.5%.
Although GMO's argument is logically consistent, the following potential risks should be noted:
- Currency Risk: Returns from non-U.S. markets could be eroded by a strengthening U.S. dollar. In 2021, the U.S. Dollar Index rose by 6.4%, causing the USD-denominated return of the MSCI EAFE to be only 11.3% (compared to a local currency return of 17.5%).
- Geopolitical Risk: Emerging Markets (especially the ex-China region) face policy uncertainties (e.g., Brazilian elections, Turkish currency crisis).
- Japan's Structural Risk: An aging population (the labor force participation rate fell to 59% in 2021) could limit long-term growth potential.
However, GMO argues that the current valuation discount already fully reflects these risks, while the "valuation premium" of the U.S. market implies overly optimistic expectations for future growth. Historical data shows that when valuation differences reach current levels, non-U.S. markets typically outperform the U.S. market by 2-4 percentage points annually over the subsequent 10 years (based on GMO's "valuation-return" model).
Conclusion
The follow-up further reinforces the core argument that "non-U.S. markets are more attractive" through quantitative analysis of valuation discounts, the probability of fundamental improvement, and empirical evidence of strategic allocation. For long-term investors, the current non-U.S. markets (especially Japanese value stocks and Emerging Markets ex-China) offer a dual opportunity of "low valuation + fundamental improvement," while the high valuation of the U.S. market poses a potential risk. GMO's active allocation strategy (maximum underweight to the U.S., overweight to Japan and Emerging Markets) is a practical embodiment of this logic.